| Multiple Linear Regression - Estimated Regression Equation |
| Y[t] = + 5545.45096713486 -0.178613936386478X[t] + 43.6242818380755M1[t] -931.523238964048M2[t] -737.34522798693M3[t] -574.60293979709M4[t] -229.603780800123M5[t] -869.626245910535M6[t] -397.169978062677M7[t] -609.621116620415M8[t] -610.078828430576M9[t] + 70.0960717549703M10[t] -371.561402011425M11[t] -12.7493375297899t + e[t] |
| Multiple Linear Regression - Ordinary Least Squares | |||||
| Variable | Parameter | S.D. | T-STAT H0: parameter = 0 | 2-tail p-value | 1-tail p-value |
| (Intercept) | 5545.45096713486 | 299.696813 | 18.5035 | 0 | 0 |
| X | -0.178613936386478 | 0.128893 | -1.3857 | 0.172364 | 0.086182 |
| M1 | 43.6242818380755 | 346.62469 | 0.1259 | 0.900384 | 0.450192 |
| M2 | -931.523238964048 | 363.852446 | -2.5602 | 0.013736 | 0.006868 |
| M3 | -737.34522798693 | 363.376425 | -2.0291 | 0.048128 | 0.024064 |
| M4 | -574.60293979709 | 362.949809 | -1.5831 | 0.120095 | 0.060047 |
| M5 | -229.603780800123 | 362.564867 | -0.6333 | 0.529623 | 0.264811 |
| M6 | -869.626245910535 | 362.233019 | -2.4007 | 0.020373 | 0.010186 |
| M7 | -397.169978062677 | 361.961702 | -1.0973 | 0.278113 | 0.139057 |
| M8 | -609.621116620415 | 361.752756 | -1.6852 | 0.098582 | 0.049291 |
| M9 | -610.078828430576 | 361.587572 | -1.6872 | 0.098187 | 0.049094 |
| M10 | 70.0960717549703 | 373.569404 | 0.1876 | 0.851968 | 0.425984 |
| M11 | -371.561402011425 | 373.494856 | -0.9948 | 0.324917 | 0.162458 |
| t | -12.7493375297899 | 4.337665 | -2.9392 | 0.005088 | 0.002544 |
| Multiple Linear Regression - Regression Statistics | |
| Multiple R | 0.623840267592213 |
| R-squared | 0.389176679469524 |
| Adjusted R-squared | 0.220225548258967 |
| F-TEST (value) | 2.30348667499899 |
| F-TEST (DF numerator) | 13 |
| F-TEST (DF denominator) | 47 |
| p-value | 0.0186249399858107 |
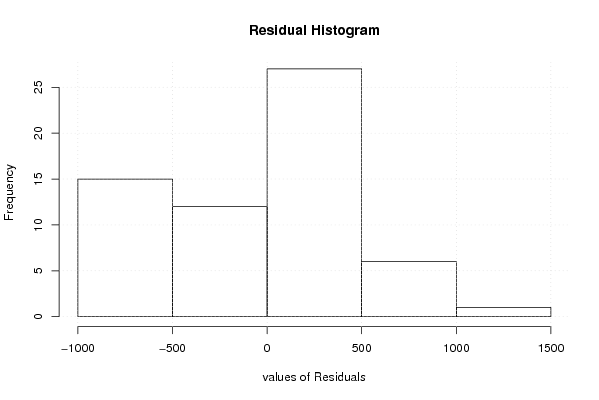
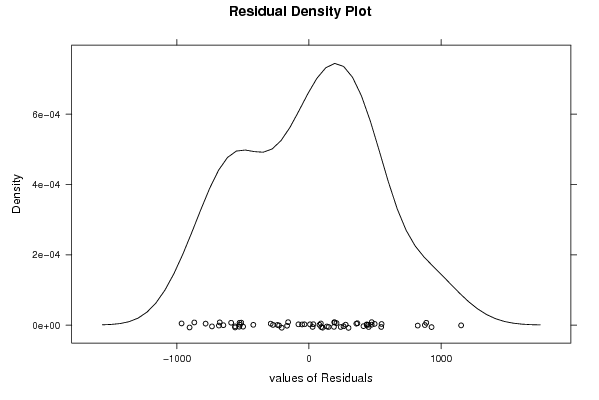
| Multiple Linear Regression - Residual Statistics | |
| Residual Standard Deviation | 571.339391925744 |
| Sum Squared Residuals | 15342148.9360057 |
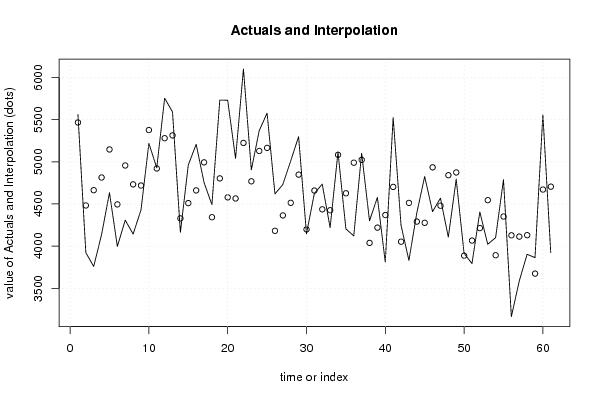
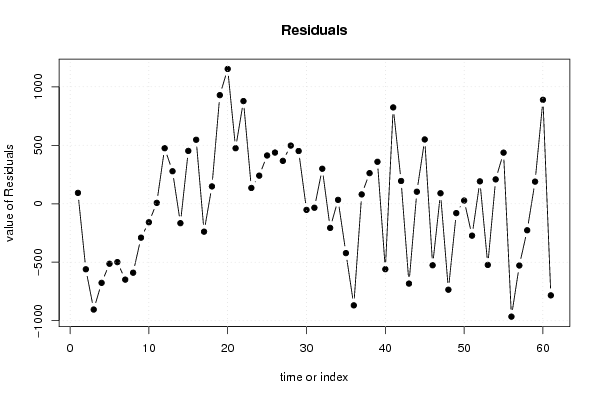
| Multiple Linear Regression - Actuals, Interpolation, and Residuals | |||
| Time or Index | Actuals | Interpolation Forecast | Residuals Prediction Error |
| 1 | 5560 | 5467.19279631102 | 92.8072036889818 |
| 2 | 3922 | 4482.33237489767 | -560.332374897667 |
| 3 | 3759 | 4663.58243440861 | -904.582434408608 |
| 4 | 4138 | 4814.2898408142 | -676.289840814204 |
| 5 | 4634 | 5146.89689015415 | -512.896890154154 |
| 6 | 3996 | 4495.01815719588 | -499.018157195885 |
| 7 | 4308 | 4956.6898408142 | -648.689840814204 |
| 8 | 4143 | 4732.56104834499 | -589.561048344993 |
| 9 | 4429 | 4718.99677113227 | -289.996771132271 |
| 10 | 5219 | 5377.13440909593 | -158.134409095932 |
| 11 | 4929 | 4921.29868630865 | 7.701313691347 |
| 12 | 5755 | 5280.28936472668 | 474.710635273324 |
| 13 | 5592 | 5314.02213201714 | 277.977867982856 |
| 14 | 4163 | 4329.1617106038 | -166.161710603801 |
| 15 | 4962 | 4510.23315617836 | 451.766843821644 |
| 16 | 5208 | 4660.94056258395 | 547.059437416048 |
| 17 | 4755 | 4993.72622586029 | -238.726225860288 |
| 18 | 4491 | 4342.74056258395 | 148.259437416048 |
| 19 | 5732 | 4803.51917652034 | 928.480823479661 |
| 20 | 5731 | 4578.49731436920 | 1152.50268563080 |
| 21 | 5040 | 4565.29026502925 | 474.709734970753 |
| 22 | 6102 | 5224.32097267484 | 877.679027325162 |
| 23 | 4904 | 4768.84247776033 | 135.157522239666 |
| 24 | 5369 | 5128.72622586029 | 240.273774139712 |
| 25 | 5578 | 5165.31681613294 | 412.683183867059 |
| 26 | 4619 | 4181.34946440153 | 437.65053559847 |
| 27 | 4731 | 4364.38566327634 | 366.614336723664 |
| 28 | 5011 | 4513.66415819084 | 497.33584180916 |
| 29 | 5299 | 4848.05734689465 | 450.942653105345 |
| 30 | 4146 | 4198.32198117302 | -52.3219811730241 |
| 31 | 4625 | 4659.10059510941 | -34.1005951094108 |
| 32 | 4736 | 4436.57932806768 | 299.420671932320 |
| 33 | 4219 | 4425.51564596437 | -206.515645964367 |
| 34 | 5116 | 5082.93882818248 | 33.0611718175198 |
| 35 | 4205 | 4626.74587752243 | -421.74587752243 |
| 36 | 4121 | 4989.66606254095 | -868.666062540955 |
| 37 | 5103 | 5023.22021589504 | 79.7797841049627 |
| 38 | 4300 | 4038.35979448169 | 261.640205518306 |
| 39 | 4578 | 4219.07401218348 | 358.925987816524 |
| 40 | 3809 | 4368.53112103437 | -559.531121034367 |
| 41 | 5526 | 4702.38846792902 | 823.611532070978 |
| 42 | 4247 | 4052.29587433462 | 194.704125665382 |
| 43 | 3830 | 4512.53864646185 | -682.538646461845 |
| 44 | 4394 | 4291.08906303843 | 102.910936961568 |
| 45 | 4826 | 4276.27448827100 | 549.725511728995 |
| 46 | 4409 | 4934.76935410744 | -525.769354107436 |
| 47 | 4569 | 4479.29085919293 | 89.7091408070676 |
| 48 | 4106 | 4840.96074665675 | -734.960746656751 |
| 49 | 4794 | 4873.97905820167 | -79.9790582016743 |
| 50 | 3914 | 3886.79665561531 | 27.2033443846928 |
| 51 | 3793 | 4065.72473395322 | -272.724733953224 |
| 52 | 4405 | 4213.57431737664 | 191.425682623363 |
| 53 | 4022 | 4544.93106916188 | -522.931069161881 |
| 54 | 4100 | 3891.62342471252 | 208.376575287479 |
| 55 | 4788 | 4351.1517410942 | 436.848258905798 |
| 56 | 3163 | 4128.2732461797 | -965.273246179697 |
| 57 | 3585 | 4112.92282960311 | -527.92282960311 |
| 58 | 3903 | 4129.83643593931 | -226.836435939314 |
| 59 | 3863 | 3673.82209921565 | 189.177900784350 |
| 60 | 5560 | 4671.35760021533 | 888.64239978467 |
| 61 | 3922 | 4705.26898144219 | -783.268981442186 |
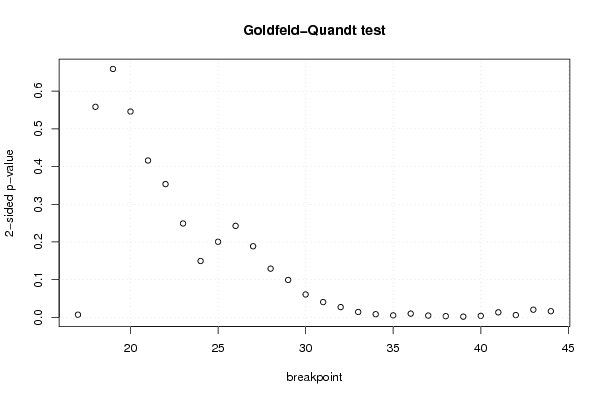
| Goldfeld-Quandt test for Heteroskedasticity | |||
| p-values | Alternative Hypothesis | ||
| breakpoint index | greater | 2-sided | less |
| 17 | 0.00352393339620639 | 0.00704786679241279 | 0.996476066603794 |
| 18 | 0.279201108525888 | 0.558402217051775 | 0.720798891474112 |
| 19 | 0.32942524247894 | 0.65885048495788 | 0.67057475752106 |
| 20 | 0.272934400868930 | 0.545868801737859 | 0.72706559913107 |
| 21 | 0.208033987062736 | 0.416067974125472 | 0.791966012937264 |
| 22 | 0.176742739248849 | 0.353485478497698 | 0.823257260751151 |
| 23 | 0.124501551420967 | 0.249003102841934 | 0.875498448579033 |
| 24 | 0.0747654537545707 | 0.149530907509141 | 0.92523454624543 |
| 25 | 0.100263693078561 | 0.200527386157122 | 0.899736306921439 |
| 26 | 0.121344619319745 | 0.24268923863949 | 0.878655380680255 |
| 27 | 0.0943150869319566 | 0.188630173863913 | 0.905684913068043 |
| 28 | 0.0646269068686442 | 0.129253813737288 | 0.935373093131356 |
| 29 | 0.0496015187771972 | 0.0992030375543944 | 0.950398481222803 |
| 30 | 0.0303758244930927 | 0.0607516489861855 | 0.969624175506907 |
| 31 | 0.0203143350695838 | 0.0406286701391677 | 0.979685664930416 |
| 32 | 0.0136087644662809 | 0.0272175289325618 | 0.986391235533719 |
| 33 | 0.00716531117538735 | 0.0143306223507747 | 0.992834688824613 |
| 34 | 0.00420281629286002 | 0.00840563258572004 | 0.99579718370714 |
| 35 | 0.00266077896085997 | 0.00532155792171993 | 0.99733922103914 |
| 36 | 0.00496786663914813 | 0.00993573327829625 | 0.995032133360852 |
| 37 | 0.00239552373087841 | 0.00479104746175681 | 0.997604476269122 |
| 38 | 0.00160825314455389 | 0.00321650628910778 | 0.998391746855446 |
| 39 | 0.000965885060487031 | 0.00193177012097406 | 0.999034114939513 |
| 40 | 0.00202659672565713 | 0.00405319345131426 | 0.997973403274343 |
| 41 | 0.00668639066215063 | 0.0133727813243013 | 0.99331360933785 |
| 42 | 0.00307349105499155 | 0.00614698210998309 | 0.996926508945008 |
| 43 | 0.0101851642349802 | 0.0203703284699604 | 0.98981483576502 |
| 44 | 0.00819230429600075 | 0.0163846085920015 | 0.991807695704 |
| Meta Analysis of Goldfeld-Quandt test for Heteroskedasticity | |||
| Description | # significant tests | % significant tests | OK/NOK |
| 1% type I error level | 9 | 0.321428571428571 | NOK |
| 5% type I error level | 15 | 0.535714285714286 | NOK |
| 10% type I error level | 17 | 0.607142857142857 | NOK |