| Multiple Linear Regression - Estimated Regression Equation |
| Y[t] = + 1781.33973794529 + 0.0538006313056124X[t] + 0.119501855681305`yt-1`[t] + 0.063586039545287`yt-2`[t] + 0.311071408572704`yt-3`[t] + 0.140670870471306`yt-4`[t] + 445.120233686327M1[t] -139.148884123066M2[t] + 317.064608308976M3[t] -33.4253531581604M4[t] + 117.406862236303M5[t] + 623.118184091766M6[t] + 183.848976303235M7[t] + 330.214447746130M8[t] + 600.959567741939M9[t] -370.074056974433M10[t] + 22.8431456711585M11[t] -11.0948669738725t + e[t] |
| Multiple Linear Regression - Ordinary Least Squares | |||||
| Variable | Parameter | S.D. | T-STAT H0: parameter = 0 | 2-tail p-value | 1-tail p-value |
| (Intercept) | 1781.33973794529 | 2001.202233 | 0.8901 | 0.378852 | 0.189426 |
| X | 0.0538006313056124 | 3.067879 | 0.0175 | 0.986098 | 0.493049 |
| `yt-1` | 0.119501855681305 | 0.155038 | 0.7708 | 0.445475 | 0.222737 |
| `yt-2` | 0.063586039545287 | 0.145908 | 0.4358 | 0.665387 | 0.332693 |
| `yt-3` | 0.311071408572704 | 0.145828 | 2.1331 | 0.039261 | 0.019631 |
| `yt-4` | 0.140670870471306 | 0.153352 | 0.9173 | 0.36462 | 0.18231 |
| M1 | 445.120233686327 | 379.279941 | 1.1736 | 0.247676 | 0.123838 |
| M2 | -139.148884123066 | 371.690113 | -0.3744 | 0.710158 | 0.355079 |
| M3 | 317.064608308976 | 366.794029 | 0.8644 | 0.392642 | 0.196321 |
| M4 | -33.4253531581604 | 331.088768 | -0.101 | 0.920103 | 0.460051 |
| M5 | 117.406862236303 | 374.377619 | 0.3136 | 0.755492 | 0.377746 |
| M6 | 623.118184091766 | 348.476406 | 1.7881 | 0.081528 | 0.040764 |
| M7 | 183.848976303235 | 365.717799 | 0.5027 | 0.617997 | 0.308999 |
| M8 | 330.214447746130 | 389.672665 | 0.8474 | 0.401935 | 0.200967 |
| M9 | 600.959567741939 | 351.312895 | 1.7106 | 0.095098 | 0.047549 |
| M10 | -370.074056974433 | 377.365426 | -0.9807 | 0.332796 | 0.166398 |
| M11 | 22.8431456711585 | 382.799807 | 0.0597 | 0.95272 | 0.47636 |
| t | -11.0948669738725 | 7.208704 | -1.5391 | 0.131857 | 0.065928 |
| Multiple Linear Regression - Regression Statistics | |
| Multiple R | 0.775654730445256 |
| R-squared | 0.601640260862102 |
| Adjusted R-squared | 0.427996272007121 |
| F-TEST (value) | 3.46479175483905 |
| F-TEST (DF numerator) | 17 |
| F-TEST (DF denominator) | 39 |
| p-value | 0.000662408025575933 |
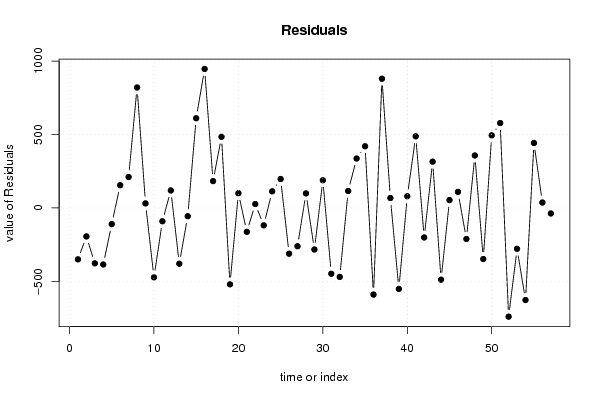
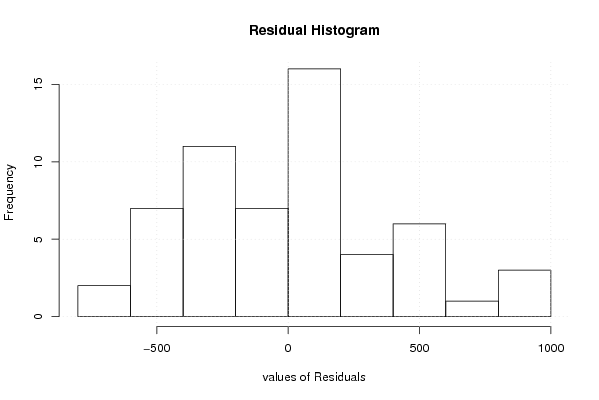
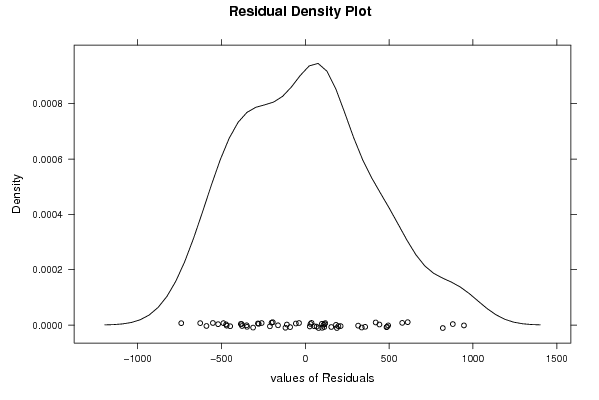
| Multiple Linear Regression - Residual Statistics | |
| Residual Standard Deviation | 471.696718242219 |
| Sum Squared Residuals | 8677413.9660187 |
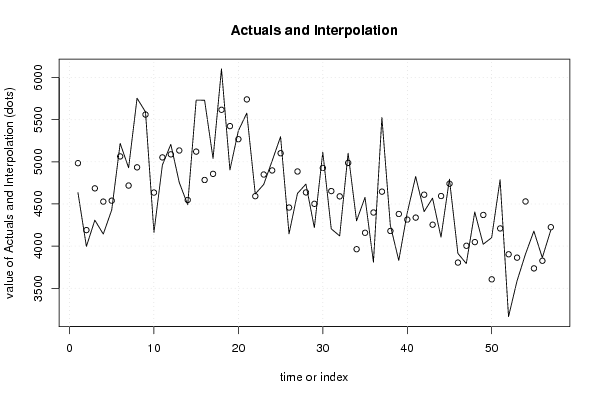
| Multiple Linear Regression - Actuals, Interpolation, and Residuals | |||
| Time or Index | Actuals | Interpolation Forecast | Residuals Prediction Error |
| 1 | 4634 | 4983.90799608805 | -349.907996088049 |
| 2 | 3996 | 4189.87790454883 | -193.877904548833 |
| 3 | 4308 | 4685.31353429033 | -377.313534290328 |
| 4 | 4143 | 4527.83586762746 | -384.835867627459 |
| 5 | 4429 | 4538.89584602054 | -109.895846020537 |
| 6 | 5219 | 5064.23539605947 | 154.76460394053 |
| 7 | 4929 | 4718.43411682344 | 210.565883176561 |
| 8 | 5755 | 4934.71507982185 | 820.284920178148 |
| 9 | 5592 | 5560.71979715826 | 31.2802028417440 |
| 10 | 4163 | 4635.35148367051 | -472.351483670506 |
| 11 | 4962 | 5052.62197922258 | -90.6219792225772 |
| 12 | 5208 | 5088.73719753734 | 119.262802462664 |
| 13 | 4755 | 5134.65406150597 | -379.65406150597 |
| 14 | 4491 | 4547.41067264111 | -56.4106726411114 |
| 15 | 5732 | 5121.20352556347 | 610.796474436529 |
| 16 | 5731 | 4784.60826911029 | 946.39173088971 |
| 17 | 5040 | 4857.12823267029 | 182.87176732971 |
| 18 | 6102 | 5617.4698211578 | 484.530178842202 |
| 19 | 4904 | 5424.01743886163 | -520.017438861632 |
| 20 | 5369 | 5268.50837939603 | 100.491620603971 |
| 21 | 5578 | 5740.70518434306 | -162.705184343058 |
| 22 | 4619 | 4592.37763552056 | 26.6223644794431 |
| 23 | 4731 | 4849.33447980839 | -118.334479808385 |
| 24 | 5011 | 4897.90473844875 | 113.095261551251 |
| 25 | 5299 | 5101.87337208654 | 197.126627913458 |
| 26 | 4146 | 4457.48303190161 | -311.483031901609 |
| 27 | 4625 | 4885.49972335967 | -260.499723359668 |
| 28 | 4736 | 4637.03319212042 | 98.966807879584 |
| 29 | 4219 | 4501.69522849957 | -282.695228499566 |
| 30 | 5116 | 4927.48235470416 | 188.517645295838 |
| 31 | 4205 | 4653.02493156247 | -448.024931562468 |
| 32 | 4121 | 4590.44956189859 | -469.449561898586 |
| 33 | 5103 | 4987.79338289792 | 115.206617102081 |
| 34 | 4300 | 3963.48303912106 | 336.516960878944 |
| 35 | 4578 | 4158.04372050775 | 419.956279492253 |
| 36 | 3809 | 4398.68598956603 | -589.68598956603 |
| 37 | 5526 | 4646.03279250251 | 879.967207497492 |
| 38 | 4247 | 4179.56036137628 | 67.4396386237243 |
| 39 | 3830 | 4381.12113464115 | -551.121134641149 |
| 40 | 4394 | 4314.47259882343 | 79.527401176571 |
| 41 | 4826 | 4338.28096271089 | 487.719037289114 |
| 42 | 4409 | 4609.94291537314 | -200.942915373140 |
| 43 | 4569 | 4253.83885542975 | 315.161144570251 |
| 44 | 4106 | 4594.3057845092 | -488.305784509202 |
| 45 | 4794 | 4740.33768902848 | 53.6623109715226 |
| 46 | 3914 | 3804.78784168788 | 109.212158312118 |
| 47 | 3793 | 4003.99982046129 | -210.999820461290 |
| 48 | 4405 | 4047.67207444788 | 357.327925552115 |
| 49 | 4022 | 4369.53177781693 | -347.531777816930 |
| 50 | 4100 | 3605.66802953217 | 494.331970467829 |
| 51 | 4788 | 4209.86208214538 | 578.137917854617 |
| 52 | 3163 | 3903.05007231841 | -740.050072318406 |
| 53 | 3585 | 3862.99973009872 | -277.999730098722 |
| 54 | 3903 | 4529.86951270543 | -626.869512705431 |
| 55 | 4178 | 3735.68465732271 | 442.315342677286 |
| 56 | 3863 | 3826.02119437433 | 36.9788056256688 |
| 57 | 4187 | 4224.44394657229 | -37.4439465722893 |
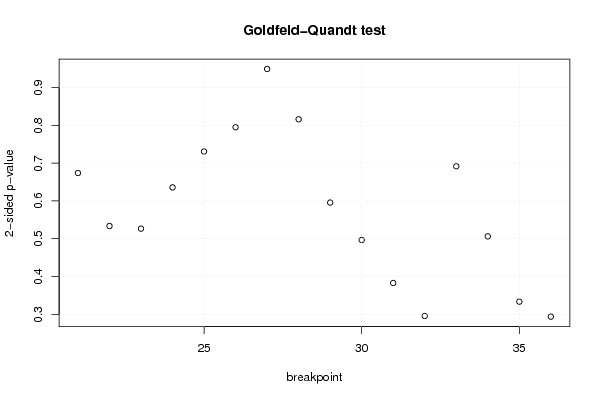
| Goldfeld-Quandt test for Heteroskedasticity | |||
| p-values | Alternative Hypothesis | ||
| breakpoint index | greater | 2-sided | less |
| 21 | 0.662964961603254 | 0.674070076793493 | 0.337035038396746 |
| 22 | 0.733130240269057 | 0.533739519461885 | 0.266869759730943 |
| 23 | 0.736675627693779 | 0.526648744612442 | 0.263324372306221 |
| 24 | 0.682070806956929 | 0.635858386086143 | 0.317929193043071 |
| 25 | 0.634536480388628 | 0.730927039222744 | 0.365463519611372 |
| 26 | 0.602466343841365 | 0.79506731231727 | 0.397533656158635 |
| 27 | 0.474714330130805 | 0.94942866026161 | 0.525285669869195 |
| 28 | 0.408080510410256 | 0.816161020820513 | 0.591919489589743 |
| 29 | 0.297848401088834 | 0.595696802177667 | 0.702151598911166 |
| 30 | 0.248367650396124 | 0.496735300792247 | 0.751632349603876 |
| 31 | 0.191448818756484 | 0.382897637512967 | 0.808551181243516 |
| 32 | 0.14779965997061 | 0.29559931994122 | 0.85220034002939 |
| 33 | 0.345889984406608 | 0.691779968813215 | 0.654110015593393 |
| 34 | 0.253152422919082 | 0.506304845838163 | 0.746847577080918 |
| 35 | 0.166752103415177 | 0.333504206830354 | 0.833247896584823 |
| 36 | 0.146894256639969 | 0.293788513279939 | 0.85310574336003 |
| Meta Analysis of Goldfeld-Quandt test for Heteroskedasticity | |||
| Description | # significant tests | % significant tests | OK/NOK |
| 1% type I error level | 0 | 0 | OK |
| 5% type I error level | 0 | 0 | OK |
| 10% type I error level | 0 | 0 | OK |