| Multiple Linear Regression - Estimated Regression Equation |
| Indexprijs[t] = + 186.456470588235 -12.2956209150327M1[t] -24.0112418300654M2[t] -21.8641176470589M3[t] -20.2569934640523M4[t] -4.50986928104575M5[t] + 8.97725490196074M6[t] + 22.2243790849673M7[t] + 40.2915032679738M8[t] + 44.6786274509804M9[t] + 35.8257516339870M10[t] + 18.9328758169935M11[t] + 1.55287581699346t + e[t] |
| Multiple Linear Regression - Ordinary Least Squares | |||||
| Variable | Parameter | S.D. | T-STAT H0: parameter = 0 | 2-tail p-value | 1-tail p-value |
| (Intercept) | 186.456470588235 | 38.450053 | 4.8493 | 1.3e-05 | 7e-06 |
| M1 | -12.2956209150327 | 44.841807 | -0.2742 | 0.785108 | 0.392554 |
| M2 | -24.0112418300654 | 47.066221 | -0.5102 | 0.612278 | 0.306139 |
| M3 | -21.8641176470589 | 47.006117 | -0.4651 | 0.643939 | 0.32197 |
| M4 | -20.2569934640523 | 46.952274 | -0.4314 | 0.668082 | 0.334041 |
| M5 | -4.50986928104575 | 46.904715 | -0.0961 | 0.923802 | 0.461901 |
| M6 | 8.97725490196074 | 46.863458 | 0.1916 | 0.848893 | 0.424447 |
| M7 | 22.2243790849673 | 46.828519 | 0.4746 | 0.637231 | 0.318615 |
| M8 | 40.2915032679738 | 46.799914 | 0.8609 | 0.393556 | 0.196778 |
| M9 | 44.6786274509804 | 46.777653 | 0.9551 | 0.344299 | 0.172149 |
| M10 | 35.8257516339870 | 46.761746 | 0.7661 | 0.447348 | 0.223674 |
| M11 | 18.9328758169935 | 46.752199 | 0.405 | 0.687304 | 0.343652 |
| t | 1.55287581699346 | 0.545514 | 2.8466 | 0.006482 | 0.003241 |
| Multiple Linear Regression - Regression Statistics | |
| Multiple R | 0.503660876987238 |
| R-squared | 0.253674279007554 |
| Adjusted R-squared | 0.0670928487594425 |
| F-TEST (value) | 1.35959017288175 |
| F-TEST (DF numerator) | 12 |
| F-TEST (DF denominator) | 48 |
| p-value | 0.218275722619624 |
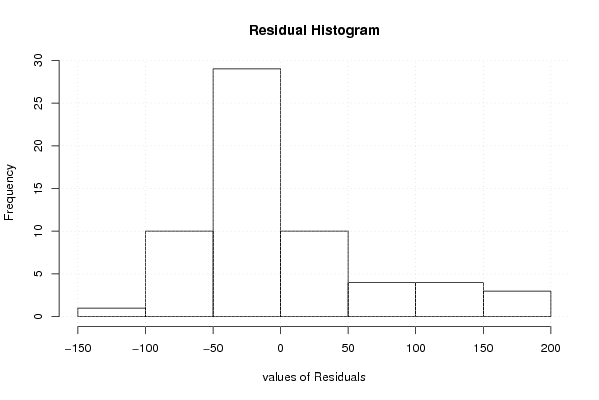
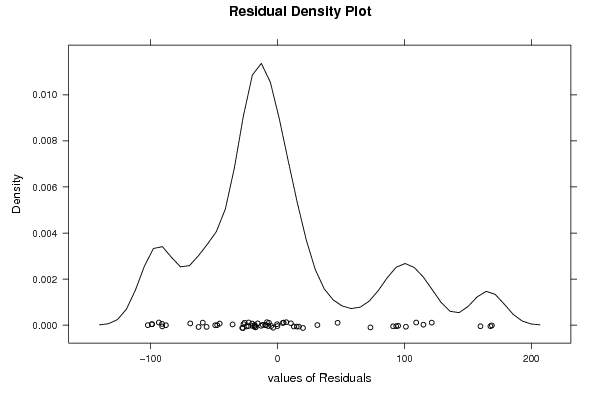
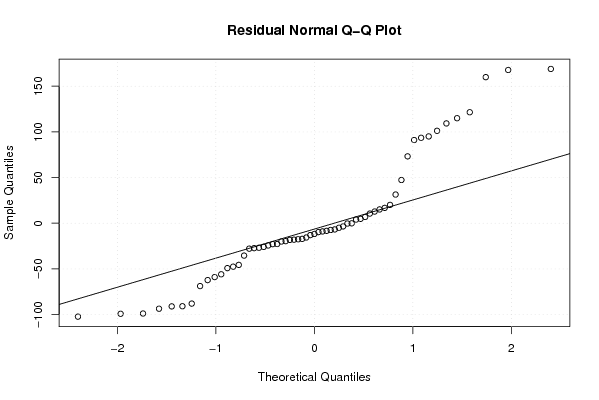
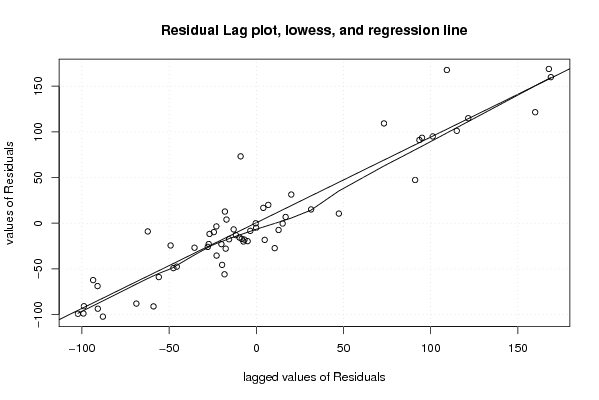
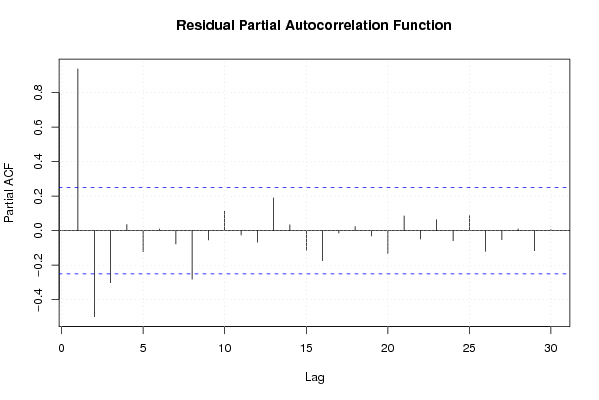
| Multiple Linear Regression - Residual Statistics | |
| Residual Standard Deviation | 73.9166856665979 |
| Sum Squared Residuals | 262256.468156863 |
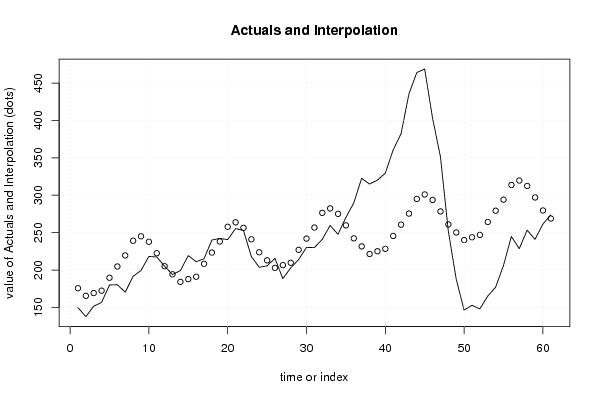
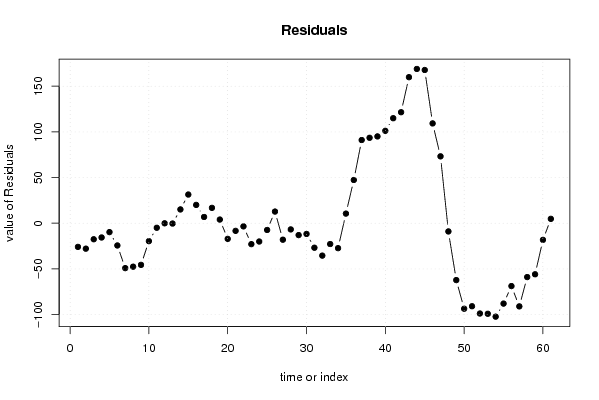
| Multiple Linear Regression - Actuals, Interpolation, and Residuals | |||
| Time or Index | Actuals | Interpolation Forecast | Residuals Prediction Error |
| 1 | 149.8 | 175.713725490196 | -25.9137254901962 |
| 2 | 137.7 | 165.550980392157 | -27.8509803921568 |
| 3 | 151.7 | 169.250980392157 | -17.5509803921568 |
| 4 | 156.8 | 172.410980392157 | -15.6109803921568 |
| 5 | 180 | 189.710980392157 | -9.71098039215681 |
| 6 | 180.4 | 204.750980392157 | -24.3509803921569 |
| 7 | 170.4 | 219.550980392157 | -49.1509803921568 |
| 8 | 191.6 | 239.170980392157 | -47.5709803921569 |
| 9 | 199.5 | 245.110980392157 | -45.6109803921567 |
| 10 | 218.2 | 237.810980392157 | -19.6109803921568 |
| 11 | 217.5 | 222.470980392157 | -4.97098039215689 |
| 12 | 205 | 205.090980392157 | -0.0909803921568542 |
| 13 | 194 | 194.348235294118 | -0.348235294117580 |
| 14 | 199.3 | 184.185490196078 | 15.1145098039215 |
| 15 | 219.3 | 187.885490196078 | 31.4145098039216 |
| 16 | 211.1 | 191.045490196078 | 20.0545098039215 |
| 17 | 215.2 | 208.345490196078 | 6.85450980392158 |
| 18 | 240.2 | 223.385490196078 | 16.8145098039216 |
| 19 | 242.2 | 238.185490196078 | 4.01450980392158 |
| 20 | 240.7 | 257.805490196078 | -17.1054901960784 |
| 21 | 255.4 | 263.745490196078 | -8.34549019607845 |
| 22 | 253 | 256.445490196078 | -3.44549019607845 |
| 23 | 218.2 | 241.105490196078 | -22.9054901960784 |
| 24 | 203.7 | 223.725490196078 | -20.0254901960784 |
| 25 | 205.6 | 212.982745098039 | -7.3827450980392 |
| 26 | 215.6 | 202.82 | 12.7800000000000 |
| 27 | 188.5 | 206.52 | -18.02 |
| 28 | 202.9 | 209.68 | -6.78000000000001 |
| 29 | 214 | 226.98 | -12.9800000000000 |
| 30 | 230.3 | 242.02 | -11.7200000000000 |
| 31 | 230 | 256.82 | -26.82 |
| 32 | 241 | 276.44 | -35.44 |
| 33 | 259.6 | 282.38 | -22.78 |
| 34 | 247.8 | 275.08 | -27.28 |
| 35 | 270.3 | 259.74 | 10.56 |
| 36 | 289.7 | 242.36 | 47.34 |
| 37 | 322.7 | 231.617254901961 | 91.0827450980393 |
| 38 | 315 | 221.454509803922 | 93.5454901960784 |
| 39 | 320.2 | 225.154509803922 | 95.0454901960784 |
| 40 | 329.5 | 228.314509803922 | 101.185490196078 |
| 41 | 360.6 | 245.614509803922 | 114.985490196078 |
| 42 | 382.2 | 260.654509803922 | 121.545490196078 |
| 43 | 435.4 | 275.454509803922 | 159.945490196078 |
| 44 | 464 | 295.074509803922 | 168.925490196078 |
| 45 | 468.8 | 301.014509803922 | 167.785490196078 |
| 46 | 403 | 293.714509803922 | 109.285490196078 |
| 47 | 351.6 | 278.374509803922 | 73.2254901960785 |
| 48 | 252 | 260.994509803922 | -8.99450980392156 |
| 49 | 188 | 250.251764705882 | -62.2517647058823 |
| 50 | 146.5 | 240.089019607843 | -93.5890196078431 |
| 51 | 152.9 | 243.789019607843 | -90.8890196078431 |
| 52 | 148.1 | 246.949019607843 | -98.8490196078431 |
| 53 | 165.1 | 264.249019607843 | -99.1490196078432 |
| 54 | 177 | 279.289019607843 | -102.289019607843 |
| 55 | 206.1 | 294.089019607843 | -87.9890196078431 |
| 56 | 244.9 | 313.709019607843 | -68.8090196078431 |
| 57 | 228.6 | 319.649019607843 | -91.0490196078432 |
| 58 | 253.4 | 312.349019607843 | -58.9490196078431 |
| 59 | 241.1 | 297.009019607843 | -55.9090196078431 |
| 60 | 261.4 | 279.629019607843 | -18.2290196078431 |
| 61 | 273.7 | 268.886274509804 | 4.8137254901961 |
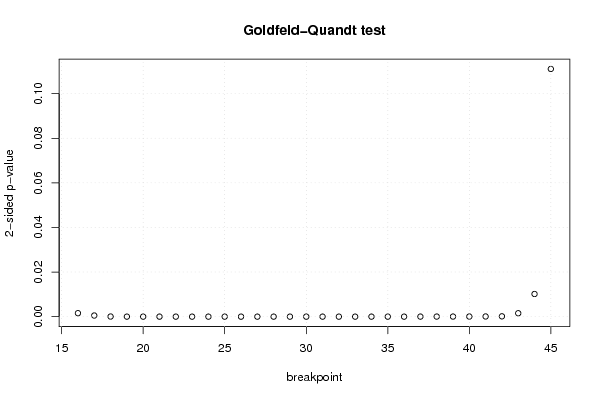
| Goldfeld-Quandt test for Heteroskedasticity | |||
| p-values | Alternative Hypothesis | ||
| breakpoint index | greater | 2-sided | less |
| 16 | 0.000780490164477813 | 0.00156098032895563 | 0.999219509835522 |
| 17 | 0.000253878093438721 | 0.000507756186877441 | 0.999746121906561 |
| 18 | 2.57817939181908e-05 | 5.15635878363817e-05 | 0.999974218206082 |
| 19 | 5.58425863657065e-06 | 1.11685172731413e-05 | 0.999994415741363 |
| 20 | 6.04536223789105e-07 | 1.20907244757821e-06 | 0.999999395463776 |
| 21 | 5.31201894679895e-08 | 1.06240378935979e-07 | 0.99999994687981 |
| 22 | 1.74153591642974e-08 | 3.48307183285949e-08 | 0.99999998258464 |
| 23 | 2.44390843256174e-07 | 4.88781686512347e-07 | 0.999999755609157 |
| 24 | 4.21641227882270e-07 | 8.43282455764541e-07 | 0.999999578358772 |
| 25 | 2.08063058986654e-07 | 4.16126117973307e-07 | 0.99999979193694 |
| 26 | 4.16984492090240e-08 | 8.33968984180481e-08 | 0.99999995830155 |
| 27 | 9.16844287700599e-08 | 1.83368857540120e-07 | 0.999999908315571 |
| 28 | 3.74978251650155e-08 | 7.4995650330031e-08 | 0.999999962502175 |
| 29 | 1.56858798425946e-08 | 3.13717596851892e-08 | 0.99999998431412 |
| 30 | 5.41732713649657e-09 | 1.08346542729931e-08 | 0.999999994582673 |
| 31 | 2.43318218959333e-09 | 4.86636437918667e-09 | 0.999999997566818 |
| 32 | 1.93194310205314e-09 | 3.86388620410628e-09 | 0.999999998068057 |
| 33 | 1.78823086892251e-09 | 3.57646173784501e-09 | 0.99999999821177 |
| 34 | 6.11095551587227e-09 | 1.22219110317445e-08 | 0.999999993889044 |
| 35 | 1.69095799049995e-08 | 3.3819159809999e-08 | 0.99999998309042 |
| 36 | 1.54501463424023e-07 | 3.09002926848046e-07 | 0.999999845498537 |
| 37 | 8.86376561206864e-06 | 1.77275312241373e-05 | 0.999991136234388 |
| 38 | 1.65209022905853e-05 | 3.30418045811705e-05 | 0.99998347909771 |
| 39 | 2.04520744430858e-05 | 4.09041488861716e-05 | 0.999979547925557 |
| 40 | 2.31888948031983e-05 | 4.63777896063967e-05 | 0.999976811105197 |
| 41 | 4.02750683604052e-05 | 8.05501367208104e-05 | 0.99995972493164 |
| 42 | 7.25887105038182e-05 | 0.000145177421007636 | 0.999927411289496 |
| 43 | 0.000766028462484934 | 0.00153205692496987 | 0.999233971537515 |
| 44 | 0.00508084379672542 | 0.0101616875934508 | 0.994919156203275 |
| 45 | 0.0555399266030238 | 0.111079853206048 | 0.944460073396976 |
| Meta Analysis of Goldfeld-Quandt test for Heteroskedasticity | |||
| Description | # significant tests | % significant tests | OK/NOK |
| 1% type I error level | 28 | 0.933333333333333 | NOK |
| 5% type I error level | 29 | 0.966666666666667 | NOK |
| 10% type I error level | 29 | 0.966666666666667 | NOK |