| Multiple Linear Regression - Estimated Regression Equation |
| Y[t] = + 1793.72489341894 + 1.6063977661368X[t] + 0.427962828713485`yt-3`[t] -252.499755260931M1[t] + 603.668966609273M2[t] -90.4715413427234M3[t] + 312.032103289648M4[t] -47.4313553108066M5[t] + 234.187147811827M6[t] + 590.986007695037M7[t] + 311.521538341208M8[t] + 430.915726239081M9[t] + 618.343590382069M10[t] -185.133169059902M11[t] -9.78223844663726t + e[t] |
| Multiple Linear Regression - Ordinary Least Squares | |||||
| Variable | Parameter | S.D. | T-STAT H0: parameter = 0 | 2-tail p-value | 1-tail p-value |
| (Intercept) | 1793.72489341894 | 2025.673184 | 0.8855 | 0.380815 | 0.190407 |
| X | 1.6063977661368 | 3.060266 | 0.5249 | 0.602334 | 0.301167 |
| `yt-3` | 0.427962828713485 | 0.129677 | 3.3002 | 0.001948 | 0.000974 |
| M1 | -252.499755260931 | 333.21998 | -0.7578 | 0.452729 | 0.226365 |
| M2 | 603.668966609273 | 345.116188 | 1.7492 | 0.087396 | 0.043698 |
| M3 | -90.4715413427234 | 351.353336 | -0.2575 | 0.798025 | 0.399013 |
| M4 | 312.032103289648 | 344.517975 | 0.9057 | 0.370138 | 0.185069 |
| M5 | -47.4313553108066 | 339.38632 | -0.1398 | 0.889505 | 0.444753 |
| M6 | 234.187147811827 | 348.352758 | 0.6723 | 0.505008 | 0.252504 |
| M7 | 590.986007695037 | 348.354776 | 1.6965 | 0.097019 | 0.048509 |
| M8 | 311.521538341208 | 353.327156 | 0.8817 | 0.382852 | 0.191426 |
| M9 | 430.915726239081 | 364.910192 | 1.1809 | 0.24414 | 0.12207 |
| M10 | 618.343590382069 | 360.807295 | 1.7138 | 0.093771 | 0.046885 |
| M11 | -185.133169059902 | 344.065913 | -0.5381 | 0.5933 | 0.29665 |
| t | -9.78223844663726 | 7.018747 | -1.3937 | 0.170561 | 0.08528 |
| Multiple Linear Regression - Regression Statistics | |
| Multiple R | 0.736405222894403 |
| R-squared | 0.542292652306156 |
| Adjusted R-squared | 0.393271655382578 |
| F-TEST (value) | 3.63903519303565 |
| F-TEST (DF numerator) | 14 |
| F-TEST (DF denominator) | 43 |
| p-value | 0.000545270742913884 |
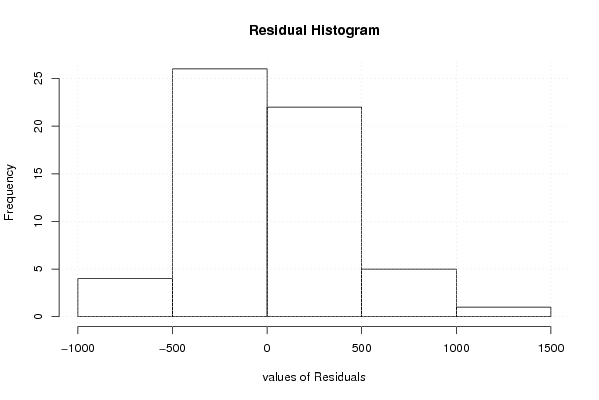
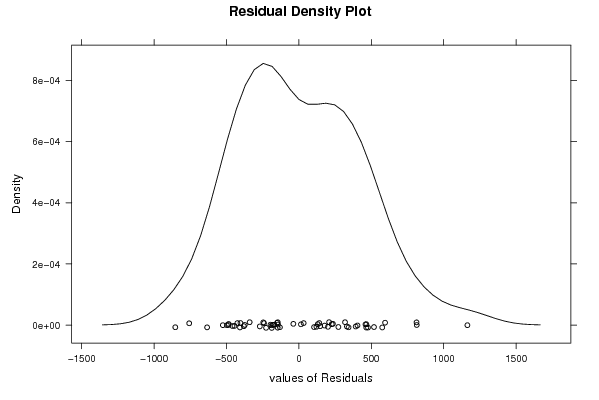
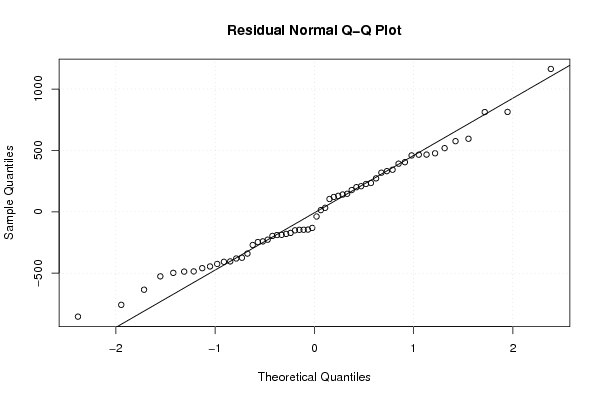
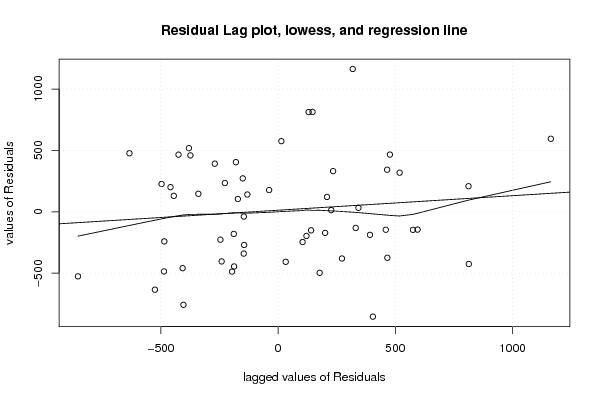
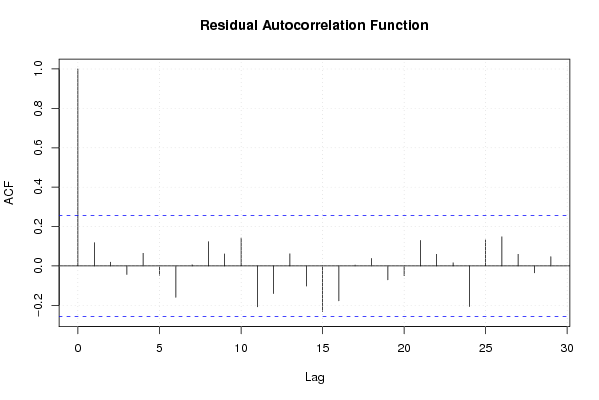
| Multiple Linear Regression - Residual Statistics | |
| Residual Standard Deviation | 483.846579610374 |
| Sum Squared Residuals | 10066623.0418283 |
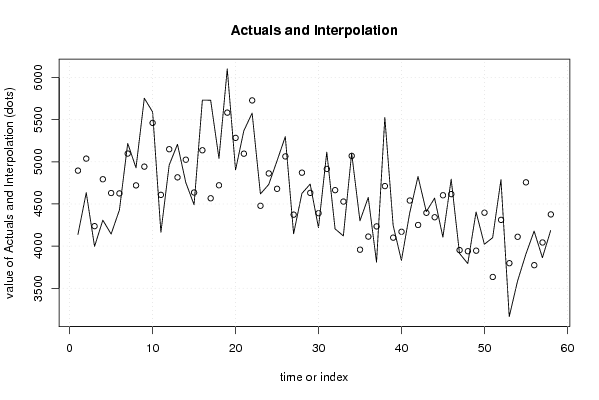
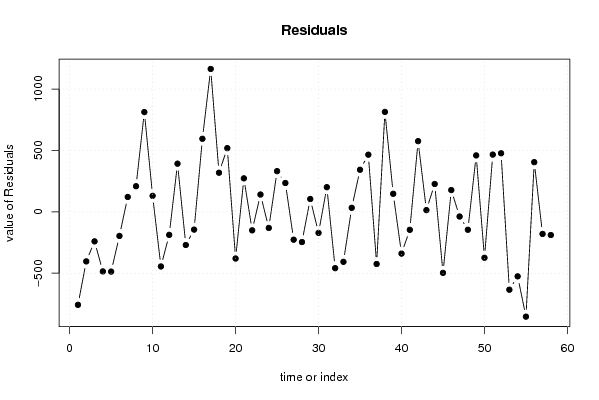
| Multiple Linear Regression - Actuals, Interpolation, and Residuals | |||
| Time or Index | Actuals | Interpolation Forecast | Residuals Prediction Error |
| 1 | 4138 | 4895.63805800023 | -757.638058000227 |
| 2 | 4634 | 5037.80863245882 | -403.808632458819 |
| 3 | 3996 | 4236.81918295556 | -240.819182955560 |
| 4 | 4308 | 4793.34489898984 | -485.344898989843 |
| 5 | 4143 | 4629.94317392009 | -486.943173920093 |
| 6 | 4429 | 4625.52635834461 | -196.526358344613 |
| 7 | 5219 | 5098.03539350911 | 120.964606490892 |
| 8 | 4929 | 4720.50444354341 | 208.495556456587 |
| 9 | 5755 | 4942.87537540988 | 812.124624590116 |
| 10 | 5592 | 5461.82443132216 | 130.175568677837 |
| 11 | 4163 | 4607.98889694576 | -444.988896945757 |
| 12 | 4962 | 5149.68830620546 | -187.688306205456 |
| 13 | 5208 | 4816.04197365145 | 391.958026348548 |
| 14 | 4755 | 5025.16721058526 | -270.167210585259 |
| 15 | 4491 | 4635.87800230437 | -144.878002304375 |
| 16 | 5732 | 5137.0910598859 | 594.9089401141 |
| 17 | 5731 | 4567.55261036705 | 1163.44738963295 |
| 18 | 5040 | 4721.58749496428 | 318.412505035723 |
| 19 | 6102 | 5583.64200917292 | 518.357990827083 |
| 20 | 4904 | 5284.32895194692 | -380.328951946917 |
| 21 | 5369 | 5096.612188991 | 272.387811009003 |
| 22 | 5578 | 5728.75433878107 | -150.754338781071 |
| 23 | 4619 | 4478.29656710214 | 140.703432897865 |
| 24 | 4731 | 4862.28859966399 | -131.288599663992 |
| 25 | 5011 | 4679.81245056072 | 331.187549439278 |
| 26 | 5299 | 5064.37785273168 | 234.622147268322 |
| 27 | 4146 | 4373.04619229394 | -227.046192293945 |
| 28 | 4625 | 4871.13961062422 | -246.139610624224 |
| 29 | 4736 | 4631.57279931116 | 104.427200688837 |
| 30 | 4219 | 4390.69114928687 | -171.691149286869 |
| 31 | 5116 | 4915.39320365288 | 200.606796347124 |
| 32 | 4205 | 4664.01198324279 | -459.011983242786 |
| 33 | 4121 | 4528.27118375710 | -407.271183757097 |
| 34 | 5103 | 5070.5226936158 | 32.4773063841965 |
| 35 | 4300 | 3957.34783367287 | 342.65216632713 |
| 36 | 4578 | 4112.81386433557 | 465.18613566443 |
| 37 | 3809 | 4233.8442198035 | -424.844219803498 |
| 38 | 5526 | 4712.48058527808 | 813.519414721915 |
| 39 | 4247 | 4100.22274323747 | 146.777256762526 |
| 40 | 3830 | 4170.26632520708 | -340.266325207084 |
| 41 | 4394 | 4540.65199835946 | -146.651998359458 |
| 42 | 4826 | 4250.66622521567 | 575.333774784325 |
| 43 | 4409 | 4395.12638058667 | 13.8736194133276 |
| 44 | 4569 | 4342.4315148822 | 226.568485117798 |
| 45 | 4106 | 4603.18905324879 | -497.18905324879 |
| 46 | 4794 | 4616.83175926685 | 177.168240733150 |
| 47 | 3914 | 3952.36670227924 | -38.3667022792384 |
| 48 | 3793 | 3939.20922979498 | -146.209229794980 |
| 49 | 4405 | 3945.6632979841 | 459.336702015899 |
| 50 | 4022 | 4396.16571894616 | -374.165718946159 |
| 51 | 4100 | 3634.03387920865 | 465.966120791354 |
| 52 | 4788 | 4311.15810529295 | 476.841894707051 |
| 53 | 3163 | 3797.27941804223 | -634.279418042234 |
| 54 | 3585 | 4110.52877218857 | -525.528772188566 |
| 55 | 3903 | 4756.80301307843 | -853.803013078426 |
| 56 | 4178 | 3773.72310638468 | 404.276893615317 |
| 57 | 3863 | 4043.05219859323 | -180.052198593231 |
| 58 | 4187 | 4376.06677701411 | -189.066777014113 |
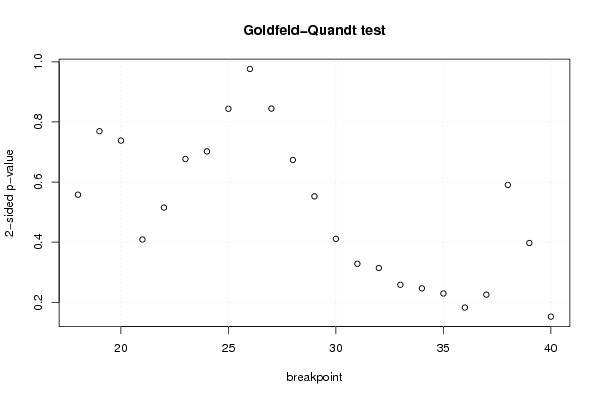
| Goldfeld-Quandt test for Heteroskedasticity | |||
| p-values | Alternative Hypothesis | ||
| breakpoint index | greater | 2-sided | less |
| 18 | 0.721111975477936 | 0.557776049044128 | 0.278888024522064 |
| 19 | 0.615504931917505 | 0.768990136164989 | 0.384495068082495 |
| 20 | 0.631114043046127 | 0.737771913907746 | 0.368885956953873 |
| 21 | 0.795610775691923 | 0.408778448616153 | 0.204389224308077 |
| 22 | 0.742527484981339 | 0.514945030037322 | 0.257472515018661 |
| 23 | 0.661697189862316 | 0.676605620275369 | 0.338302810137684 |
| 24 | 0.649070963740619 | 0.701858072518763 | 0.350929036259381 |
| 25 | 0.578228274944256 | 0.843543450111488 | 0.421771725055744 |
| 26 | 0.488047947862906 | 0.976095895725813 | 0.511952052137094 |
| 27 | 0.422152938647464 | 0.844305877294928 | 0.577847061352536 |
| 28 | 0.336661977425142 | 0.673323954850283 | 0.663338022574858 |
| 29 | 0.276117373877017 | 0.552234747754034 | 0.723882626122983 |
| 30 | 0.205500630061331 | 0.411001260122662 | 0.794499369938669 |
| 31 | 0.164039340110848 | 0.328078680221697 | 0.835960659889152 |
| 32 | 0.156960219616469 | 0.313920439232937 | 0.843039780383531 |
| 33 | 0.129068192107019 | 0.258136384214037 | 0.870931807892981 |
| 34 | 0.123167738160073 | 0.246335476320146 | 0.876832261839927 |
| 35 | 0.114625433918326 | 0.229250867836653 | 0.885374566081674 |
| 36 | 0.0912000691086244 | 0.182400138217249 | 0.908799930891376 |
| 37 | 0.112630687092782 | 0.225261374185564 | 0.887369312907218 |
| 38 | 0.295129842365564 | 0.590259684731128 | 0.704870157634436 |
| 39 | 0.198629537795486 | 0.397259075590972 | 0.801370462204514 |
| 40 | 0.923932016699468 | 0.152135966601064 | 0.0760679833005322 |
| Meta Analysis of Goldfeld-Quandt test for Heteroskedasticity | |||
| Description | # significant tests | % significant tests | OK/NOK |
| 1% type I error level | 0 | 0 | OK |
| 5% type I error level | 0 | 0 | OK |
| 10% type I error level | 0 | 0 | OK |