| Multiple Linear Regression - Estimated Regression Equation |
| Productie[t] = + 70.843171659092 -12.1409361201919Dummy[t] -0.170535875011005`Yt-1`[t] + 0.127341252226174`Yt-2`[t] + 0.406670131624456`Yt-3`[t] -0.115932126741984`Yt-4`[t] -0.0322030815182641`Yt-5`[t] + 0.125704389082812`Yt-6`[t] -19.0624672402896M1[t] -15.1805417856902M2[t] -0.526451480378921M3[t] + 14.7571552687538M4[t] -1.15645418805891M5[t] -16.4847096765184M6[t] -11.7529419581613M7[t] -7.21825953770693M8[t] + 2.70776198327648M9[t] -3.68093564071264M10[t] -7.4642631479732M11[t] + 0.128245177155806t + e[t] |
| Multiple Linear Regression - Ordinary Least Squares | |||||
| Variable | Parameter | S.D. | T-STAT H0: parameter = 0 | 2-tail p-value | 1-tail p-value |
| (Intercept) | 70.843171659092 | 15.456906 | 4.5833 | 2.7e-05 | 1.3e-05 |
| Dummy | -12.1409361201919 | 2.59814 | -4.6729 | 2e-05 | 1e-05 |
| `Yt-1` | -0.170535875011005 | 0.127664 | -1.3358 | 0.18711 | 0.093555 |
| `Yt-2` | 0.127341252226174 | 0.127842 | 0.9961 | 0.323573 | 0.161786 |
| `Yt-3` | 0.406670131624456 | 0.131509 | 3.0923 | 0.003117 | 0.001558 |
| `Yt-4` | -0.115932126741984 | 0.121414 | -0.9548 | 0.343833 | 0.171916 |
| `Yt-5` | -0.0322030815182641 | 0.120282 | -0.2677 | 0.789909 | 0.394955 |
| `Yt-6` | 0.125704389082812 | 0.128168 | 0.9808 | 0.330995 | 0.165498 |
| M1 | -19.0624672402896 | 2.382462 | -8.0012 | 0 | 0 |
| M2 | -15.1805417856902 | 3.051581 | -4.9746 | 7e-06 | 3e-06 |
| M3 | -0.526451480378921 | 3.479885 | -0.1513 | 0.880305 | 0.440153 |
| M4 | 14.7571552687538 | 4.455422 | 3.3122 | 0.00164 | 0.00082 |
| M5 | -1.15645418805891 | 4.751963 | -0.2434 | 0.808629 | 0.404315 |
| M6 | -16.4847096765184 | 3.512189 | -4.6936 | 1.8e-05 | 9e-06 |
| M7 | -11.7529419581613 | 3.371446 | -3.486 | 0.000971 | 0.000486 |
| M8 | -7.21825953770693 | 3.443448 | -2.0962 | 0.040676 | 0.020338 |
| M9 | 2.70776198327648 | 4.281735 | 0.6324 | 0.529747 | 0.264873 |
| M10 | -3.68093564071264 | 4.096295 | -0.8986 | 0.372782 | 0.186391 |
| M11 | -7.4642631479732 | 2.88189 | -2.5901 | 0.012259 | 0.006129 |
| t | 0.128245177155806 | 0.038619 | 3.3208 | 0.001599 | 0.000799 |
| Multiple Linear Regression - Regression Statistics | |
| Multiple R | 0.956037433079494 |
| R-squared | 0.914007573449228 |
| Adjusted R-squared | 0.884301098822598 |
| F-TEST (value) | 30.7679583301975 |
| F-TEST (DF numerator) | 19 |
| F-TEST (DF denominator) | 55 |
| p-value | 0 |
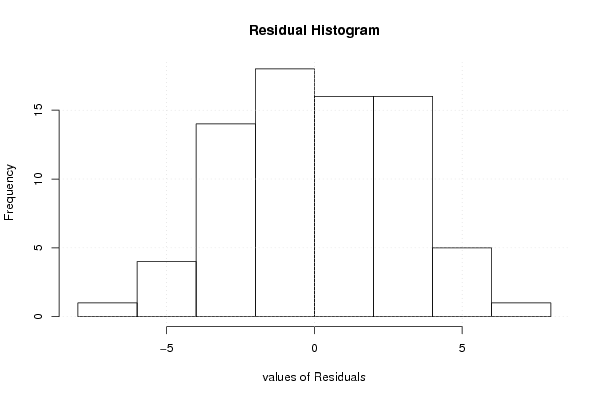
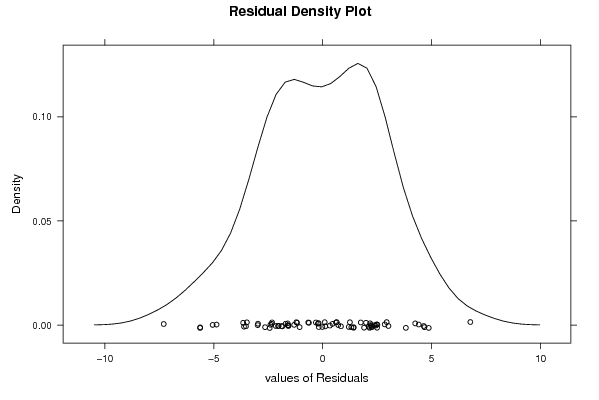
| Multiple Linear Regression - Residual Statistics | |
| Residual Standard Deviation | 3.24878213411558 |
| Sum Squared Residuals | 580.502194522171 |
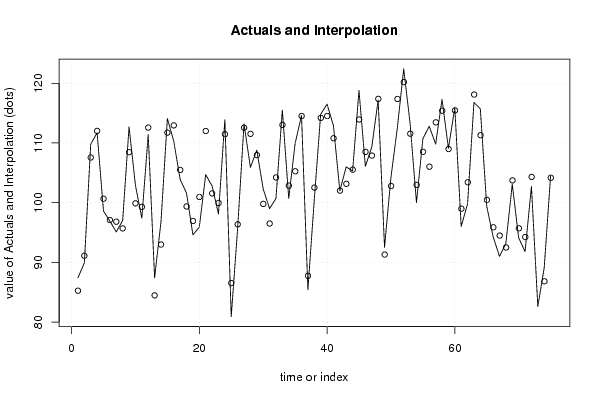
| Multiple Linear Regression - Actuals, Interpolation, and Residuals | |||
| Time or Index | Actuals | Interpolation Forecast | Residuals Prediction Error |
| 1 | 87.4 | 85.2458124493166 | 2.15418755068342 |
| 2 | 89.9 | 91.1086770543519 | -1.20867705435185 |
| 3 | 109.8 | 107.565979250028 | 2.23402074997159 |
| 4 | 111.7 | 112.015227856697 | -0.315227856696888 |
| 5 | 98.6 | 100.654711118671 | -2.05471111867122 |
| 6 | 96.9 | 97.0887552358055 | -0.188755235805451 |
| 7 | 95.1 | 96.8060798854834 | -1.70607988548339 |
| 8 | 97 | 95.6852618147323 | 1.31473818526770 |
| 9 | 112.7 | 108.453999220765 | 4.24600077923484 |
| 10 | 102.9 | 99.8838590011728 | 3.01614099882724 |
| 11 | 97.4 | 99.288654725945 | -1.88865472594506 |
| 12 | 111.4 | 112.579884202804 | -1.17988420280436 |
| 13 | 87.4 | 84.46482756727 | 2.93517243273008 |
| 14 | 96.8 | 92.9833358080133 | 3.81666419198670 |
| 15 | 114.1 | 111.726601659251 | 2.37339834074884 |
| 16 | 110.3 | 112.947271720740 | -2.64727172073952 |
| 17 | 103.9 | 105.475800427504 | -1.57580042750357 |
| 18 | 101.6 | 99.361689647137 | 2.23831035286297 |
| 19 | 94.6 | 96.9283644438593 | -2.32836444385928 |
| 20 | 95.9 | 100.954519472762 | -5.05451947276176 |
| 21 | 104.7 | 111.999382717118 | -7.29938271711795 |
| 22 | 102.8 | 101.552134211419 | 1.24786578858060 |
| 23 | 98.1 | 99.9514281190936 | -1.85142811909361 |
| 24 | 113.9 | 111.467793546813 | 2.43220645318740 |
| 25 | 80.9 | 86.5259300780725 | -5.62593007807252 |
| 26 | 95.7 | 96.3647263809863 | -0.664726380986282 |
| 27 | 113.2 | 112.558523143994 | 0.641476856006124 |
| 28 | 105.9 | 111.531321988285 | -5.6313219882853 |
| 29 | 108.8 | 107.964200324016 | 0.835799675983572 |
| 30 | 102.3 | 99.7898076991875 | 2.51019230081246 |
| 31 | 99 | 96.5052387886815 | 2.49476121131850 |
| 32 | 100.7 | 104.225735573141 | -3.52573557314125 |
| 33 | 115.5 | 113.025215432337 | 2.47478456766280 |
| 34 | 100.7 | 102.857828576880 | -2.15782857688021 |
| 35 | 109.9 | 105.259105730105 | 4.64089426989528 |
| 36 | 114.6 | 114.508858444738 | 0.0911415552623357 |
| 37 | 85.4 | 87.7405741431553 | -2.34057414315528 |
| 38 | 100.5 | 102.523148752392 | -2.02314875239176 |
| 39 | 114.8 | 114.193832574693 | 0.60616742530706 |
| 40 | 116.5 | 114.513532249424 | 1.98646775057574 |
| 41 | 112.9 | 110.790299873904 | 2.10970012609582 |
| 42 | 102 | 102.016647218873 | -0.0166472188729180 |
| 43 | 106 | 103.153747763199 | 2.84625223680116 |
| 44 | 105.3 | 105.523047331630 | -0.223047331629558 |
| 45 | 118.8 | 113.933532898049 | 4.86646710195109 |
| 46 | 106.1 | 108.501676524901 | -2.40167652490070 |
| 47 | 109.3 | 107.881586901235 | 1.41841309876503 |
| 48 | 117.2 | 117.383355621630 | -0.183355621630165 |
| 49 | 92.5 | 91.3049574837798 | 1.19504251622018 |
| 50 | 104.2 | 102.784307878861 | 1.41569212113938 |
| 51 | 112.5 | 117.373744315871 | -4.87374431587117 |
| 52 | 122.4 | 120.199929476019 | 2.20007052398130 |
| 53 | 113.3 | 111.552606198834 | 1.74739380116604 |
| 54 | 100 | 102.972587744027 | -2.97258774402668 |
| 55 | 110.7 | 108.524045568942 | 2.17595443105776 |
| 56 | 112.8 | 106.023630172466 | 6.77636982753436 |
| 57 | 109.8 | 113.453128457005 | -3.65312845700514 |
| 58 | 117.3 | 115.402489452666 | 1.89751054733407 |
| 59 | 109.1 | 108.984288867112 | 0.115711132888437 |
| 60 | 115.9 | 115.450341550949 | 0.449658449051261 |
| 61 | 96 | 98.9875101288926 | -2.98751012889258 |
| 62 | 99.8 | 103.413667620248 | -3.61366762024811 |
| 63 | 116.8 | 118.111239914068 | -1.31123991406762 |
| 64 | 115.7 | 111.292716708835 | 4.40728329116467 |
| 65 | 99.4 | 100.462382057071 | -1.06238205707065 |
| 66 | 94.3 | 95.8705124549704 | -1.57051245497038 |
| 67 | 91 | 94.4825235498348 | -3.48252354983475 |
| 68 | 93.2 | 92.4878056352695 | 0.712194364730514 |
| 69 | 103.1 | 103.734741274726 | -0.634741274725637 |
| 70 | 94.1 | 95.702012232961 | -1.60201223296099 |
| 71 | 91.8 | 94.23493565651 | -2.43493565651008 |
| 72 | 102.7 | 104.309766633066 | -1.60976663306648 |
| 73 | 82.6 | 77.9303881495133 | 4.66961185048669 |
| 74 | 89.1 | 86.8221365051481 | 2.27786349485193 |
| 75 | 104.5 | 104.170079142095 | 0.329920857905177 |
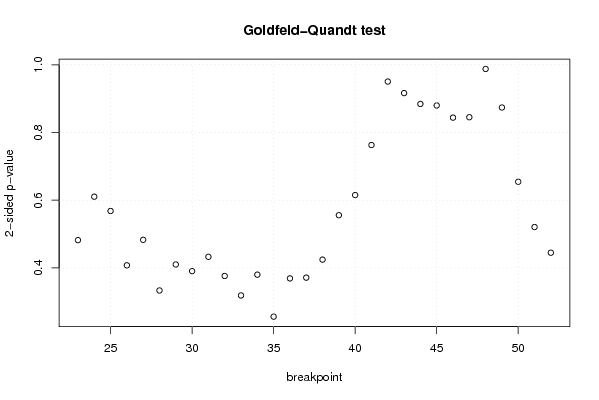
| Goldfeld-Quandt test for Heteroskedasticity | |||
| p-values | Alternative Hypothesis | ||
| breakpoint index | greater | 2-sided | less |
| 23 | 0.758949783020708 | 0.482100433958584 | 0.241050216979292 |
| 24 | 0.694807790770859 | 0.610384418458281 | 0.305192209229141 |
| 25 | 0.715913417574933 | 0.568173164850134 | 0.284086582425067 |
| 26 | 0.796156071973752 | 0.407687856052496 | 0.203843928026248 |
| 27 | 0.758485152113029 | 0.483029695773942 | 0.241514847886971 |
| 28 | 0.833294573628002 | 0.333410852743997 | 0.166705426371998 |
| 29 | 0.794873108169919 | 0.410253783660162 | 0.205126891830081 |
| 30 | 0.804728424177996 | 0.390543151644009 | 0.195271575822004 |
| 31 | 0.783591832843186 | 0.432816334313628 | 0.216408167156814 |
| 32 | 0.811852217865904 | 0.376295564268193 | 0.188147782134096 |
| 33 | 0.840649130742443 | 0.318701738515115 | 0.159350869257557 |
| 34 | 0.809950258232644 | 0.380099483534711 | 0.190049741767356 |
| 35 | 0.871952830444972 | 0.256094339110056 | 0.128047169555028 |
| 36 | 0.81545271093365 | 0.369094578132699 | 0.184547289066350 |
| 37 | 0.8143689313626 | 0.371262137274801 | 0.185631068637401 |
| 38 | 0.787750497960839 | 0.424499004078323 | 0.212249502039161 |
| 39 | 0.722180352784343 | 0.555639294431314 | 0.277819647215657 |
| 40 | 0.692418712105648 | 0.615162575788704 | 0.307581287894352 |
| 41 | 0.618566699244185 | 0.76286660151163 | 0.381433300755815 |
| 42 | 0.524826286006806 | 0.950347427986389 | 0.475173713993194 |
| 43 | 0.458174090762654 | 0.916348181525308 | 0.541825909237346 |
| 44 | 0.557865700180263 | 0.884268599639475 | 0.442134299819737 |
| 45 | 0.560157547468241 | 0.879684905063518 | 0.439842452531759 |
| 46 | 0.57808103669867 | 0.84383792660266 | 0.42191896330133 |
| 47 | 0.577470666416466 | 0.845058667167069 | 0.422529333583534 |
| 48 | 0.493802345092007 | 0.987604690184014 | 0.506197654907993 |
| 49 | 0.43688314972895 | 0.8737662994579 | 0.56311685027105 |
| 50 | 0.327195985053999 | 0.654391970107998 | 0.672804014946001 |
| 51 | 0.260382091085208 | 0.520764182170415 | 0.739617908914792 |
| 52 | 0.222440506984859 | 0.444881013969718 | 0.777559493015141 |
| Meta Analysis of Goldfeld-Quandt test for Heteroskedasticity | |||
| Description | # significant tests | % significant tests | OK/NOK |
| 1% type I error level | 0 | 0 | OK |
| 5% type I error level | 0 | 0 | OK |
| 10% type I error level | 0 | 0 | OK |