| Multiple Linear Regression - Estimated Regression Equation |
| Y[t] = + 3.04790639755097 + 2.37529185907747X[t] + e[t] |
| Multiple Linear Regression - Ordinary Least Squares | |||||
| Variable | Parameter | S.D. | T-STAT H0: parameter = 0 | 2-tail p-value | 1-tail p-value |
| (Intercept) | 3.04790639755097 | 2.858161 | 1.0664 | 0.290668 | 0.145334 |
| X | 2.37529185907747 | 0.396795 | 5.9862 | 0 | 0 |
| Multiple Linear Regression - Regression Statistics | |
| Multiple R | 0.617973267289145 |
| R-squared | 0.381890959084021 |
| Adjusted R-squared | 0.371233906654436 |
| F-TEST (value) | 35.8345763622055 |
| F-TEST (DF numerator) | 1 |
| F-TEST (DF denominator) | 58 |
| p-value | 1.43626900372951e-07 |
| Multiple Linear Regression - Residual Statistics | |
| Residual Standard Deviation | 2.01145292020237 |
| Sum Squared Residuals | 234.664685311058 |
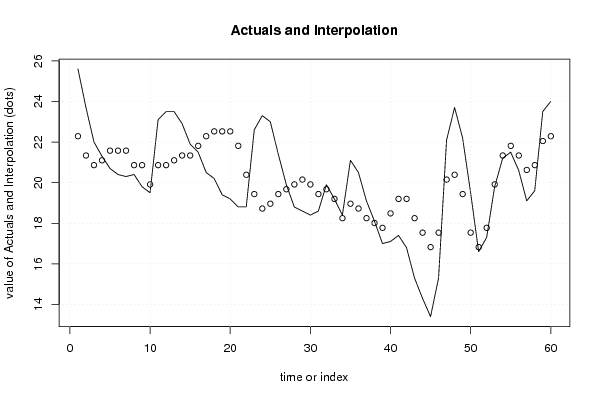
| Multiple Linear Regression - Actuals, Interpolation, and Residuals | |||
| Time or Index | Actuals | Interpolation Forecast | Residuals Prediction Error |
| 1 | 25.6 | 22.2877704560783 | 3.31222954392165 |
| 2 | 23.7 | 21.3376537124475 | 2.36234628755254 |
| 3 | 22 | 20.8625953406320 | 1.13740465936803 |
| 4 | 21.3 | 21.1001245265397 | 0.19987547346028 |
| 5 | 20.7 | 21.5751828983552 | -0.875182898355215 |
| 6 | 20.4 | 21.5751828983552 | -1.17518289835522 |
| 7 | 20.3 | 21.5751828983552 | -1.27518289835521 |
| 8 | 20.4 | 20.8625953406320 | -0.462595340631976 |
| 9 | 19.8 | 20.8625953406320 | -1.06259534063197 |
| 10 | 19.5 | 19.912478597001 | -0.412478597000987 |
| 11 | 23.1 | 20.8625953406320 | 2.23740465936803 |
| 12 | 23.5 | 20.8625953406320 | 2.63740465936803 |
| 13 | 23.5 | 21.1001245265397 | 2.39987547346028 |
| 14 | 22.9 | 21.3376537124475 | 1.56234628755253 |
| 15 | 21.9 | 21.3376537124475 | 0.56234628755253 |
| 16 | 21.5 | 21.8127120842630 | -0.312712084262963 |
| 17 | 20.5 | 22.2877704560785 | -1.78777045607845 |
| 18 | 20.2 | 22.5252996419862 | -2.3252996419862 |
| 19 | 19.4 | 22.5252996419862 | -3.1252996419862 |
| 20 | 19.2 | 22.5252996419862 | -3.3252996419862 |
| 21 | 18.8 | 21.8127120842630 | -3.01271208426296 |
| 22 | 18.8 | 20.3875369688165 | -1.58753696881648 |
| 23 | 22.6 | 19.4374202251855 | 3.16257977481451 |
| 24 | 23.3 | 18.7248326674623 | 4.57516733253775 |
| 25 | 23 | 18.96236185337 | 4.03763814663 |
| 26 | 21.4 | 19.4374202251855 | 1.96257977481450 |
| 27 | 19.9 | 19.6749494110932 | 0.225050588906757 |
| 28 | 18.8 | 19.912478597001 | -1.11247859700099 |
| 29 | 18.6 | 20.1500077829087 | -1.55000778290873 |
| 30 | 18.4 | 19.912478597001 | -1.51247859700099 |
| 31 | 18.6 | 19.4374202251855 | -0.837420225185494 |
| 32 | 19.9 | 19.6749494110932 | 0.225050588906757 |
| 33 | 19.2 | 19.1998910392777 | 0.000108960722252083 |
| 34 | 18.4 | 18.2497742956468 | 0.150225704353237 |
| 35 | 21.1 | 18.96236185337 | 2.13763814663 |
| 36 | 20.5 | 18.7248326674623 | 1.77516733253775 |
| 37 | 19.1 | 18.2497742956468 | 0.85022570435324 |
| 38 | 18.1 | 18.012245109739 | 0.087754890260988 |
| 39 | 17 | 17.7747159238313 | -0.774715923831268 |
| 40 | 17.1 | 18.4873034815545 | -1.38730348155451 |
| 41 | 17.4 | 19.1998910392777 | -1.79989103927775 |
| 42 | 16.8 | 19.1998910392777 | -2.39989103927775 |
| 43 | 15.3 | 18.2497742956468 | -2.94977429564676 |
| 44 | 14.3 | 17.5371867379235 | -3.23718673792352 |
| 45 | 13.4 | 16.8245991802003 | -3.42459918020028 |
| 46 | 15.3 | 17.5371867379235 | -2.23718673792352 |
| 47 | 22.1 | 20.1500077829087 | 1.94999221709127 |
| 48 | 23.7 | 20.3875369688165 | 3.31246303118352 |
| 49 | 22.2 | 19.4374202251855 | 2.76257977481450 |
| 50 | 19.5 | 17.5371867379235 | 1.96281326207648 |
| 51 | 16.6 | 16.8245991802003 | -0.224599180200279 |
| 52 | 17.3 | 17.7747159238313 | -0.474715923831267 |
| 53 | 19.8 | 19.912478597001 | -0.112478597000986 |
| 54 | 21.2 | 21.3376537124475 | -0.137653712447470 |
| 55 | 21.5 | 21.8127120842630 | -0.312712084262963 |
| 56 | 20.6 | 21.3376537124475 | -0.737653712447468 |
| 57 | 19.1 | 20.6250661547242 | -1.52506615472423 |
| 58 | 19.6 | 20.8625953406320 | -1.26259534063197 |
| 59 | 23.5 | 22.0502412701707 | 1.44975872982929 |
| 60 | 24 | 22.2877704560785 | 1.71222954392155 |
| Goldfeld-Quandt test for Heteroskedasticity | |||
| p-values | Alternative Hypothesis | ||
| breakpoint index | greater | 2-sided | less |
| 5 | 0.444140583716565 | 0.88828116743313 | 0.555859416283435 |
| 6 | 0.505445092314943 | 0.989109815370114 | 0.494554907685057 |
| 7 | 0.501280925839052 | 0.997438148321897 | 0.498719074160948 |
| 8 | 0.369275884468075 | 0.738551768936151 | 0.630724115531925 |
| 9 | 0.271799823259579 | 0.543599646519158 | 0.728200176740421 |
| 10 | 0.197300137184628 | 0.394600274369256 | 0.802699862815372 |
| 11 | 0.233596025401782 | 0.467192050803564 | 0.766403974598218 |
| 12 | 0.286175704181974 | 0.572351408363948 | 0.713824295818026 |
| 13 | 0.287762307830112 | 0.575524615660225 | 0.712237692169888 |
| 14 | 0.230410167178467 | 0.460820334356933 | 0.769589832821533 |
| 15 | 0.167563370573107 | 0.335126741146213 | 0.832436629426893 |
| 16 | 0.135335605341768 | 0.270671210683536 | 0.864664394658232 |
| 17 | 0.161191653101876 | 0.322383306203752 | 0.838808346898124 |
| 18 | 0.177616429391225 | 0.35523285878245 | 0.822383570608775 |
| 19 | 0.221755061736983 | 0.443510123473966 | 0.778244938263017 |
| 20 | 0.271542622433319 | 0.543085244866637 | 0.728457377566681 |
| 21 | 0.353903042020665 | 0.70780608404133 | 0.646096957979335 |
| 22 | 0.404639192334911 | 0.809278384669823 | 0.595360807665089 |
| 23 | 0.405679602110445 | 0.81135920422089 | 0.594320397889555 |
| 24 | 0.532781993694914 | 0.934436012610172 | 0.467218006305086 |
| 25 | 0.645453665718217 | 0.709092668563565 | 0.354546334281783 |
| 26 | 0.631733939919919 | 0.736532120160161 | 0.368266060080081 |
| 27 | 0.61298262216841 | 0.774034755663179 | 0.387017377831589 |
| 28 | 0.648774329515914 | 0.702451340968171 | 0.351225670484086 |
| 29 | 0.690232384384012 | 0.619535231231977 | 0.309767615615988 |
| 30 | 0.725183141771282 | 0.549633716457437 | 0.274816858228718 |
| 31 | 0.717610788033118 | 0.564778423933763 | 0.282389211966882 |
| 32 | 0.659293651552935 | 0.68141269689413 | 0.340706348447065 |
| 33 | 0.609397367471996 | 0.781205265056009 | 0.390602632528004 |
| 34 | 0.575881482041339 | 0.848237035917322 | 0.424118517958661 |
| 35 | 0.584881875200679 | 0.830236249598642 | 0.415118124799321 |
| 36 | 0.584615972824476 | 0.830768054351047 | 0.415384027175524 |
| 37 | 0.561695837313698 | 0.876608325372604 | 0.438304162686302 |
| 38 | 0.532447506669088 | 0.935104986661825 | 0.467552493330912 |
| 39 | 0.509192008844566 | 0.981615982310868 | 0.490807991155434 |
| 40 | 0.480235032188201 | 0.960470064376402 | 0.519764967811799 |
| 41 | 0.466408929634958 | 0.932817859269916 | 0.533591070365042 |
| 42 | 0.501495573720318 | 0.997008852559364 | 0.498504426279682 |
| 43 | 0.578464951012131 | 0.843070097975738 | 0.421535048987869 |
| 44 | 0.672951747963994 | 0.654096504072011 | 0.327048252036006 |
| 45 | 0.795793145143717 | 0.408413709712567 | 0.204206854856283 |
| 46 | 0.846766313090841 | 0.306467373818318 | 0.153233686909159 |
| 47 | 0.82507729379695 | 0.349845412406099 | 0.174922706203049 |
| 48 | 0.917389251035764 | 0.165221497928472 | 0.082610748964236 |
| 49 | 0.96254977148984 | 0.0749004570203201 | 0.0374502285101600 |
| 50 | 0.983683890980784 | 0.0326322180384316 | 0.0163161090192158 |
| 51 | 0.972964067047318 | 0.0540718659053639 | 0.0270359329526820 |
| 52 | 0.976544870457003 | 0.046910259085994 | 0.023455129542997 |
| 53 | 0.997871246407635 | 0.00425750718472997 | 0.00212875359236498 |
| 54 | 0.991403680207685 | 0.0171926395846294 | 0.0085963197923147 |
| 55 | 0.994383435775055 | 0.0112331284498899 | 0.00561656422494494 |
| Meta Analysis of Goldfeld-Quandt test for Heteroskedasticity | |||
| Description | # significant tests | % significant tests | OK/NOK |
| 1% type I error level | 1 | 0.0196078431372549 | NOK |
| 5% type I error level | 5 | 0.0980392156862745 | NOK |
| 10% type I error level | 7 | 0.137254901960784 | NOK |