| Multiple Linear Regression - Estimated Regression Equation |
| wagens[t] = + 20987.3 + 2134.08000000000dummies[t] + e[t] |
| Multiple Linear Regression - Ordinary Least Squares | |||||
| Variable | Parameter | S.D. | T-STAT H0: parameter = 0 | 2-tail p-value | 1-tail p-value |
| (Intercept) | 20987.3 | 1818.203457 | 11.5429 | 0 | 0 |
| dummies | 2134.08000000000 | 1991.742095 | 1.0715 | 0.288399 | 0.1442 |
| Multiple Linear Regression - Regression Statistics | |
| Multiple R | 0.139318064540605 |
| R-squared | 0.0194095231073401 |
| Adjusted R-squared | 0.00250279074712190 |
| F-TEST (value) | 1.14803515509661 |
| F-TEST (DF numerator) | 1 |
| F-TEST (DF denominator) | 58 |
| p-value | 0.288399170188137 |
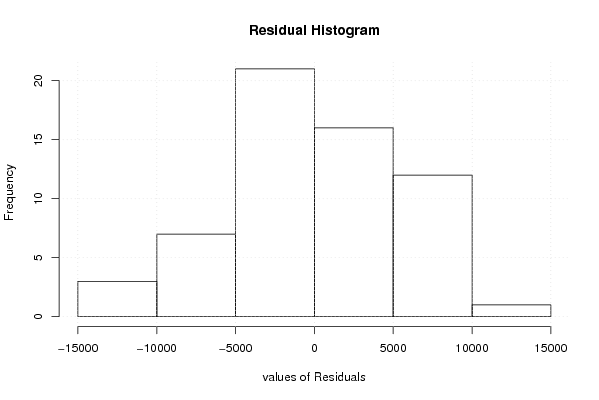
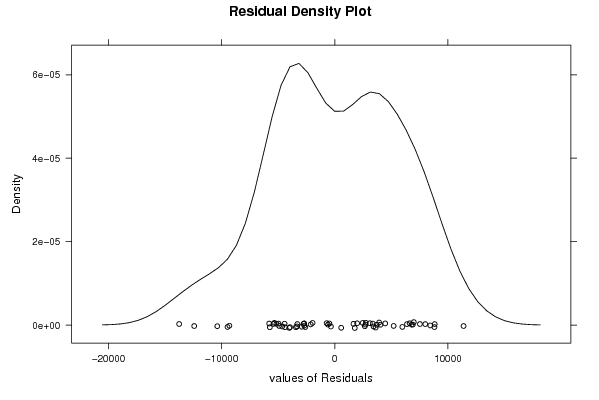
| Multiple Linear Regression - Residual Statistics | |
| Residual Standard Deviation | 5749.6641729217 |
| Sum Squared Residuals | 1917401009.88 |
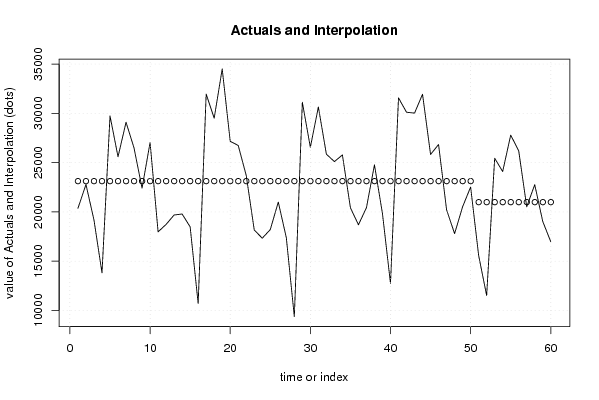
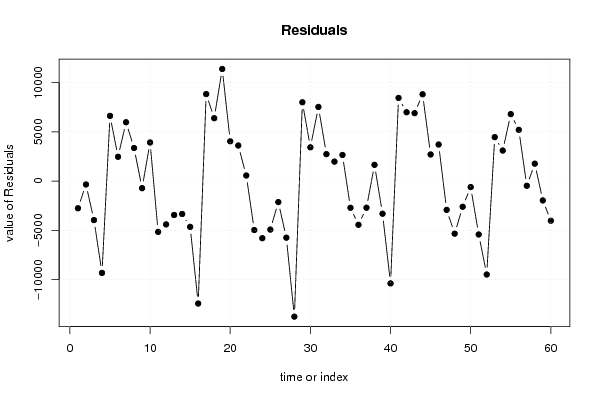
| Multiple Linear Regression - Actuals, Interpolation, and Residuals | |||
| Time or Index | Actuals | Interpolation Forecast | Residuals Prediction Error |
| 1 | 20366 | 23121.3800000001 | -2755.38000000006 |
| 2 | 22782 | 23121.38 | -339.379999999998 |
| 3 | 19169 | 23121.38 | -3952.38 |
| 4 | 13807 | 23121.38 | -9314.38 |
| 5 | 29743 | 23121.38 | 6621.62 |
| 6 | 25591 | 23121.38 | 2469.62 |
| 7 | 29096 | 23121.38 | 5974.62 |
| 8 | 26482 | 23121.38 | 3360.62 |
| 9 | 22405 | 23121.38 | -716.379999999999 |
| 10 | 27044 | 23121.38 | 3922.62 |
| 11 | 17970 | 23121.38 | -5151.38 |
| 12 | 18730 | 23121.38 | -4391.38 |
| 13 | 19684 | 23121.38 | -3437.38 |
| 14 | 19785 | 23121.38 | -3336.38 |
| 15 | 18479 | 23121.38 | -4642.38 |
| 16 | 10698 | 23121.38 | -12423.38 |
| 17 | 31956 | 23121.38 | 8834.62 |
| 18 | 29506 | 23121.38 | 6384.62 |
| 19 | 34506 | 23121.38 | 11384.62 |
| 20 | 27165 | 23121.38 | 4043.62 |
| 21 | 26736 | 23121.38 | 3614.62 |
| 22 | 23691 | 23121.38 | 569.620000000001 |
| 23 | 18157 | 23121.38 | -4964.38 |
| 24 | 17328 | 23121.38 | -5793.38 |
| 25 | 18205 | 23121.38 | -4916.38 |
| 26 | 20995 | 23121.38 | -2126.38 |
| 27 | 17382 | 23121.38 | -5739.38 |
| 28 | 9367 | 23121.38 | -13754.38 |
| 29 | 31124 | 23121.38 | 8002.62 |
| 30 | 26551 | 23121.38 | 3429.62 |
| 31 | 30651 | 23121.38 | 7529.62 |
| 32 | 25859 | 23121.38 | 2737.62 |
| 33 | 25100 | 23121.38 | 1978.62 |
| 34 | 25778 | 23121.38 | 2656.62 |
| 35 | 20418 | 23121.38 | -2703.38 |
| 36 | 18688 | 23121.38 | -4433.38 |
| 37 | 20424 | 23121.38 | -2697.38 |
| 38 | 24776 | 23121.38 | 1654.62 |
| 39 | 19814 | 23121.38 | -3307.38 |
| 40 | 12738 | 23121.38 | -10383.38 |
| 41 | 31566 | 23121.38 | 8444.62 |
| 42 | 30111 | 23121.38 | 6989.62 |
| 43 | 30019 | 23121.38 | 6897.62 |
| 44 | 31934 | 23121.38 | 8812.62 |
| 45 | 25826 | 23121.38 | 2704.62 |
| 46 | 26835 | 23121.38 | 3713.62 |
| 47 | 20205 | 23121.38 | -2916.38 |
| 48 | 17789 | 23121.38 | -5332.38 |
| 49 | 20520 | 23121.38 | -2601.38 |
| 50 | 22518 | 23121.38 | -603.379999999999 |
| 51 | 15572 | 20987.3 | -5415.3 |
| 52 | 11509 | 20987.3 | -9478.3 |
| 53 | 25447 | 20987.3 | 4459.7 |
| 54 | 24090 | 20987.3 | 3102.7 |
| 55 | 27786 | 20987.3 | 6798.7 |
| 56 | 26195 | 20987.3 | 5207.7 |
| 57 | 20516 | 20987.3 | -471.300000000002 |
| 58 | 22759 | 20987.3 | 1771.70 |
| 59 | 19028 | 20987.3 | -1959.3 |
| 60 | 16971 | 20987.3 | -4016.3 |
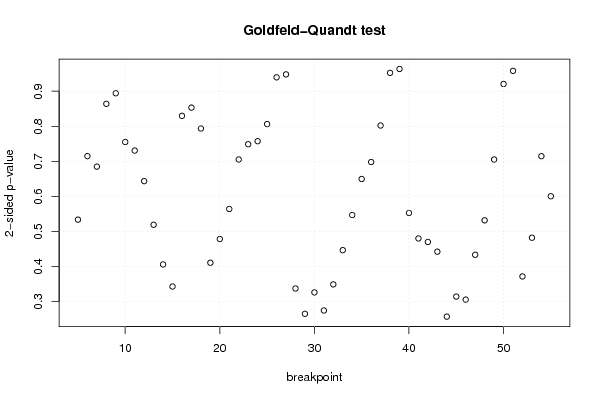
| Goldfeld-Quandt test for Heteroskedasticity | |||
| p-values | Alternative Hypothesis | ||
| breakpoint index | greater | 2-sided | less |
| 5 | 0.733009250543166 | 0.533981498913668 | 0.266990749456834 |
| 6 | 0.64256000871254 | 0.71487998257492 | 0.35743999128746 |
| 7 | 0.657499565518382 | 0.685000868963236 | 0.342500434481618 |
| 8 | 0.568021371258626 | 0.863957257482748 | 0.431978628741374 |
| 9 | 0.447043982824241 | 0.894087965648482 | 0.552956017175759 |
| 10 | 0.377625943340921 | 0.755251886681843 | 0.622374056659079 |
| 11 | 0.365389339306270 | 0.730778678612541 | 0.63461066069373 |
| 12 | 0.321795569259772 | 0.643591138519544 | 0.678204430740228 |
| 13 | 0.259689040603669 | 0.519378081207337 | 0.740310959396331 |
| 14 | 0.203123681580456 | 0.406247363160912 | 0.796876318419544 |
| 15 | 0.171694902962063 | 0.343389805924126 | 0.828305097037937 |
| 16 | 0.414855910326748 | 0.829711820653496 | 0.585144089673252 |
| 17 | 0.573441133566992 | 0.853117732866016 | 0.426558866433008 |
| 18 | 0.603198218898292 | 0.793603562203415 | 0.396801781101708 |
| 19 | 0.794438801941659 | 0.411122396116682 | 0.205561198058341 |
| 20 | 0.760636437854188 | 0.478727124291623 | 0.239363562145812 |
| 21 | 0.717843044986449 | 0.564313910027101 | 0.282156955013550 |
| 22 | 0.647281085811228 | 0.705437828377545 | 0.352718914188772 |
| 23 | 0.625565896235537 | 0.748868207528925 | 0.374434103764463 |
| 24 | 0.621290146580484 | 0.757419706839032 | 0.378709853419516 |
| 25 | 0.596894545701324 | 0.806210908597352 | 0.403105454298676 |
| 26 | 0.530280718257658 | 0.939438563484684 | 0.469719281742342 |
| 27 | 0.526058130804509 | 0.947883738390981 | 0.473941869195491 |
| 28 | 0.831168482599105 | 0.337663034801790 | 0.168831517400895 |
| 29 | 0.867238015655933 | 0.265523968688133 | 0.132761984344067 |
| 30 | 0.83669019042368 | 0.326619619152642 | 0.163309809576321 |
| 31 | 0.862488876545392 | 0.275022246909216 | 0.137511123454608 |
| 32 | 0.825257911572373 | 0.349484176855255 | 0.174742088427627 |
| 33 | 0.776540078009107 | 0.446919843981786 | 0.223459921990893 |
| 34 | 0.726447035478913 | 0.547105929042174 | 0.273552964521087 |
| 35 | 0.675072174263269 | 0.649855651473462 | 0.324927825736731 |
| 36 | 0.650936838846957 | 0.698126322306086 | 0.349063161153043 |
| 37 | 0.598921992526652 | 0.802156014946697 | 0.401078007473348 |
| 38 | 0.523906470854022 | 0.952187058291957 | 0.476093529145978 |
| 39 | 0.481683090227903 | 0.963366180455806 | 0.518316909772097 |
| 40 | 0.723545274521431 | 0.552909450957139 | 0.276454725478569 |
| 41 | 0.759853062935161 | 0.480293874129678 | 0.240146937064839 |
| 42 | 0.764801326568569 | 0.470397346862861 | 0.235198673431430 |
| 43 | 0.778652810957464 | 0.442694378085071 | 0.221347189042536 |
| 44 | 0.871260098082089 | 0.257479803835822 | 0.128739901917911 |
| 45 | 0.842646759100967 | 0.314706481798066 | 0.157353240899033 |
| 46 | 0.84700827806878 | 0.305983443862442 | 0.152991721931221 |
| 47 | 0.783108122784724 | 0.433783754430552 | 0.216891877215276 |
| 48 | 0.734007459968166 | 0.531985080063668 | 0.265992540031834 |
| 49 | 0.64734646151435 | 0.7053070769713 | 0.35265353848565 |
| 50 | 0.539703479976756 | 0.920593040046488 | 0.460296520023244 |
| 51 | 0.521037586763982 | 0.957924826472035 | 0.478962413236018 |
| 52 | 0.813959049274905 | 0.372081901450189 | 0.186040950725095 |
| 53 | 0.7588038782733 | 0.482392243453401 | 0.241196121726701 |
| 54 | 0.642631351465765 | 0.71473729706847 | 0.357368648534235 |
| 55 | 0.699715209987857 | 0.600569580024286 | 0.300284790012143 |
| Meta Analysis of Goldfeld-Quandt test for Heteroskedasticity | |||
| Description | # significant tests | % significant tests | OK/NOK |
| 1% type I error level | 0 | 0 | OK |
| 5% type I error level | 0 | 0 | OK |
| 10% type I error level | 0 | 0 | OK |