| Multiple Linear Regression - Estimated Regression Equation |
| Y[t] = + 0.445876947317449 + 0.0630464964599403X[t] + 0.333944163747943Y1[t] + 0.330677338008161Y2[t] -0.156978631392103Y3[t] + 0.0624645597720463Y4[t] + 0.00560319987550132t + e[t] |
| Multiple Linear Regression - Ordinary Least Squares | |||||
| Variable | Parameter | S.D. | T-STAT H0: parameter = 0 | 2-tail p-value | 1-tail p-value |
| (Intercept) | 0.445876947317449 | 0.154899 | 2.8785 | 0.00595 | 0.002975 |
| X | 0.0630464964599403 | 0.015138 | 4.1649 | 0.000129 | 6.4e-05 |
| Y1 | 0.333944163747943 | 0.139541 | 2.3932 | 0.020664 | 0.010332 |
| Y2 | 0.330677338008161 | 0.146354 | 2.2594 | 0.028433 | 0.014217 |
| Y3 | -0.156978631392103 | 0.146334 | -1.0727 | 0.28875 | 0.144375 |
| Y4 | 0.0624645597720463 | 0.137012 | 0.4559 | 0.650514 | 0.325257 |
| t | 0.00560319987550132 | 0.004337 | 1.292 | 0.202532 | 0.101266 |
| Multiple Linear Regression - Regression Statistics | |
| Multiple R | 0.936908177184696 |
| R-squared | 0.87779693247555 |
| Adjusted R-squared | 0.862521549034993 |
| F-TEST (value) | 57.4648051154637 |
| F-TEST (DF numerator) | 6 |
| F-TEST (DF denominator) | 48 |
| p-value | 0 |
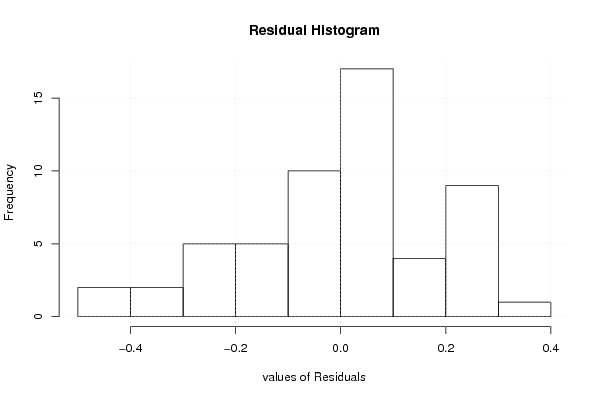
| Multiple Linear Regression - Residual Statistics | |
| Residual Standard Deviation | 0.197210679275923 |
| Sum Squared Residuals | 1.86681849698261 |
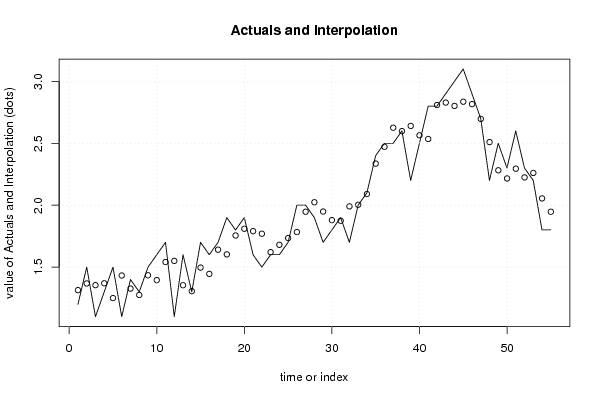
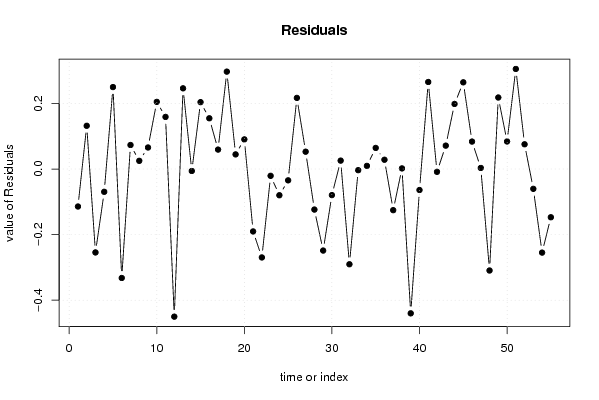
| Multiple Linear Regression - Actuals, Interpolation, and Residuals | |||
| Time or Index | Actuals | Interpolation Forecast | Residuals Prediction Error |
| 1 | 1.2 | 1.31427891049405 | -0.114278910494052 |
| 2 | 1.5 | 1.36805253583041 | 0.131947464169587 |
| 3 | 1.1 | 1.35436347183383 | -0.254363471833830 |
| 4 | 1.3 | 1.36942265217664 | -0.0694226521766431 |
| 5 | 1.5 | 1.24995724822643 | 0.250042751773572 |
| 6 | 1.1 | 1.43218767106564 | -0.332187671065641 |
| 7 | 1.4 | 1.32657642214835 | 0.0734235778516534 |
| 8 | 1.3 | 1.27488447197496 | 0.0251155280250395 |
| 9 | 1.5 | 1.43419012068135 | 0.0658098793186456 |
| 10 | 1.6 | 1.39513035653318 | 0.204869643466815 |
| 11 | 1.7 | 1.54100532110193 | 0.158994678898069 |
| 12 | 1.1 | 1.55020989031344 | -0.450209890313441 |
| 13 | 1.6 | 1.35378612632622 | 0.246213873673778 |
| 14 | 1.3 | 1.30589429881680 | -0.0058942988168041 |
| 15 | 1.7 | 1.49600050232245 | 0.203999497677548 |
| 16 | 1.6 | 1.44522871331938 | 0.154771286680622 |
| 17 | 1.7 | 1.64064360061899 | 0.0593563993810077 |
| 18 | 1.9 | 1.60287056045598 | 0.297129439544019 |
| 19 | 1.8 | 1.75531866357591 | 0.0446813364240905 |
| 20 | 1.9 | 1.8095464934378 | 0.0904535065622017 |
| 21 | 1.6 | 1.79032710558606 | -0.190327105586062 |
| 22 | 1.5 | 1.76961486452360 | -0.269614864523604 |
| 23 | 1.6 | 1.62067612750545 | -0.0206761275054478 |
| 24 | 1.6 | 1.67994605534976 | -0.0799460553497627 |
| 25 | 1.7 | 1.73448943317166 | -0.0344894331716588 |
| 26 | 2 | 1.78306597853551 | 0.216934021464490 |
| 27 | 2 | 1.94708056625140 | 0.0529194337486037 |
| 28 | 1.9 | 2.02357980509815 | -0.123579805098148 |
| 29 | 1.7 | 1.94863680551243 | -0.248636805512435 |
| 30 | 1.8 | 1.87942745641514 | -0.0794274564151391 |
| 31 | 1.9 | 1.87429211784901 | 0.0257078821509930 |
| 32 | 1.7 | 1.99042068713932 | -0.290420687139317 |
| 33 | 2 | 2.00346315907836 | -0.00346315907836029 |
| 34 | 2.1 | 2.09040458012855 | 0.00959541987144743 |
| 35 | 2.4 | 2.33559872614286 | 0.0644012738571437 |
| 36 | 2.5 | 2.47160825438546 | 0.0283917456145374 |
| 37 | 2.5 | 2.6254598761226 | -0.125459876122598 |
| 38 | 2.6 | 2.59806507777451 | 0.00193492222548675 |
| 39 | 2.2 | 2.64010419881721 | -0.440104198817212 |
| 40 | 2.5 | 2.56405322226355 | -0.0640532222635459 |
| 41 | 2.8 | 2.53448017221294 | 0.265519827787057 |
| 42 | 2.8 | 2.80850773114932 | -0.00850773114932122 |
| 43 | 2.9 | 2.82862541980883 | 0.0713745801911665 |
| 44 | 3 | 2.80144091669715 | 0.198559083302852 |
| 45 | 3.1 | 2.83550378786593 | 0.264496212134073 |
| 46 | 2.9 | 2.8162154790259 | 0.0837845209740996 |
| 47 | 2.7 | 2.6966857273927 | 0.00331427260729896 |
| 48 | 2.2 | 2.50947602258702 | -0.309476022587024 |
| 49 | 2.5 | 2.28178595736658 | 0.218214042633417 |
| 50 | 2.3 | 2.21591795310242 | 0.0840820468975784 |
| 51 | 2.6 | 2.29471332678845 | 0.305286673211552 |
| 52 | 2.3 | 2.22451519065308 | 0.0754848093469237 |
| 53 | 2.2 | 2.26035948807870 | -0.0603594880786954 |
| 54 | 1.8 | 2.05486461986693 | -0.254864619866932 |
| 55 | 1.8 | 1.94704607849970 | -0.147046078499697 |
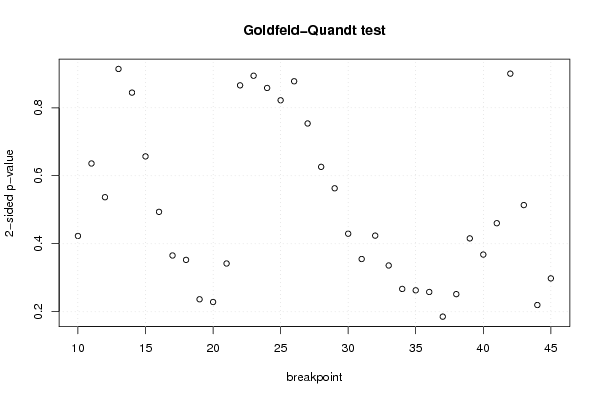
| Goldfeld-Quandt test for Heteroskedasticity | |||
| p-values | Alternative Hypothesis | ||
| breakpoint index | greater | 2-sided | less |
| 10 | 0.211420173856209 | 0.422840347712417 | 0.788579826143791 |
| 11 | 0.31802405503939 | 0.63604811007878 | 0.68197594496061 |
| 12 | 0.268439643709498 | 0.536879287418996 | 0.731560356290502 |
| 13 | 0.542903819448485 | 0.91419236110303 | 0.457096180551515 |
| 14 | 0.422274292694362 | 0.844548585388724 | 0.577725707305638 |
| 15 | 0.328467881227638 | 0.656935762455277 | 0.671532118772362 |
| 16 | 0.246861540264447 | 0.493723080528893 | 0.753138459735553 |
| 17 | 0.182705144518865 | 0.365410289037730 | 0.817294855481135 |
| 18 | 0.176205126638044 | 0.352410253276088 | 0.823794873361956 |
| 19 | 0.118264932624138 | 0.236529865248277 | 0.881735067375862 |
| 20 | 0.114249372285798 | 0.228498744571596 | 0.885750627714202 |
| 21 | 0.170902093755159 | 0.341804187510319 | 0.82909790624484 |
| 22 | 0.432982529268914 | 0.865965058537827 | 0.567017470731086 |
| 23 | 0.447121642691358 | 0.894243285382716 | 0.552878357308642 |
| 24 | 0.42911722975912 | 0.85823445951824 | 0.57088277024088 |
| 25 | 0.411004852454363 | 0.822009704908726 | 0.588995147545637 |
| 26 | 0.438973211764935 | 0.87794642352987 | 0.561026788235065 |
| 27 | 0.376894933912173 | 0.753789867824346 | 0.623105066087827 |
| 28 | 0.313094096623238 | 0.626188193246476 | 0.686905903376762 |
| 29 | 0.281534701854143 | 0.563069403708287 | 0.718465298145857 |
| 30 | 0.214726329429644 | 0.429452658859288 | 0.785273670570356 |
| 31 | 0.177490287637738 | 0.354980575275476 | 0.822509712362262 |
| 32 | 0.21190609104764 | 0.42381218209528 | 0.78809390895236 |
| 33 | 0.167982618314296 | 0.335965236628592 | 0.832017381685704 |
| 34 | 0.133482519829578 | 0.266965039659156 | 0.866517480170422 |
| 35 | 0.131485943545401 | 0.262971887090802 | 0.868514056454599 |
| 36 | 0.128991360033838 | 0.257982720067677 | 0.871008639966162 |
| 37 | 0.0927168141348684 | 0.185433628269737 | 0.907283185865132 |
| 38 | 0.125835433180092 | 0.251670866360183 | 0.874164566819909 |
| 39 | 0.207861712912317 | 0.415723425824633 | 0.792138287087683 |
| 40 | 0.184035224654684 | 0.368070449309368 | 0.815964775345316 |
| 41 | 0.230181162882447 | 0.460362325764894 | 0.769818837117553 |
| 42 | 0.5498234619782 | 0.9003530760436 | 0.4501765380218 |
| 43 | 0.743142415358971 | 0.513715169282058 | 0.256857584641029 |
| 44 | 0.890179813533516 | 0.219640372932969 | 0.109820186466484 |
| 45 | 0.850979934350582 | 0.298040131298837 | 0.149020065649419 |
| Meta Analysis of Goldfeld-Quandt test for Heteroskedasticity | |||
| Description | # significant tests | % significant tests | OK/NOK |
| 1% type I error level | 0 | 0 | OK |
| 5% type I error level | 0 | 0 | OK |
| 10% type I error level | 0 | 0 | OK |