| Multiple Linear Regression - Estimated Regression Equation |
| Inschrijvingen[t] = + 15770.76 + 2663.05000000000Dummy[t] + 1405.98999999999M1[t] + 3737.39M2[t] + 182.000000000005M3[t] -6277.4M4[t] + 12066M5[t] + 9268.6M6[t] + 12510.4M7[t] + 9625.8M8[t] + 6215.4M9[t] + 7320.2M10[t] + 1254.40000000000M11[t] + e[t] |
| Multiple Linear Regression - Ordinary Least Squares | |||||
| Variable | Parameter | S.D. | T-STAT H0: parameter = 0 | 2-tail p-value | 1-tail p-value |
| (Intercept) | 15770.76 | 910.035338 | 17.3298 | 0 | 0 |
| Dummy | 2663.05000000000 | 608.042937 | 4.3797 | 6.6e-05 | 3.3e-05 |
| M1 | 1405.98999999999 | 1094.477286 | 1.2846 | 0.20522 | 0.10261 |
| M2 | 3737.39 | 1094.477286 | 3.4148 | 0.001325 | 0.000662 |
| M3 | 182.000000000005 | 1087.700272 | 0.1673 | 0.867832 | 0.433916 |
| M4 | -6277.4 | 1087.700272 | -5.7713 | 1e-06 | 0 |
| M5 | 12066 | 1087.700272 | 11.0931 | 0 | 0 |
| M6 | 9268.6 | 1087.700272 | 8.5213 | 0 | 0 |
| M7 | 12510.4 | 1087.700272 | 11.5017 | 0 | 0 |
| M8 | 9625.8 | 1087.700272 | 8.8497 | 0 | 0 |
| M9 | 6215.4 | 1087.700272 | 5.7143 | 1e-06 | 0 |
| M10 | 7320.2 | 1087.700272 | 6.73 | 0 | 0 |
| M11 | 1254.40000000000 | 1087.700272 | 1.1533 | 0.254636 | 0.127318 |
| Multiple Linear Regression - Regression Statistics | |
| Multiple R | 0.96379785711296 |
| R-squared | 0.928906309375533 |
| Adjusted R-squared | 0.910754728790563 |
| F-TEST (value) | 51.1749544359064 |
| F-TEST (DF numerator) | 12 |
| F-TEST (DF denominator) | 47 |
| p-value | 0 |
| Multiple Linear Regression - Residual Statistics | |
| Residual Standard Deviation | 1719.80513480514 |
| Sum Squared Residuals | 139013295.98 |
| Multiple Linear Regression - Actuals, Interpolation, and Residuals | |||
| Time or Index | Actuals | Interpolation Forecast | Residuals Prediction Error |
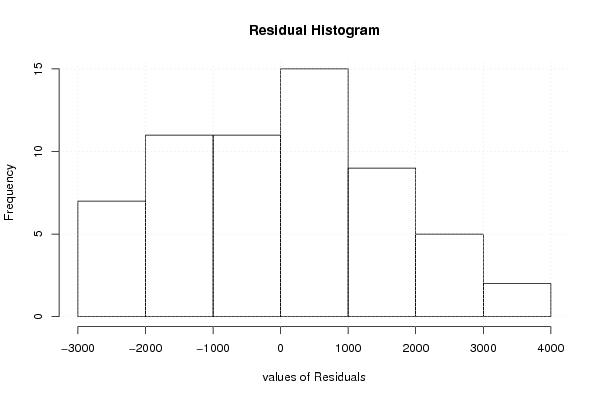
| 1 | 20366 | 19839.8000000001 | 526.199999999949 |
| 2 | 22782 | 22171.2 | 610.799999999992 |
| 3 | 19169 | 18615.81 | 553.189999999995 |
| 4 | 13807 | 12156.41 | 1650.59000000000 |
| 5 | 29743 | 30499.81 | -756.810000000016 |
| 6 | 25591 | 27702.41 | -2111.41000000000 |
| 7 | 29096 | 30944.21 | -1848.21000000000 |
| 8 | 26482 | 28059.61 | -1577.61000000000 |
| 9 | 22405 | 24649.21 | -2244.21000000000 |
| 10 | 27044 | 25754.01 | 1289.99 |
| 11 | 17970 | 19688.21 | -1718.21000000000 |
| 12 | 18730 | 18433.81 | 296.190000000005 |
| 13 | 19684 | 19839.8 | -155.799999999987 |
| 14 | 19785 | 22171.2 | -2386.2 |
| 15 | 18479 | 18615.81 | -136.809999999999 |
| 16 | 10698 | 12156.41 | -1458.41 |
| 17 | 31956 | 30499.81 | 1456.19000000001 |
| 18 | 29506 | 27702.41 | 1803.59 |
| 19 | 34506 | 30944.21 | 3561.79 |
| 20 | 27165 | 28059.61 | -894.610000000002 |
| 21 | 26736 | 24649.21 | 2086.79 |
| 22 | 23691 | 25754.01 | -2063.01 |
| 23 | 18157 | 19688.21 | -1531.21000000000 |
| 24 | 17328 | 18433.81 | -1105.81000000000 |
| 25 | 18205 | 19839.8 | -1634.79999999999 |
| 26 | 20995 | 22171.2 | -1176.2 |
| 27 | 17382 | 18615.81 | -1233.81000000000 |
| 28 | 9367 | 12156.41 | -2789.41 |
| 29 | 31124 | 30499.81 | 624.190000000005 |
| 30 | 26551 | 27702.41 | -1151.41 |
| 31 | 30651 | 30944.21 | -293.210000000002 |
| 32 | 25859 | 28059.61 | -2200.61 |
| 33 | 25100 | 24649.21 | 450.789999999999 |
| 34 | 25778 | 25754.01 | 23.9899999999998 |
| 35 | 20418 | 19688.21 | 729.789999999999 |
| 36 | 18688 | 18433.81 | 254.19 |
| 37 | 20424 | 19839.8 | 584.200000000012 |
| 38 | 24776 | 22171.2 | 2604.8 |
| 39 | 19814 | 18615.81 | 1198.19 |
| 40 | 12738 | 12156.41 | 581.5900 |
| 41 | 31566 | 30499.81 | 1066.19000000001 |
| 42 | 30111 | 27702.41 | 2408.59 |
| 43 | 30019 | 30944.21 | -925.210000000003 |
| 44 | 31934 | 28059.61 | 3874.39 |
| 45 | 25826 | 24649.21 | 1176.79 |
| 46 | 26835 | 25754.01 | 1080.99 |
| 47 | 20205 | 19688.21 | 516.789999999999 |
| 48 | 17789 | 18433.81 | -644.810000000003 |
| 49 | 20520 | 19839.8 | 680.200000000012 |
| 50 | 22518 | 22171.2 | 346.800000000002 |
| 51 | 15572 | 15952.76 | -380.759999999998 |
| 52 | 11509 | 9493.36 | 2015.64 |
| 53 | 25447 | 27836.76 | -2389.76 |
| 54 | 24090 | 25039.36 | -949.36 |
| 55 | 27786 | 28281.16 | -495.16 |
| 56 | 26195 | 25396.56 | 798.44 |
| 57 | 20516 | 21986.16 | -1470.16 |
| 58 | 22759 | 23090.96 | -331.960000000000 |
| 59 | 19028 | 17025.16 | 2002.84 |
| 60 | 16971 | 15770.76 | 1200.24 |
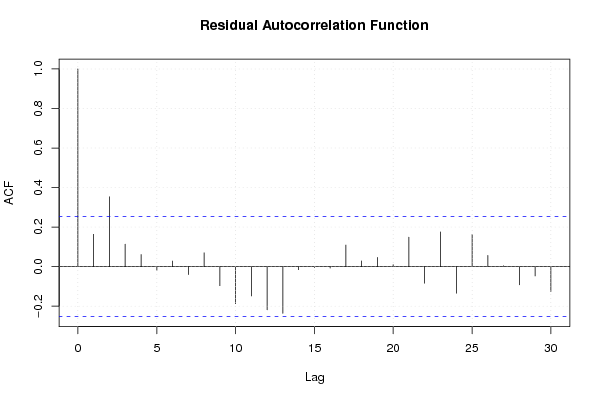
| Goldfeld-Quandt test for Heteroskedasticity | |||
| p-values | Alternative Hypothesis | ||
| breakpoint index | greater | 2-sided | less |
| 16 | 0.599713718062345 | 0.80057256387531 | 0.400286281937655 |
| 17 | 0.544076062317162 | 0.911847875365675 | 0.455923937682838 |
| 18 | 0.667552012425496 | 0.664895975149007 | 0.332447987574504 |
| 19 | 0.889995171252738 | 0.220009657494524 | 0.110004828747262 |
| 20 | 0.836981030284456 | 0.326037939431088 | 0.163018969715544 |
| 21 | 0.885270512216991 | 0.229458975566018 | 0.114729487783009 |
| 22 | 0.895513049055763 | 0.208973901888474 | 0.104486950944237 |
| 23 | 0.871485733024789 | 0.257028533950422 | 0.128514266975211 |
| 24 | 0.830088919138037 | 0.339822161723927 | 0.169911080861963 |
| 25 | 0.812016637228563 | 0.375966725542875 | 0.187983362771437 |
| 26 | 0.784227123181592 | 0.431545753636816 | 0.215772876818408 |
| 27 | 0.745598471016107 | 0.508803057967785 | 0.254401528983893 |
| 28 | 0.86550087460045 | 0.268998250799101 | 0.134499125399551 |
| 29 | 0.813287430450995 | 0.37342513909801 | 0.186712569549005 |
| 30 | 0.791525563854365 | 0.416948872291270 | 0.208474436145635 |
| 31 | 0.722852306553281 | 0.554295386893438 | 0.277147693446719 |
| 32 | 0.911102527194115 | 0.177794945611771 | 0.0888974728058854 |
| 33 | 0.86369737443048 | 0.272605251139039 | 0.136302625569519 |
| 34 | 0.808855514539225 | 0.38228897092155 | 0.191144485460775 |
| 35 | 0.779243332011965 | 0.441513335976069 | 0.220756667988035 |
| 36 | 0.699391996652133 | 0.601216006695735 | 0.300608003347867 |
| 37 | 0.605764057692887 | 0.788471884614227 | 0.394235942307113 |
| 38 | 0.663775043030076 | 0.672449913939848 | 0.336224956969924 |
| 39 | 0.569631584002996 | 0.860736831994008 | 0.430368415997004 |
| 40 | 0.571016433972038 | 0.857967132055924 | 0.428983566027962 |
| 41 | 0.54724133690096 | 0.90551732619808 | 0.45275866309904 |
| 42 | 0.593965203751387 | 0.812069592497227 | 0.406034796248613 |
| 43 | 0.475603277253114 | 0.951206554506227 | 0.524396722746886 |
| 44 | 0.571778219711248 | 0.856443560577505 | 0.428221780288752 |
| Meta Analysis of Goldfeld-Quandt test for Heteroskedasticity | |||
| Description | # significant tests | % significant tests | OK/NOK |
| 1% type I error level | 0 | 0 | OK |
| 5% type I error level | 0 | 0 | OK |
| 10% type I error level | 0 | 0 | OK |