Free Statistics
of Irreproducible Research!
Description of Statistical Computation | |||||||||||||||||||||
|---|---|---|---|---|---|---|---|---|---|---|---|---|---|---|---|---|---|---|---|---|---|
| Author's title | |||||||||||||||||||||
| Author | *The author of this computation has been verified* | ||||||||||||||||||||
| R Software Module | rwasp_backtobackhist.wasp | ||||||||||||||||||||
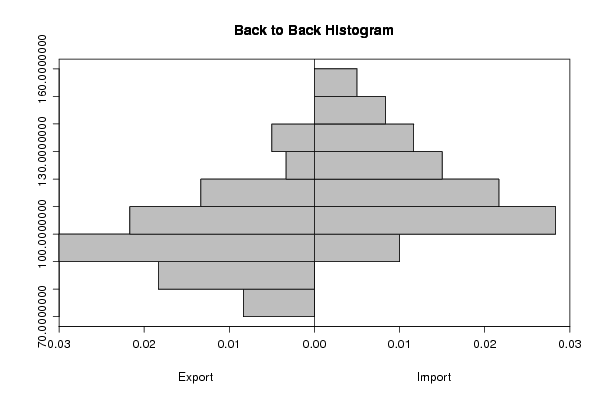
| Title produced by software | Back to Back Histogram | ||||||||||||||||||||
| Date of computation | Mon, 09 Nov 2009 04:26:07 -0700 | ||||||||||||||||||||
| Cite this page as follows | Statistical Computations at FreeStatistics.org, Office for Research Development and Education, URL https://freestatistics.org/blog/index.php?v=date/2009/Nov/09/t1257766058v60km54uvjvmtrd.htm/, Retrieved Thu, 25 Apr 2024 22:21:45 +0000 | ||||||||||||||||||||
| Statistical Computations at FreeStatistics.org, Office for Research Development and Education, URL https://freestatistics.org/blog/index.php?pk=54738, Retrieved Thu, 25 Apr 2024 22:21:45 +0000 | |||||||||||||||||||||
| QR Codes: | |||||||||||||||||||||
|
| |||||||||||||||||||||
| Original text written by user: | |||||||||||||||||||||
| IsPrivate? | No (this computation is public) | ||||||||||||||||||||
| User-defined keywords | |||||||||||||||||||||
| Estimated Impact | 176 | ||||||||||||||||||||
Tree of Dependent Computations | |||||||||||||||||||||
| Family? (F = Feedback message, R = changed R code, M = changed R Module, P = changed Parameters, D = changed Data) | |||||||||||||||||||||
| - [Notched Boxplots] [3/11/2009] [2009-11-02 21:10:41] [b98453cac15ba1066b407e146608df68] - D [Notched Boxplots] [] [2009-11-09 10:28:17] [023d83ebdf42a2acf423907b4076e8a1] - RMPD [Back to Back Histogram] [] [2009-11-09 11:26:07] [9f6463b67b1eb7bae5c03a796abf0348] [Current] | |||||||||||||||||||||
| Feedback Forum | |||||||||||||||||||||
Post a new message | |||||||||||||||||||||
Dataset | |||||||||||||||||||||
| Dataseries X: | |||||||||||||||||||||
100 79.53631927 77.14613839 94.99712891 98.11943727 85.46511628 82.48636233 92.01119724 100.97617 99.94257824 120.1909274 109.804766 84.76169968 92.07579673 109.4028137 109.4315245 109.1085271 135.0775194 98.70801034 95.93023256 118.712317 100.796727 124.2750502 95.5211025 116.0134941 107.931381 105.9933965 112.3743899 113.5371806 101.0407695 100.0358886 119.3224232 138.4582257 97.10020098 96.16709733 89.80763709 107.0700546 110.5871375 99.31811657 131.1728395 114.219064 92.53517083 92.736147 98.21274763 91.06373816 104.3927649 89.89376974 93.69796153 91.50875682 78.22279644 114.9511915 101.8446741 86.76428366 82.23514212 81.04364054 77.06000574 87.80505312 81.50301464 78.32328452 80.12489233 | |||||||||||||||||||||
| Dataseries Y: | |||||||||||||||||||||
100 96.21064363 96.31280765 107.1793443 114.9066592 92.56060184 114.9995356 107.1236185 117.7765394 107.3650971 106.2970187 114.5072908 98.0031578 103.0649206 100.2879168 104.6066685 111.1544534 104.9874617 109.9284852 111.5352466 132.4974459 100.3436426 123.0983561 114.2379493 104.569518 109.0833101 106.9843039 133.6769759 124.8537197 122.5132349 116.8013374 116.0118882 129.7575926 125.1973623 143.7912139 127.9465032 130.2962757 108.4424631 129.3675118 143.6797622 131.8844618 117.6186496 118.9560695 104.8202842 134.624315 140.401226 143.8005015 153.4317823 153.2924677 127.3149438 153.5525216 136.9276493 131.7730101 144.3391845 107.4208229 113.6249652 124.2221603 102.0618557 96.36853348 111.6838488 | |||||||||||||||||||||
Tables (Output of Computation) | |||||||||||||||||||||
| |||||||||||||||||||||
Figures (Output of Computation) | |||||||||||||||||||||
Input Parameters & R Code | |||||||||||||||||||||
| Parameters (Session): | |||||||||||||||||||||
| par1 = grey ; par2 = grey ; par3 = TRUE ; par4 = Export ; par5 = Import ; | |||||||||||||||||||||
| Parameters (R input): | |||||||||||||||||||||
| par1 = grey ; par2 = grey ; par3 = TRUE ; par4 = Export ; par5 = Import ; | |||||||||||||||||||||
| R code (references can be found in the software module): | |||||||||||||||||||||
if (par3 == 'TRUE') par3 <- TRUE | |||||||||||||||||||||