Free Statistics
of Irreproducible Research!
Description of Statistical Computation | |||||||||||||||||||||||||||||||||||||||||
|---|---|---|---|---|---|---|---|---|---|---|---|---|---|---|---|---|---|---|---|---|---|---|---|---|---|---|---|---|---|---|---|---|---|---|---|---|---|---|---|---|---|
| Author's title | |||||||||||||||||||||||||||||||||||||||||
| Author | *The author of this computation has been verified* | ||||||||||||||||||||||||||||||||||||||||
| R Software Module | rwasp_boxcoxnorm.wasp | ||||||||||||||||||||||||||||||||||||||||
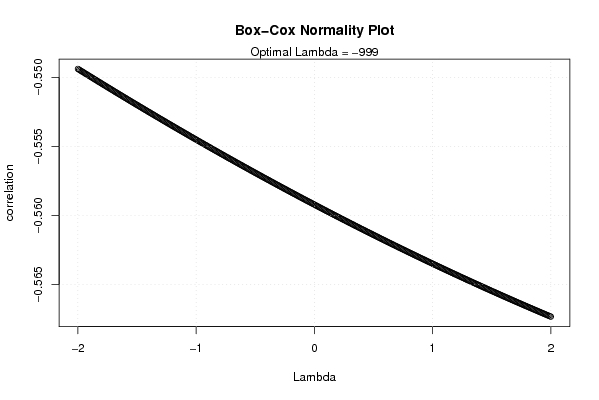
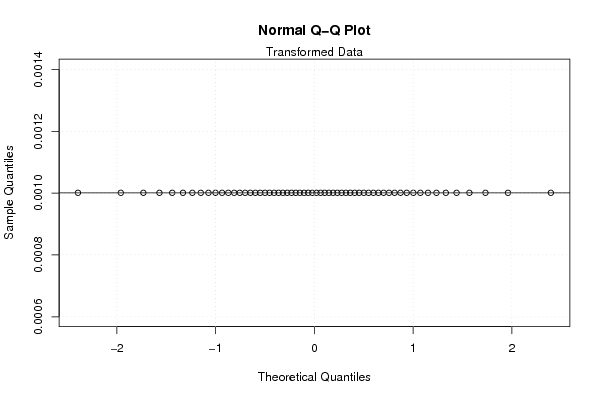
| Title produced by software | Box-Cox Normality Plot | ||||||||||||||||||||||||||||||||||||||||
| Date of computation | Mon, 09 Nov 2009 13:19:37 -0700 | ||||||||||||||||||||||||||||||||||||||||
| Cite this page as follows | Statistical Computations at FreeStatistics.org, Office for Research Development and Education, URL https://freestatistics.org/blog/index.php?v=date/2009/Nov/09/t1257798166d4gbdcff6acs5vo.htm/, Retrieved Tue, 16 Apr 2024 09:48:50 +0000 | ||||||||||||||||||||||||||||||||||||||||
| Statistical Computations at FreeStatistics.org, Office for Research Development and Education, URL https://freestatistics.org/blog/index.php?pk=55007, Retrieved Tue, 16 Apr 2024 09:48:50 +0000 | |||||||||||||||||||||||||||||||||||||||||
| QR Codes: | |||||||||||||||||||||||||||||||||||||||||
|
| |||||||||||||||||||||||||||||||||||||||||
| Original text written by user: | |||||||||||||||||||||||||||||||||||||||||
| IsPrivate? | No (this computation is public) | ||||||||||||||||||||||||||||||||||||||||
| User-defined keywords | |||||||||||||||||||||||||||||||||||||||||
| Estimated Impact | 207 | ||||||||||||||||||||||||||||||||||||||||
Tree of Dependent Computations | |||||||||||||||||||||||||||||||||||||||||
| Family? (F = Feedback message, R = changed R code, M = changed R Module, P = changed Parameters, D = changed Data) | |||||||||||||||||||||||||||||||||||||||||
| - [Box-Cox Normality Plot] [3/11/2009] [2009-11-02 22:22:24] [b98453cac15ba1066b407e146608df68] - D [Box-Cox Normality Plot] [transformatie] [2009-11-09 20:19:37] [9f6463b67b1eb7bae5c03a796abf0348] [Current] - D [Box-Cox Normality Plot] [WS 6 transformatie] [2009-11-10 19:31:57] [830e13ac5e5ac1e5b21c6af0c149b21d] | |||||||||||||||||||||||||||||||||||||||||
| Feedback Forum | |||||||||||||||||||||||||||||||||||||||||
Post a new message | |||||||||||||||||||||||||||||||||||||||||
Dataset | |||||||||||||||||||||||||||||||||||||||||
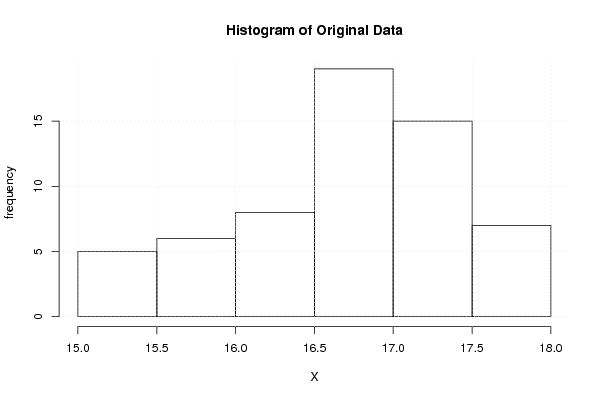
| Dataseries X: | |||||||||||||||||||||||||||||||||||||||||
17,44882829 17,23968844 16,87169003 16,58114384 16,78103959 16,85529767 16,72365849 16,90960919 17,08723243 17,49037894 17,59188103 17,39123937 17,41919121 17,60948541 17,79564686 17,73817793 17,53934061 17,67148503 17,60548217 17,40753605 17,03135891 17,11980342 17,09461945 17,00142777 17,06290921 17,1488191 16,95065029 16,71530576 16,86598269 16,81276027 16,69517287 16,5080894 16,51145508 16,573667 16,37506628 16,43722584 16,25778915 16,04792594 15,76984363 15,83799935 15,74967365 15,73193313 15,28927402 15,16807022 15,27289001 15,27508076 15,15790652 15,59941332 15,95949348 16,63995622 17,05923948 16,55331321 16,6972516 17,02040019 16,82974618 16,73132794 16,41864159 16,18084481 16,13515788 16,02243489 | |||||||||||||||||||||||||||||||||||||||||
Tables (Output of Computation) | |||||||||||||||||||||||||||||||||||||||||
| |||||||||||||||||||||||||||||||||||||||||
Figures (Output of Computation) | |||||||||||||||||||||||||||||||||||||||||
Input Parameters & R Code | |||||||||||||||||||||||||||||||||||||||||
| Parameters (Session): | |||||||||||||||||||||||||||||||||||||||||
| Parameters (R input): | |||||||||||||||||||||||||||||||||||||||||
| R code (references can be found in the software module): | |||||||||||||||||||||||||||||||||||||||||
n <- length(x) | |||||||||||||||||||||||||||||||||||||||||