| Multiple Linear Regression - Estimated Regression Equation |
| Y[t] = + 12017.7830247441 -174.383836222070X[t] -719.912886653628M1[t] -823.449856480296M2[t] -765.857775875422M3[t] -449.979957771428M4[t] -864.265695270547M5[t] -588.434180183885M6[t] -686.588928026133M7[t] -679.82747414218M8[t] -132.737858192417M9[t] -513.330989656872M10[t] -419.160565518212M11[t] + e[t] |
| Multiple Linear Regression - Ordinary Least Squares | |||||
| Variable | Parameter | S.D. | T-STAT H0: parameter = 0 | 2-tail p-value | 1-tail p-value |
| (Intercept) | 12017.7830247441 | 1895.375948 | 6.3406 | 0 | 0 |
| X | -174.383836222070 | 46.980391 | -3.7118 | 0.000544 | 0.000272 |
| M1 | -719.912886653628 | 375.895987 | -1.9152 | 0.061564 | 0.030782 |
| M2 | -823.449856480296 | 375.542108 | -2.1927 | 0.033315 | 0.016657 |
| M3 | -765.857775875422 | 375.029626 | -2.0421 | 0.046772 | 0.023386 |
| M4 | -449.979957771428 | 374.846949 | -1.2004 | 0.235985 | 0.117993 |
| M5 | -864.265695270547 | 374.568512 | -2.3074 | 0.025487 | 0.012743 |
| M6 | -588.434180183885 | 374.432193 | -1.5715 | 0.122766 | 0.061383 |
| M7 | -686.588928026133 | 373.759183 | -1.837 | 0.07254 | 0.03627 |
| M8 | -679.82747414218 | 372.975923 | -1.8227 | 0.074712 | 0.037356 |
| M9 | -132.737858192417 | 372.841934 | -0.356 | 0.723421 | 0.361711 |
| M10 | -513.330989656872 | 372.781014 | -1.377 | 0.175026 | 0.087513 |
| M11 | -419.160565518212 | 372.756004 | -1.1245 | 0.266515 | 0.133258 |
| Multiple Linear Regression - Regression Statistics | |
| Multiple R | 0.562255368238571 |
| R-squared | 0.316131099113091 |
| Adjusted R-squared | 0.141526273354732 |
| F-TEST (value) | 1.81055190049898 |
| F-TEST (DF numerator) | 12 |
| F-TEST (DF denominator) | 47 |
| p-value | 0.0738665033626638 |
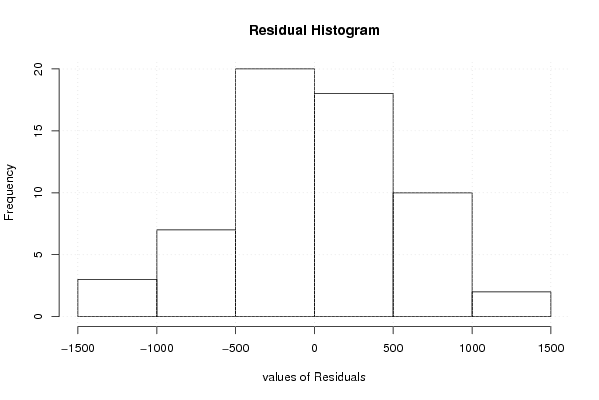
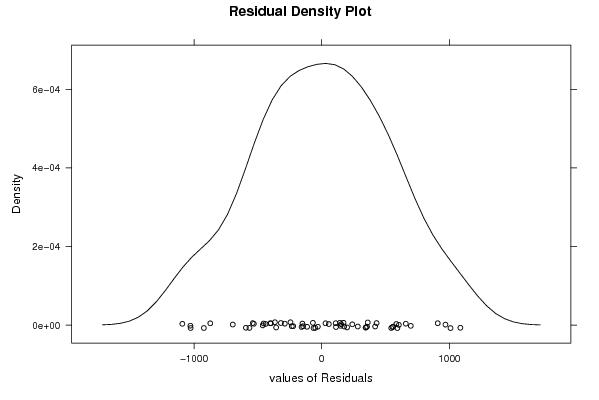
| Multiple Linear Regression - Residual Statistics | |
| Residual Standard Deviation | 589.359817260218 |
| Sum Squared Residuals | 16325214.7274469 |
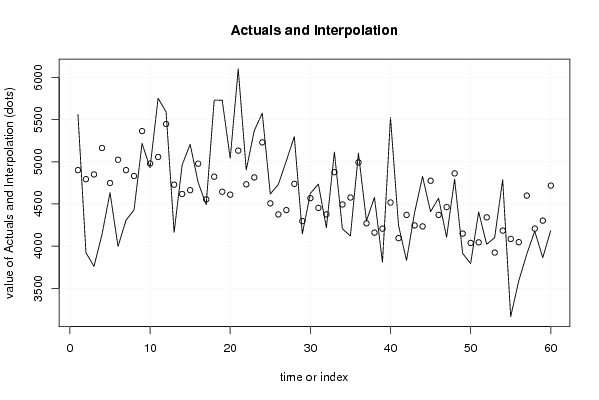
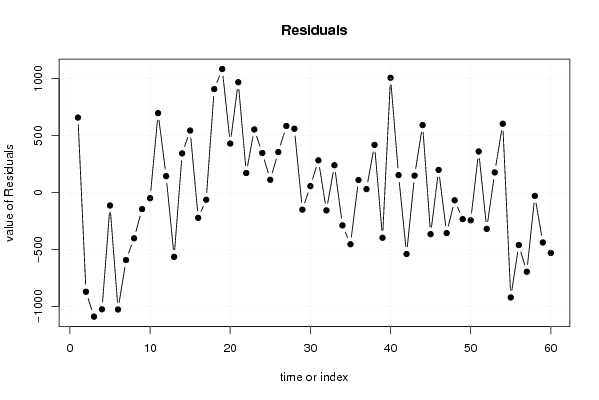
| Multiple Linear Regression - Actuals, Interpolation, and Residuals | |||
| Time or Index | Actuals | Interpolation Forecast | Residuals Prediction Error |
| 1 | 5560 | 4901.47102546502 | 658.528974534976 |
| 2 | 3922 | 4794.44637891388 | -872.446378913876 |
| 3 | 3759 | 4850.29462115653 | -1091.29462115653 |
| 4 | 4138 | 5164.4286008983 | -1026.42860089830 |
| 5 | 4634 | 4748.39902503696 | -114.399025036963 |
| 6 | 3996 | 5024.23054012363 | -1028.23054012363 |
| 7 | 4308 | 4901.66205521029 | -593.662055210287 |
| 8 | 4429 | 4831.69462115653 | -402.69462115653 |
| 9 | 5219 | 5364.83353020853 | -145.833530208527 |
| 10 | 4929 | 4979.00888365741 | -50.0088836574102 |
| 11 | 5755 | 5057.48476253608 | 697.515237463916 |
| 12 | 5592 | 5448.74391425876 | 143.256085741236 |
| 13 | 4163 | 4728.83102760514 | -565.831027605136 |
| 14 | 4962 | 4618.31870432959 | 343.681295670415 |
| 15 | 5208 | 4663.70391639891 | 544.296083601085 |
| 16 | 4755 | 4977.83789614069 | -222.837896140689 |
| 17 | 4491 | 4554.83296683046 | -63.8329668304644 |
| 18 | 5732 | 4823.68912846824 | 908.310871531756 |
| 19 | 5731 | 4645.31781596384 | 1085.68218403616 |
| 20 | 5040 | 4610.2271491545 | 429.772850845499 |
| 21 | 6102 | 5132.90302803317 | 969.096971966826 |
| 22 | 4904 | 4733.12767458429 | 170.872325415709 |
| 23 | 5369 | 4815.09123018741 | 553.908769812594 |
| 24 | 5578 | 5230.76411898118 | 347.235881018824 |
| 25 | 4619 | 4507.36355560311 | 111.636444396893 |
| 26 | 4731 | 4375.92517198091 | 355.074828019092 |
| 27 | 5011 | 4426.5418991369 | 584.458100863101 |
| 28 | 5299 | 4738.93204051645 | 560.067959483547 |
| 29 | 4146 | 4296.7448892218 | -150.744889221801 |
| 30 | 4625 | 4569.08872758402 | 55.9112724159788 |
| 31 | 4736 | 4453.49559611957 | 282.504403880433 |
| 32 | 4219 | 4376.55280861693 | -157.552808616926 |
| 33 | 5116 | 4876.55878878673 | 239.441211213269 |
| 34 | 4205 | 4494.22181896005 | -289.221818960054 |
| 35 | 4121 | 4576.18537456317 | -455.185374563169 |
| 36 | 5103 | 4993.60210171916 | 109.397898280839 |
| 37 | 4300 | 4270.20153834109 | 29.7984616589081 |
| 38 | 4578 | 4159.68921506554 | 418.31078493446 |
| 39 | 3809 | 4206.81826549709 | -397.818265497091 |
| 40 | 5526 | 4517.46456851442 | 1008.53543148558 |
| 41 | 4247 | 4094.4596392042 | 152.540360795800 |
| 42 | 3830 | 4370.29115429086 | -540.291154290862 |
| 43 | 4394 | 4245.9788310153 | 148.021168984697 |
| 44 | 4826 | 4233.55806291483 | 592.441937085171 |
| 45 | 4409 | 4775.41616377793 | -366.416163777929 |
| 46 | 4569 | 4370.40929524239 | 198.590704757615 |
| 47 | 4106 | 4462.83588101882 | -356.835881018823 |
| 48 | 4794 | 4862.81422455261 | -68.8142245526083 |
| 49 | 3914 | 4148.13285298564 | -234.132852985642 |
| 50 | 3793 | 4037.62052971009 | -244.620529710091 |
| 51 | 4405 | 4044.64129781057 | 360.358702189434 |
| 52 | 4022 | 4341.33689393013 | -319.336893930132 |
| 53 | 4100 | 3923.56347970657 | 176.436520293429 |
| 54 | 4788 | 4183.70044953325 | 604.299550466753 |
| 55 | 3163 | 4085.545701691 | -922.545701690999 |
| 56 | 3585 | 4046.96735815721 | -461.967358157214 |
| 57 | 3903 | 4599.28848919364 | -696.288489193638 |
| 58 | 4178 | 4208.23232755586 | -30.2323275558589 |
| 59 | 3863 | 4302.40275169452 | -439.402751694519 |
| 60 | 4187 | 4718.07564048829 | -531.07564048829 |
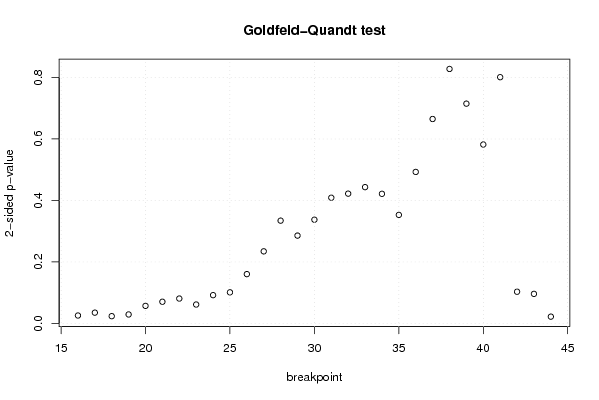
| Goldfeld-Quandt test for Heteroskedasticity | |||
| p-values | Alternative Hypothesis | ||
| breakpoint index | greater | 2-sided | less |
| 16 | 0.98718275466095 | 0.0256344906780978 | 0.0128172453390489 |
| 17 | 0.98253826973966 | 0.0349234605206814 | 0.0174617302603407 |
| 18 | 0.988249051879452 | 0.0235018962410954 | 0.0117509481205477 |
| 19 | 0.985484931311676 | 0.0290301373766484 | 0.0145150686883242 |
| 20 | 0.971487191980522 | 0.0570256160389559 | 0.0285128080194780 |
| 21 | 0.964789418678295 | 0.0704211626434107 | 0.0352105813217054 |
| 22 | 0.959601405351012 | 0.0807971892979765 | 0.0403985946489882 |
| 23 | 0.969319959199203 | 0.0613600816015939 | 0.0306800408007969 |
| 24 | 0.954059458887378 | 0.0918810822252439 | 0.0459405411126220 |
| 25 | 0.949467904209826 | 0.101064191580348 | 0.0505320957901738 |
| 26 | 0.919864583201895 | 0.160270833596210 | 0.0801354167981048 |
| 27 | 0.882796764585574 | 0.234406470828852 | 0.117203235414426 |
| 28 | 0.832866973608645 | 0.33426605278271 | 0.167133026391355 |
| 29 | 0.857193899594449 | 0.285612200811102 | 0.142806100405551 |
| 30 | 0.831336055060833 | 0.337327889878334 | 0.168663944939167 |
| 31 | 0.795570989715494 | 0.408858020569012 | 0.204429010284506 |
| 32 | 0.78896452473448 | 0.422070950531039 | 0.211035475265520 |
| 33 | 0.778365488638518 | 0.443269022722965 | 0.221634511361482 |
| 34 | 0.78923113276568 | 0.421537734468639 | 0.210768867234320 |
| 35 | 0.823529320892866 | 0.352941358214267 | 0.176470679107134 |
| 36 | 0.753615042836195 | 0.492769914327611 | 0.246384957163806 |
| 37 | 0.667522008075206 | 0.664955983849588 | 0.332477991924794 |
| 38 | 0.586104811595947 | 0.827790376808106 | 0.413895188404053 |
| 39 | 0.642565435667711 | 0.714869128664577 | 0.357434564332289 |
| 40 | 0.709038090798675 | 0.581923818402651 | 0.290961909201325 |
| 41 | 0.599509828505141 | 0.800980342989717 | 0.400490171494859 |
| 42 | 0.94848212015703 | 0.103035759685940 | 0.0515178798429699 |
| 43 | 0.952004144197051 | 0.0959917116058979 | 0.0479958558029490 |
| 44 | 0.989043095114513 | 0.0219138097709738 | 0.0109569048854869 |
| Meta Analysis of Goldfeld-Quandt test for Heteroskedasticity | |||
| Description | # significant tests | % significant tests | OK/NOK |
| 1% type I error level | 0 | 0 | OK |
| 5% type I error level | 5 | 0.172413793103448 | NOK |
| 10% type I error level | 11 | 0.379310344827586 | NOK |