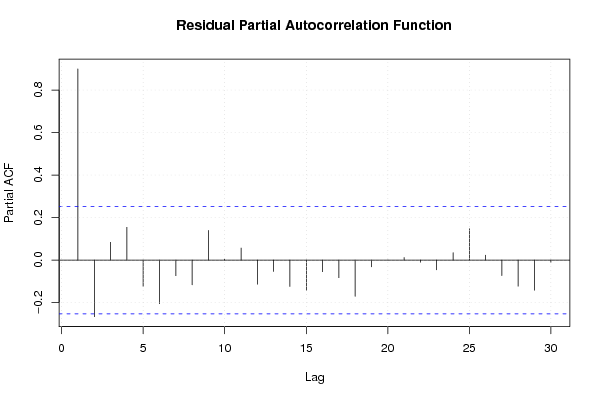
| Multiple Linear Regression - Estimated Regression Equation |
| Y[t] = + 105.384112125121 -0.0218733363637488X[t] + 0.244600489110058M1[t] + 0.230600085802714M2[t] + 0.225163812858891M3[t] + 0.152232065005675M4[t] + 0.0324264484251042M5[t] -0.0535068965189192M6[t] -0.121817038190091M7[t] -0.177502379497611M8[t] -0.126750254077858M9[t] -0.0234371924761798M10[t] + 0.0249370714892171M11[t] + 0.0801217433075963t + e[t] |
| Multiple Linear Regression - Ordinary Least Squares | |||||
| Variable | Parameter | S.D. | T-STAT H0: parameter = 0 | 2-tail p-value | 1-tail p-value |
| (Intercept) | 105.384112125121 | 0.428976 | 245.6646 | 0 | 0 |
| X | -0.0218733363637488 | 0.005622 | -3.8909 | 0.00032 | 0.00016 |
| M1 | 0.244600489110058 | 0.229863 | 1.0641 | 0.292831 | 0.146416 |
| M2 | 0.230600085802714 | 0.230516 | 1.0004 | 0.322366 | 0.161183 |
| M3 | 0.225163812858891 | 0.230118 | 0.9785 | 0.332959 | 0.166479 |
| M4 | 0.152232065005675 | 0.227147 | 0.6702 | 0.506086 | 0.253043 |
| M5 | 0.0324264484251042 | 0.225045 | 0.1441 | 0.88606 | 0.44303 |
| M6 | -0.0535068965189192 | 0.224536 | -0.2383 | 0.812707 | 0.406353 |
| M7 | -0.121817038190091 | 0.224374 | -0.5429 | 0.589807 | 0.294903 |
| M8 | -0.177502379497611 | 0.224306 | -0.7913 | 0.432808 | 0.216404 |
| M9 | -0.126750254077858 | 0.224325 | -0.565 | 0.574798 | 0.287399 |
| M10 | -0.0234371924761798 | 0.224171 | -0.1046 | 0.917187 | 0.458593 |
| M11 | 0.0249370714892171 | 0.223977 | 0.1113 | 0.911833 | 0.455916 |
| t | 0.0801217433075963 | 0.007817 | 10.2496 | 0 | 0 |
| Multiple Linear Regression - Regression Statistics | |
| Multiple R | 0.946332492074222 |
| R-squared | 0.895545185555408 |
| Adjusted R-squared | 0.866025346690632 |
| F-TEST (value) | 30.3370621248209 |
| F-TEST (DF numerator) | 13 |
| F-TEST (DF denominator) | 46 |
| p-value | 0 |
| Multiple Linear Regression - Residual Statistics | |
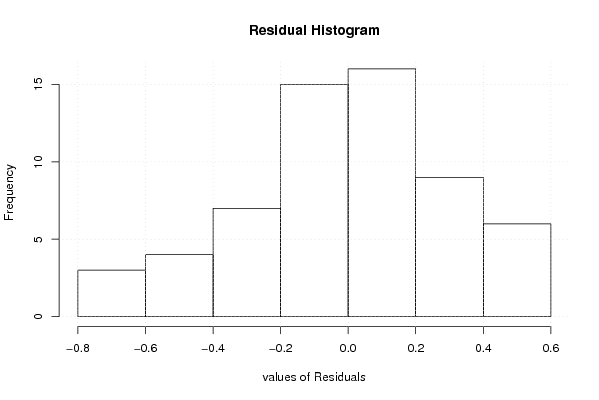
| Residual Standard Deviation | 0.354095200960798 |
| Sum Squared Residuals | 5.76763692179953 |
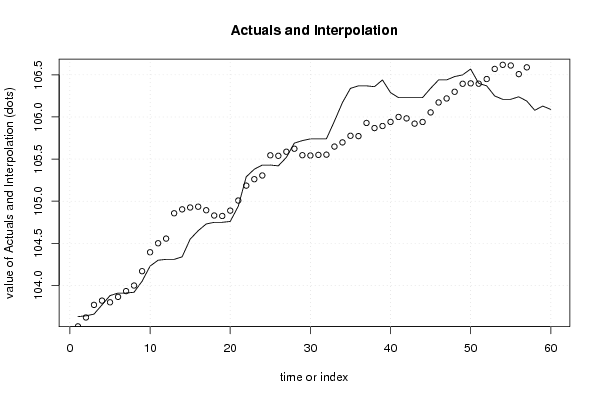
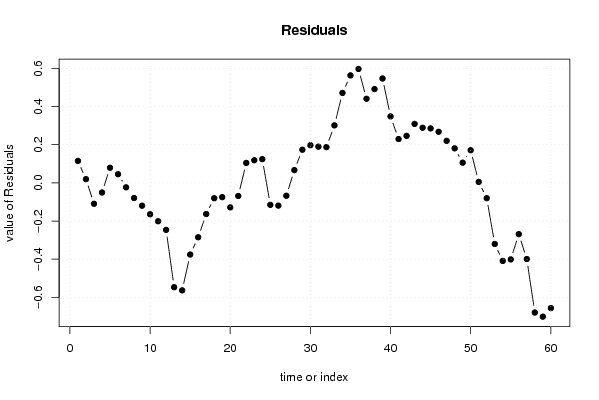
| Multiple Linear Regression - Actuals, Interpolation, and Residuals | |||
| Time or Index | Actuals | Interpolation Forecast | Residuals Prediction Error |
| 1 | 103.63 | 103.514938720255 | 0.115061279744937 |
| 2 | 103.64 | 103.62043206571 | 0.0195679342899749 |
| 3 | 103.66 | 103.769486879711 | -0.109486879710544 |
| 4 | 103.77 | 103.820423547892 | -0.0504235478924228 |
| 5 | 103.88 | 103.800425677347 | 0.0795743226531766 |
| 6 | 103.91 | 103.864608752074 | 0.0453912479256085 |
| 7 | 103.91 | 103.933291028257 | -0.0232910282565623 |
| 8 | 103.92 | 103.999286769348 | -0.0792867693477565 |
| 9 | 104.05 | 104.169532643530 | -0.119532643529858 |
| 10 | 104.23 | 104.394526787530 | -0.164526787530249 |
| 11 | 104.3 | 104.501149458439 | -0.201149458439500 |
| 12 | 104.31 | 104.556334130258 | -0.246334130257874 |
| 13 | 104.31 | 104.856995692675 | -0.546995692675405 |
| 14 | 104.34 | 104.903431029948 | -0.563431029948282 |
| 15 | 104.55 | 104.925620493039 | -0.375620493039064 |
| 16 | 104.65 | 104.934997822130 | -0.284997822129811 |
| 17 | 104.73 | 104.893126615220 | -0.163126615220464 |
| 18 | 104.75 | 104.830444339038 | -0.0804443390382939 |
| 19 | 104.75 | 104.824757271584 | -0.0747572715837193 |
| 20 | 104.76 | 104.888565679039 | -0.128565679038538 |
| 21 | 104.94 | 105.008502879584 | -0.0685028795840206 |
| 22 | 105.29 | 105.185375683584 | 0.104624316415838 |
| 23 | 105.38 | 105.261375683584 | 0.118624316415831 |
| 24 | 105.43 | 105.305623687221 | 0.124376312779338 |
| 25 | 105.43 | 105.545039907820 | -0.115039907819696 |
| 26 | 105.42 | 105.538979237820 | -0.118979237819582 |
| 27 | 105.52 | 105.587416704547 | -0.0674167045468627 |
| 28 | 105.69 | 105.623042037274 | 0.0669579627258855 |
| 29 | 105.72 | 105.546173492183 | 0.173826507817234 |
| 30 | 105.74 | 105.542549224183 | 0.197450775817281 |
| 31 | 105.74 | 105.549986158546 | 0.190013841453607 |
| 32 | 105.74 | 105.552549224183 | 0.187450775817279 |
| 33 | 105.95 | 105.648425754728 | 0.301574245271936 |
| 34 | 106.17 | 105.698433207818 | 0.471566792181528 |
| 35 | 106.34 | 105.776620541455 | 0.563379458545159 |
| 36 | 106.37 | 105.772747205091 | 0.597252794908903 |
| 37 | 106.37 | 105.929044747508 | 0.440955252492114 |
| 38 | 106.36 | 105.868300736598 | 0.4916992634016 |
| 39 | 106.44 | 105.892677533326 | 0.547322466674447 |
| 40 | 106.29 | 105.941426867871 | 0.348573132128953 |
| 41 | 106.23 | 106.000173008235 | 0.229826991765055 |
| 42 | 106.23 | 105.983424738417 | 0.246575261583356 |
| 43 | 106.23 | 105.920866996416 | 0.309133003583678 |
| 44 | 106.23 | 105.940928731144 | 0.289071268856351 |
| 45 | 106.34 | 106.05430393078 | 0.285696069220001 |
| 46 | 106.44 | 106.172118726598 | 0.267881273401967 |
| 47 | 106.44 | 106.219683389325 | 0.220316610674844 |
| 48 | 106.48 | 106.298928731144 | 0.181071268856347 |
| 49 | 106.5 | 106.393980931742 | 0.106019068258051 |
| 50 | 106.57 | 106.398856929924 | 0.171143070076289 |
| 51 | 106.4 | 106.394798389378 | 0.00520161062202413 |
| 52 | 106.37 | 106.450109724833 | -0.0801097248326048 |
| 53 | 106.25 | 106.570101207015 | -0.320101207015001 |
| 54 | 106.21 | 106.618972946288 | -0.408972946287952 |
| 55 | 106.21 | 106.611098545197 | -0.401098545197003 |
| 56 | 106.24 | 106.508669596287 | -0.268669596287335 |
| 57 | 106.19 | 106.589234791378 | -0.399234791378059 |
| 58 | 106.08 | 106.759545594469 | -0.679545594469084 |
| 59 | 106.13 | 106.831170927196 | -0.701170927196333 |
| 60 | 106.09 | 106.746366246287 | -0.656366246286713 |
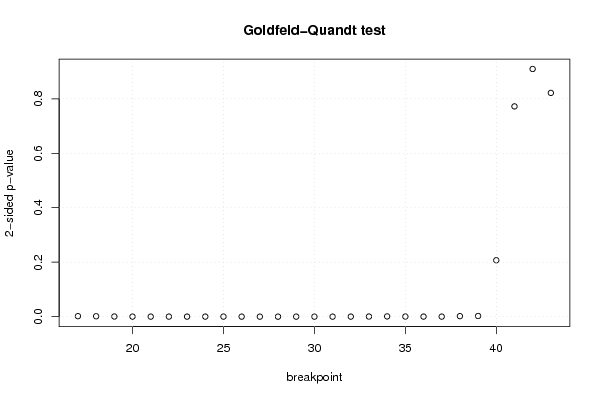
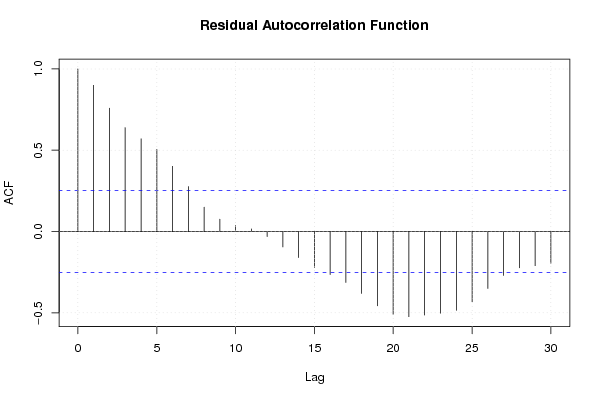
| Goldfeld-Quandt test for Heteroskedasticity | |||
| p-values | Alternative Hypothesis | ||
| breakpoint index | greater | 2-sided | less |
| 17 | 0.000926487593250345 | 0.00185297518650069 | 0.99907351240675 |
| 18 | 0.000718944203333576 | 0.00143788840666715 | 0.999281055796666 |
| 19 | 0.000267722590581001 | 0.000535445181162002 | 0.99973227740942 |
| 20 | 9.2853734916939e-05 | 0.000185707469833878 | 0.999907146265083 |
| 21 | 4.0045636405382e-05 | 8.0091272810764e-05 | 0.999959954363595 |
| 22 | 7.96863741772666e-05 | 0.000159372748354533 | 0.999920313625823 |
| 23 | 9.244198643709e-05 | 0.00018488397287418 | 0.999907558013563 |
| 24 | 0.000104825745843488 | 0.000209651491686976 | 0.999895174254157 |
| 25 | 6.00862444275754e-05 | 0.000120172488855151 | 0.999939913755572 |
| 26 | 4.11709076914053e-05 | 8.23418153828106e-05 | 0.999958829092309 |
| 27 | 2.36608871637106e-05 | 4.73217743274212e-05 | 0.999976339112836 |
| 28 | 7.06042901135717e-06 | 1.41208580227143e-05 | 0.999992939570989 |
| 29 | 7.48143811504224e-06 | 1.49628762300845e-05 | 0.999992518561885 |
| 30 | 1.12455887008689e-05 | 2.24911774017378e-05 | 0.9999887544113 |
| 31 | 1.95369197468025e-05 | 3.9073839493605e-05 | 0.999980463080253 |
| 32 | 9.78413309471307e-05 | 0.000195682661894261 | 0.999902158669053 |
| 33 | 0.000190334082785605 | 0.000380668165571209 | 0.999809665917214 |
| 34 | 0.00048622725510548 | 0.00097245451021096 | 0.999513772744895 |
| 35 | 0.000199870390410695 | 0.000399740780821389 | 0.99980012960959 |
| 36 | 7.96908023918756e-05 | 0.000159381604783751 | 0.999920309197608 |
| 37 | 0.000101429669203049 | 0.000202859338406098 | 0.999898570330797 |
| 38 | 0.000906373186333997 | 0.00181274637266799 | 0.999093626813666 |
| 39 | 0.00122897425681743 | 0.00245794851363486 | 0.998771025743183 |
| 40 | 0.103568557549696 | 0.207137115099392 | 0.896431442450304 |
| 41 | 0.386161505743746 | 0.772323011487491 | 0.613838494256254 |
| 42 | 0.454878388647269 | 0.909756777294538 | 0.545121611352731 |
| 43 | 0.410918967735617 | 0.821837935471234 | 0.589081032264383 |
| Meta Analysis of Goldfeld-Quandt test for Heteroskedasticity | |||
| Description | # significant tests | % significant tests | OK/NOK |
| 1% type I error level | 23 | 0.851851851851852 | NOK |
| 5% type I error level | 23 | 0.851851851851852 | NOK |
| 10% type I error level | 23 | 0.851851851851852 | NOK |