| Multiple Linear Regression - Estimated Regression Equation |
| Y[t] = -2.83103972160239 -0.00497969791234237X[t] + 0.932713845855733Y1[t] -0.0849261973825332Y2[t] -0.295020473860288Y3[t] + 0.179390247778269Y4[t] + 0.299672934182992`Y5 `[t] + 0.066291966934211M1[t] + 0.070275643501231M2[t] + 0.0678099255876927M3[t] + 0.155510564164373M4[t] + 0.181984794020036M5[t] + 0.128406954400737M6[t] + 0.123356529101140M7[t] + 0.144114792469188M8[t] + 0.102750256297642M9[t] + 0.080114755808093M10[t] + 0.0357874509842374M11[t] -0.000149240410139286t + e[t] |
| Multiple Linear Regression - Ordinary Least Squares | |||||
| Variable | Parameter | S.D. | T-STAT H0: parameter = 0 | 2-tail p-value | 1-tail p-value |
| (Intercept) | -2.83103972160239 | 4.34225 | -0.652 | 0.518558 | 0.259279 |
| X | -0.00497969791234237 | 0.001643 | -3.0301 | 0.004506 | 0.002253 |
| Y1 | 0.932713845855733 | 0.157745 | 5.9128 | 1e-06 | 0 |
| Y2 | -0.0849261973825332 | 0.224609 | -0.3781 | 0.707572 | 0.353786 |
| Y3 | -0.295020473860288 | 0.243782 | -1.2102 | 0.234096 | 0.117048 |
| Y4 | 0.179390247778269 | 0.239424 | 0.7493 | 0.458569 | 0.229285 |
| `Y5 ` | 0.299672934182992 | 0.185883 | 1.6122 | 0.115661 | 0.057831 |
| M1 | 0.066291966934211 | 0.049712 | 1.3335 | 0.190735 | 0.095367 |
| M2 | 0.070275643501231 | 0.051292 | 1.3701 | 0.179141 | 0.089571 |
| M3 | 0.0678099255876927 | 0.050229 | 1.35 | 0.185442 | 0.092721 |
| M4 | 0.155510564164373 | 0.048629 | 3.1979 | 0.002883 | 0.001442 |
| M5 | 0.181984794020036 | 0.051174 | 3.5562 | 0.001076 | 0.000538 |
| M6 | 0.128406954400737 | 0.053728 | 2.3899 | 0.022209 | 0.011104 |
| M7 | 0.123356529101140 | 0.055083 | 2.2395 | 0.031396 | 0.015698 |
| M8 | 0.144114792469188 | 0.065772 | 2.1911 | 0.034997 | 0.017499 |
| M9 | 0.102750256297642 | 0.061791 | 1.6629 | 0.105024 | 0.052512 |
| M10 | 0.080114755808093 | 0.051751 | 1.5481 | 0.130347 | 0.065174 |
| M11 | 0.0357874509842374 | 0.050554 | 0.7079 | 0.483566 | 0.241783 |
| t | -0.000149240410139286 | 0.003603 | -0.0414 | 0.967193 | 0.483596 |
| Multiple Linear Regression - Regression Statistics | |
| Multiple R | 0.997724269607044 |
| R-squared | 0.99545371816291 |
| Adjusted R-squared | 0.993180577244363 |
| F-TEST (value) | 437.919932742148 |
| F-TEST (DF numerator) | 18 |
| F-TEST (DF denominator) | 36 |
| p-value | 0 |
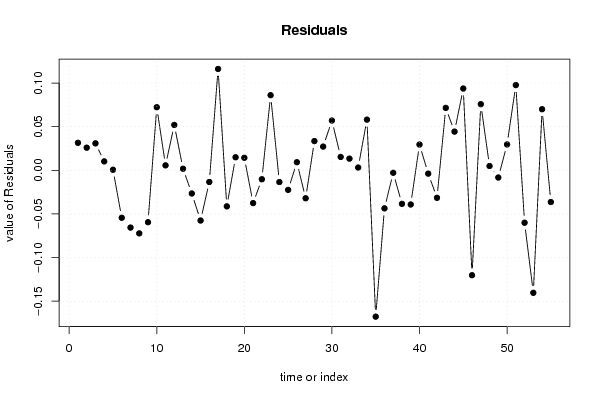
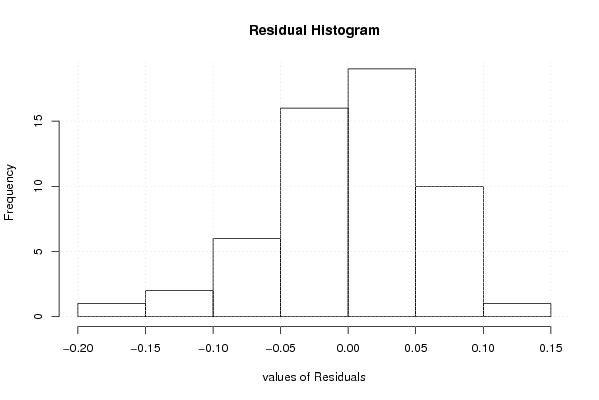
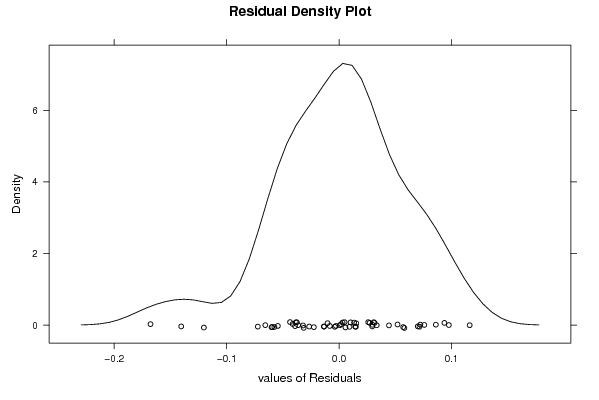
| Multiple Linear Regression - Residual Statistics | |
| Residual Standard Deviation | 0.0701871577428226 |
| Sum Squared Residuals | 0.177344536032571 |
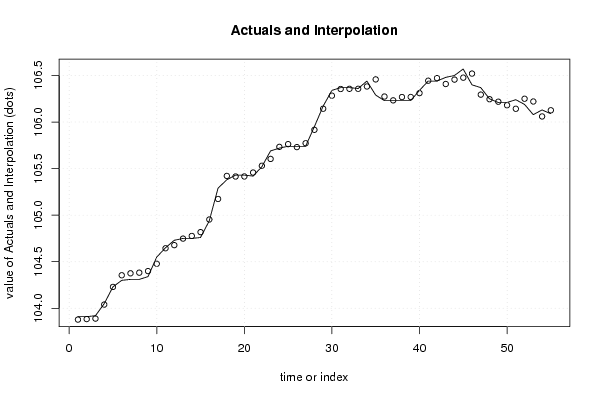
| Multiple Linear Regression - Actuals, Interpolation, and Residuals | |||
| Time or Index | Actuals | Interpolation Forecast | Residuals Prediction Error |
| 1 | 103.91 | 103.878451238188 | 0.0315487618122744 |
| 2 | 103.91 | 103.884020946423 | 0.0259790535770017 |
| 3 | 103.92 | 103.889063308894 | 0.0309366911055615 |
| 4 | 104.05 | 104.039747577144 | 0.0102524228558393 |
| 5 | 104.23 | 104.229303562892 | 0.000696437108322132 |
| 6 | 104.3 | 104.354399586063 | -0.0543995860629370 |
| 7 | 104.31 | 104.375591629482 | -0.0655916294822722 |
| 8 | 104.31 | 104.382258159374 | -0.0722581593735686 |
| 9 | 104.34 | 104.399454869934 | -0.0594548699339316 |
| 10 | 104.55 | 104.477661211202 | 0.0723387887978133 |
| 11 | 104.65 | 104.644298097635 | 0.00570190236534622 |
| 12 | 104.73 | 104.677944404502 | 0.0520555954984488 |
| 13 | 104.75 | 104.748161359175 | 0.00183864082505709 |
| 14 | 104.75 | 104.776534341010 | -0.0265343410101180 |
| 15 | 104.76 | 104.817538286797 | -0.0575382867965953 |
| 16 | 104.94 | 104.953332896976 | -0.0133328969762984 |
| 17 | 105.29 | 105.173760786601 | 0.116239213399018 |
| 18 | 105.38 | 105.421292876465 | -0.0412928764651777 |
| 19 | 105.43 | 105.415019746652 | 0.0149802533483907 |
| 20 | 105.43 | 105.415614368471 | 0.0143856315290806 |
| 21 | 105.42 | 105.457540305292 | -0.0375403052918494 |
| 22 | 105.52 | 105.530214142131 | -0.0102141421309762 |
| 23 | 105.69 | 105.603847044932 | 0.086152955067867 |
| 24 | 105.72 | 105.733423090087 | -0.0134230900865648 |
| 25 | 105.74 | 105.762393006709 | -0.0223930067093367 |
| 26 | 105.74 | 105.730689745631 | 0.00931025436913267 |
| 27 | 105.74 | 105.772013647190 | -0.0320136471895232 |
| 28 | 105.95 | 105.916464349409 | 0.033535650590646 |
| 29 | 106.17 | 106.142771753015 | 0.0272282469853371 |
| 30 | 106.34 | 106.282898646098 | 0.0571013539019569 |
| 31 | 106.37 | 106.354626331666 | 0.0153736683335060 |
| 32 | 106.37 | 106.356567066317 | 0.0134329336831226 |
| 33 | 106.36 | 106.356781677287 | 0.00321832271262681 |
| 34 | 106.44 | 106.381867414091 | 0.0581325859094093 |
| 35 | 106.29 | 106.457730039545 | -0.167730039544940 |
| 36 | 106.23 | 106.273587383882 | -0.0435873838823813 |
| 37 | 106.23 | 106.232766994951 | -0.00276699495084360 |
| 38 | 106.23 | 106.268422316619 | -0.0384223166185613 |
| 39 | 106.23 | 106.269120579096 | -0.0391205790960142 |
| 40 | 106.34 | 106.310419048302 | 0.0295809516981365 |
| 41 | 106.44 | 106.443770825346 | -0.00377082534608349 |
| 42 | 106.44 | 106.471483399234 | -0.0314833992339631 |
| 43 | 106.48 | 106.408407888759 | 0.0715921112406273 |
| 44 | 106.5 | 106.455560405839 | 0.0444395941613654 |
| 45 | 106.57 | 106.476223147487 | 0.0937768525131542 |
| 46 | 106.4 | 106.520257232576 | -0.120257232576246 |
| 47 | 106.37 | 106.294124817888 | 0.0758751821117265 |
| 48 | 106.25 | 106.245045121530 | 0.00495487847049753 |
| 49 | 106.21 | 106.218227400977 | -0.00822740097715119 |
| 50 | 106.21 | 106.180332650317 | 0.0296673496825448 |
| 51 | 106.24 | 106.142264178023 | 0.0977358219765712 |
| 52 | 106.19 | 106.250036128168 | -0.0600361281683234 |
| 53 | 106.08 | 106.220393072147 | -0.140393072146593 |
| 54 | 106.13 | 106.059925492140 | 0.0700745078601208 |
| 55 | 106.09 | 106.126354403440 | -0.0363544034402519 |
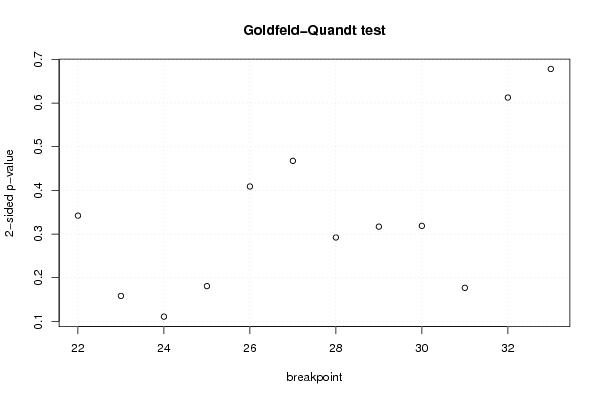
| Goldfeld-Quandt test for Heteroskedasticity | |||
| p-values | Alternative Hypothesis | ||
| breakpoint index | greater | 2-sided | less |
| 22 | 0.171047795996972 | 0.342095591993943 | 0.828952204003028 |
| 23 | 0.0790724928354266 | 0.158144985670853 | 0.920927507164573 |
| 24 | 0.0553682055472368 | 0.110736411094474 | 0.944631794452763 |
| 25 | 0.0903657768176242 | 0.180731553635248 | 0.909634223182376 |
| 26 | 0.204462626340326 | 0.408925252680652 | 0.795537373659674 |
| 27 | 0.233771117010724 | 0.467542234021448 | 0.766228882989276 |
| 28 | 0.146088471827494 | 0.292176943654988 | 0.853911528172506 |
| 29 | 0.158435154434980 | 0.316870308869960 | 0.84156484556502 |
| 30 | 0.159355091175182 | 0.318710182350364 | 0.840644908824818 |
| 31 | 0.08838058442943 | 0.17676116885886 | 0.91161941557057 |
| 32 | 0.306315355309148 | 0.612630710618297 | 0.693684644690852 |
| 33 | 0.339060398319434 | 0.678120796638869 | 0.660939601680566 |
| Meta Analysis of Goldfeld-Quandt test for Heteroskedasticity | |||
| Description | # significant tests | % significant tests | OK/NOK |
| 1% type I error level | 0 | 0 | OK |
| 5% type I error level | 0 | 0 | OK |
| 10% type I error level | 0 | 0 | OK |