| Multiple Linear Regression - Estimated Regression Equation |
| Wkz[t] = + 8.58467027907636 -0.234871558766587Ncp[t] + e[t] |
| Multiple Linear Regression - Ordinary Least Squares | |||||
| Variable | Parameter | S.D. | T-STAT H0: parameter = 0 | 2-tail p-value | 1-tail p-value |
| (Intercept) | 8.58467027907636 | 0.196948 | 43.5885 | 0 | 0 |
| Ncp | -0.234871558766587 | 0.071289 | -3.2946 | 0.00167 | 0.000835 |
| Multiple Linear Regression - Regression Statistics | |
| Multiple R | 0.394193156871283 |
| R-squared | 0.155388244924148 |
| Adjusted R-squared | 0.141072791448286 |
| F-TEST (value) | 10.8545806939443 |
| F-TEST (DF numerator) | 1 |
| F-TEST (DF denominator) | 59 |
| p-value | 0.00167001030035618 |
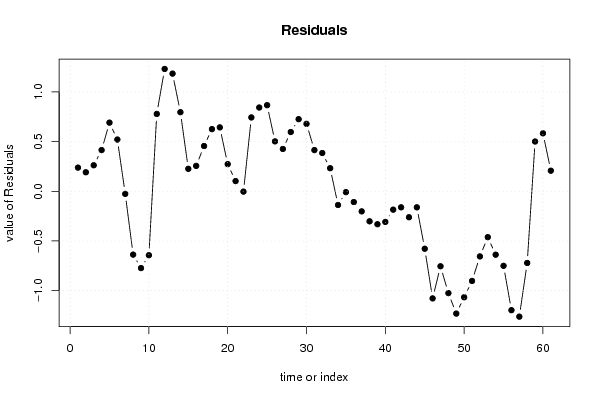
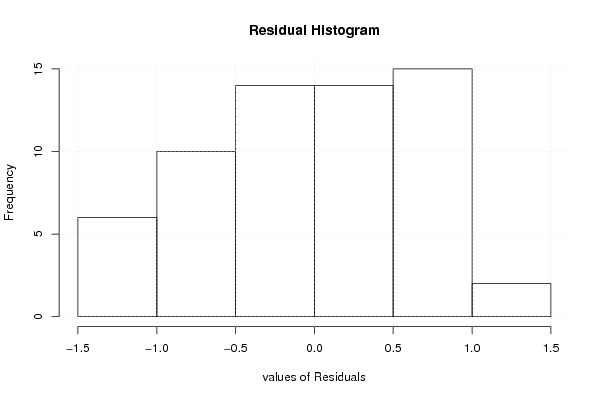
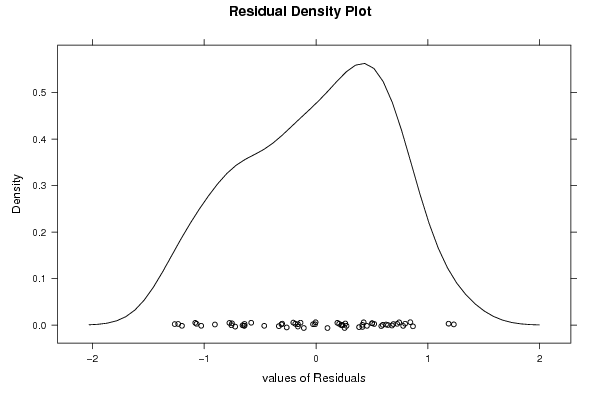
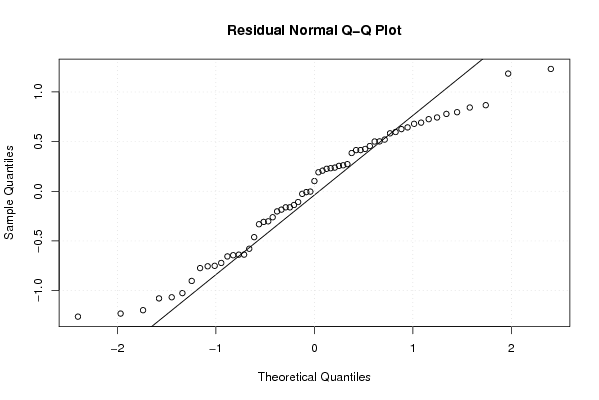
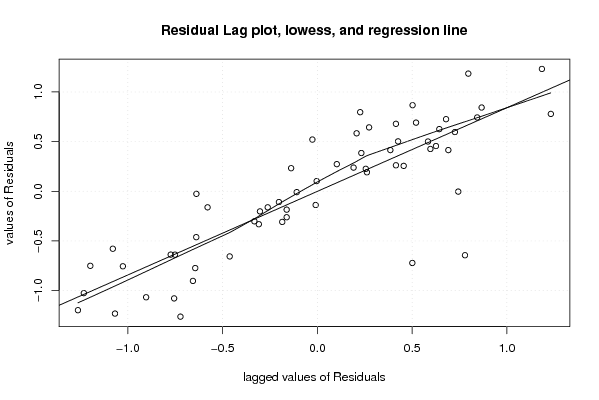
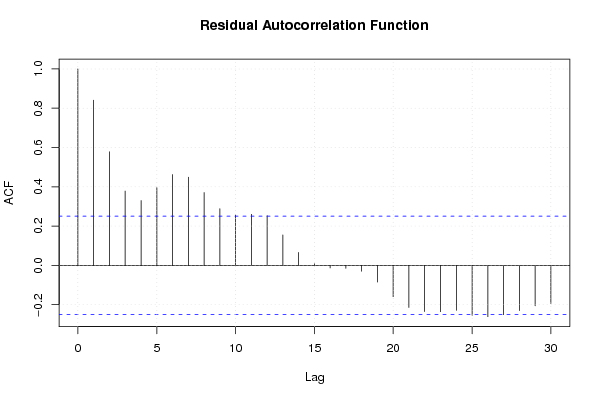
| Multiple Linear Regression - Residual Statistics | |
| Residual Standard Deviation | 0.650724001888195 |
| Sum Squared Residuals | 24.9830618713699 |
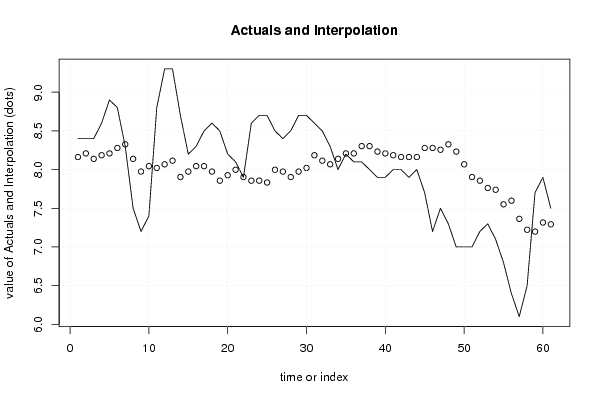
| Multiple Linear Regression - Actuals, Interpolation, and Residuals | |||
| Time or Index | Actuals | Interpolation Forecast | Residuals Prediction Error |
| 1 | 8.4 | 8.16190147329647 | 0.238098526703529 |
| 2 | 8.4 | 8.20887578504982 | 0.191124214950182 |
| 3 | 8.4 | 8.13841431741984 | 0.261585682580157 |
| 4 | 8.6 | 8.18538862917316 | 0.414611370826839 |
| 5 | 8.9 | 8.20887578504982 | 0.691124214950181 |
| 6 | 8.8 | 8.2793372526798 | 0.520662747320206 |
| 7 | 8.3 | 8.32631156443311 | -0.0263115644331116 |
| 8 | 7.5 | 8.13841431741984 | -0.638414317419843 |
| 9 | 7.2 | 7.97400422628323 | -0.774004226283232 |
| 10 | 7.4 | 8.0444656939132 | -0.644465693913208 |
| 11 | 8.8 | 8.02097853803655 | 0.779021461963451 |
| 12 | 9.3 | 8.06795284978987 | 1.23204715021013 |
| 13 | 9.3 | 8.11492716154318 | 1.18507283845682 |
| 14 | 8.7 | 7.90354275865326 | 0.796457241346743 |
| 15 | 8.2 | 7.97400422628323 | 0.225995773716767 |
| 16 | 8.3 | 8.0444656939132 | 0.255534306086792 |
| 17 | 8.5 | 8.0444656939132 | 0.455534306086792 |
| 18 | 8.6 | 7.97400422628323 | 0.625995773716767 |
| 19 | 8.5 | 7.85656844689994 | 0.643431553100061 |
| 20 | 8.2 | 7.92702991452992 | 0.272970085470084 |
| 21 | 8.1 | 7.99749138215989 | 0.102508617840109 |
| 22 | 7.9 | 7.90354275865326 | -0.00354275865325595 |
| 23 | 8.6 | 7.85656844689994 | 0.743431553100061 |
| 24 | 8.7 | 7.85656844689994 | 0.84343155310006 |
| 25 | 8.7 | 7.83308129102328 | 0.866918708976719 |
| 26 | 8.5 | 7.99749138215989 | 0.502508617840109 |
| 27 | 8.4 | 7.97400422628323 | 0.425995773716768 |
| 28 | 8.5 | 7.90354275865326 | 0.596457241346744 |
| 29 | 8.7 | 7.97400422628323 | 0.725995773716767 |
| 30 | 8.7 | 8.02097853803655 | 0.67902146196345 |
| 31 | 8.6 | 8.18538862917316 | 0.414611370826839 |
| 32 | 8.5 | 8.11492716154318 | 0.385072838456816 |
| 33 | 8.3 | 8.06795284978987 | 0.232047150210134 |
| 34 | 8 | 8.13841431741984 | -0.138414317419843 |
| 35 | 8.2 | 8.20887578504982 | -0.00887578504981967 |
| 36 | 8.1 | 8.20887578504982 | -0.108875785049819 |
| 37 | 8.1 | 8.30282440855645 | -0.202824408556454 |
| 38 | 8 | 8.30282440855645 | -0.302824408556454 |
| 39 | 7.9 | 8.23236294092648 | -0.332362940926477 |
| 40 | 7.9 | 8.20887578504982 | -0.308875785049819 |
| 41 | 8 | 8.18538862917316 | -0.185388629173160 |
| 42 | 8 | 8.1619014732965 | -0.161901473296502 |
| 43 | 7.9 | 8.1619014732965 | -0.261901473296501 |
| 44 | 8 | 8.1619014732965 | -0.161901473296502 |
| 45 | 7.7 | 8.2793372526798 | -0.579337252679795 |
| 46 | 7.2 | 8.2793372526798 | -1.07933725267979 |
| 47 | 7.5 | 8.25585009680314 | -0.755850096803136 |
| 48 | 7.3 | 8.32631156443311 | -1.02631156443311 |
| 49 | 7 | 8.23236294092648 | -1.23236294092648 |
| 50 | 7 | 8.06795284978987 | -1.06795284978987 |
| 51 | 7 | 7.90354275865326 | -0.903542758653256 |
| 52 | 7.2 | 7.85656844689994 | -0.656568446899939 |
| 53 | 7.3 | 7.76261982339330 | -0.462619823393304 |
| 54 | 7.1 | 7.73913266751665 | -0.639132667516646 |
| 55 | 6.8 | 7.55123542050338 | -0.751235420503376 |
| 56 | 6.4 | 7.59820973225669 | -1.19820973225669 |
| 57 | 6.1 | 7.3633381734901 | -1.26333817349011 |
| 58 | 6.5 | 7.22241523823015 | -0.722415238230155 |
| 59 | 7.7 | 7.1989280823535 | 0.501071917646504 |
| 60 | 7.9 | 7.31636386173679 | 0.583636138263211 |
| 61 | 7.5 | 7.29287670586013 | 0.207123294139869 |
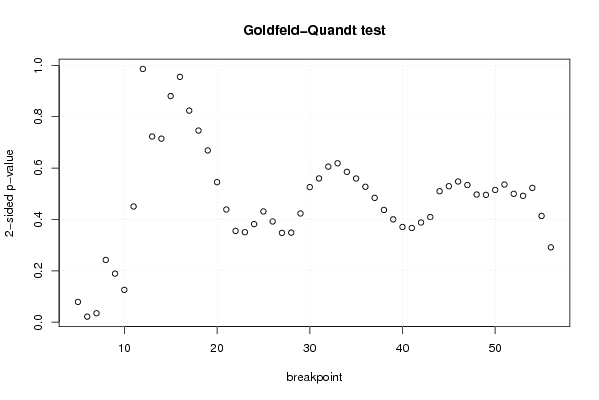
| Goldfeld-Quandt test for Heteroskedasticity | |||
| p-values | Alternative Hypothesis | ||
| breakpoint index | greater | 2-sided | less |
| 5 | 0.0394739395341962 | 0.0789478790683925 | 0.960526060465804 |
| 6 | 0.0108272733840216 | 0.0216545467680432 | 0.989172726615978 |
| 7 | 0.0174633722995655 | 0.034926744599131 | 0.982536627700434 |
| 8 | 0.121195660516483 | 0.242391321032967 | 0.878804339483517 |
| 9 | 0.0945788324709313 | 0.189157664941863 | 0.905421167529069 |
| 10 | 0.0629438224275462 | 0.125887644855092 | 0.937056177572454 |
| 11 | 0.225139074124868 | 0.450278148249737 | 0.774860925875132 |
| 12 | 0.492845817818871 | 0.985691635637742 | 0.507154182181129 |
| 13 | 0.638617261973673 | 0.722765476052655 | 0.361382738026327 |
| 14 | 0.642791055090013 | 0.714417889819975 | 0.357208944909987 |
| 15 | 0.559908122143191 | 0.880183755713619 | 0.440091877856809 |
| 16 | 0.477390556527811 | 0.954781113055623 | 0.522609443472189 |
| 17 | 0.411741204826039 | 0.823482409652078 | 0.588258795173961 |
| 18 | 0.372930284589857 | 0.745860569179714 | 0.627069715410143 |
| 19 | 0.334326447328995 | 0.668652894657991 | 0.665673552671005 |
| 20 | 0.272555981828313 | 0.545111963656626 | 0.727444018171687 |
| 21 | 0.21935663416516 | 0.43871326833032 | 0.78064336583484 |
| 22 | 0.177690055475781 | 0.355380110951563 | 0.822309944524219 |
| 23 | 0.175152789279385 | 0.350305578558769 | 0.824847210720615 |
| 24 | 0.190882650620015 | 0.381765301240031 | 0.809117349379985 |
| 25 | 0.215518518704149 | 0.431037037408297 | 0.784481481295851 |
| 26 | 0.196004180339066 | 0.392008360678133 | 0.803995819660934 |
| 27 | 0.173856948337622 | 0.347713896675243 | 0.826143051662378 |
| 28 | 0.174343745755977 | 0.348687491511954 | 0.825656254244023 |
| 29 | 0.211612417332106 | 0.423224834664211 | 0.788387582667894 |
| 30 | 0.262885044895188 | 0.525770089790376 | 0.737114955104812 |
| 31 | 0.279843156773846 | 0.559686313547692 | 0.720156843226154 |
| 32 | 0.302746828384383 | 0.605493656768767 | 0.697253171615617 |
| 33 | 0.309319782415104 | 0.618639564830208 | 0.690680217584896 |
| 34 | 0.292650828746143 | 0.585301657492286 | 0.707349171253857 |
| 35 | 0.279648448215031 | 0.559296896430062 | 0.720351551784969 |
| 36 | 0.263581695903248 | 0.527163391806495 | 0.736418304096752 |
| 37 | 0.241974365517346 | 0.483948731034692 | 0.758025634482654 |
| 38 | 0.218510365376641 | 0.437020730753282 | 0.781489634623359 |
| 39 | 0.200195021799693 | 0.400390043599387 | 0.799804978200307 |
| 40 | 0.185286453555532 | 0.370572907111064 | 0.814713546444468 |
| 41 | 0.183428467917080 | 0.366856935834160 | 0.81657153208292 |
| 42 | 0.193967272184459 | 0.387934544368918 | 0.806032727815541 |
| 43 | 0.204661404221285 | 0.409322808442571 | 0.795338595778715 |
| 44 | 0.254866244735241 | 0.509732489470482 | 0.745133755264759 |
| 45 | 0.264702402120151 | 0.529404804240302 | 0.735297597879849 |
| 46 | 0.273851315272699 | 0.547702630545399 | 0.7261486847273 |
| 47 | 0.266932786857020 | 0.533865573714041 | 0.73306721314298 |
| 48 | 0.248462627022887 | 0.496925254045774 | 0.751537372977113 |
| 49 | 0.247782112116358 | 0.495564224232716 | 0.752217887883642 |
| 50 | 0.257375173727176 | 0.514750347454352 | 0.742624826272824 |
| 51 | 0.26790782643795 | 0.5358156528759 | 0.73209217356205 |
| 52 | 0.249846343515269 | 0.499692687030538 | 0.750153656484731 |
| 53 | 0.245913381543604 | 0.491826763087208 | 0.754086618456396 |
| 54 | 0.261405589490701 | 0.522811178981402 | 0.738594410509299 |
| 55 | 0.206818152727043 | 0.413636305454085 | 0.793181847272957 |
| 56 | 0.145685395684859 | 0.291370791369719 | 0.85431460431514 |
| Meta Analysis of Goldfeld-Quandt test for Heteroskedasticity | |||
| Description | # significant tests | % significant tests | OK/NOK |
| 1% type I error level | 0 | 0 | OK |
| 5% type I error level | 2 | 0.0384615384615385 | OK |
| 10% type I error level | 3 | 0.0576923076923077 | OK |