| Multiple Linear Regression - Estimated Regression Equation |
| uitvoer[t] = -8033.86813731782 + 255.273412361827indproc[t] + 600.65077261152M1[t] + 5343.71594368815M2[t] + 489.803888705864M3[t] + 1407.01190144279M4[t] + 1138.02594128105M5[t] + 1087.38340364584M6[t] + 1344.43658319079M7[t] + 1480.38463826929M8[t] + 974.791939749771M9[t] + 794.13568831353M10[t] + 182.325658722537M11[t] -36.6871507608812t + e[t] |
| Multiple Linear Regression - Ordinary Least Squares | |||||
| Variable | Parameter | S.D. | T-STAT H0: parameter = 0 | 2-tail p-value | 1-tail p-value |
| (Intercept) | -8033.86813731782 | 1983.559289 | -4.0502 | 0.000195 | 9.7e-05 |
| indproc | 255.273412361827 | 17.075623 | 14.9496 | 0 | 0 |
| M1 | 600.65077261152 | 564.907159 | 1.0633 | 0.293208 | 0.146604 |
| M2 | 5343.71594368815 | 669.637828 | 7.98 | 0 | 0 |
| M3 | 489.803888705864 | 491.151655 | 0.9973 | 0.323858 | 0.161929 |
| M4 | 1407.01190144279 | 521.930621 | 2.6958 | 0.009776 | 0.004888 |
| M5 | 1138.02594128105 | 518.30722 | 2.1957 | 0.033198 | 0.016599 |
| M6 | 1087.38340364584 | 493.384844 | 2.2039 | 0.032573 | 0.016287 |
| M7 | 1344.43658319079 | 534.116608 | 2.5171 | 0.01538 | 0.00769 |
| M8 | 1480.38463826929 | 543.434556 | 2.7241 | 0.009084 | 0.004542 |
| M9 | 974.791939749771 | 544.989062 | 1.7886 | 0.080259 | 0.040129 |
| M10 | 794.13568831353 | 500.75916 | 1.5859 | 0.119622 | 0.059811 |
| M11 | 182.325658722537 | 487.853199 | 0.3737 | 0.710322 | 0.355161 |
| t | -36.6871507608812 | 5.873454 | -6.2463 | 0 | 0 |
| Multiple Linear Regression - Regression Statistics | |
| Multiple R | 0.94446092820677 |
| R-squared | 0.892006444909194 |
| Adjusted R-squared | 0.86148652716614 |
| F-TEST (value) | 29.2270265083597 |
| F-TEST (DF numerator) | 13 |
| F-TEST (DF denominator) | 46 |
| p-value | 0 |
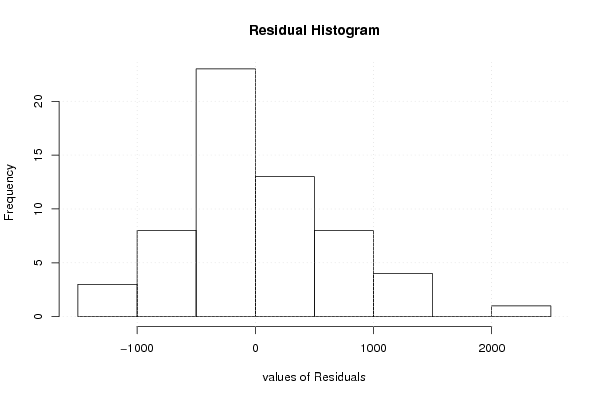
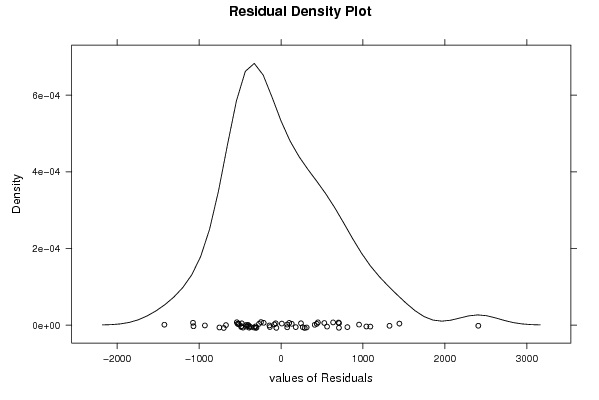
| Multiple Linear Regression - Residual Statistics | |
| Residual Standard Deviation | 771.302682407173 |
| Sum Squared Residuals | 27365760.082871 |
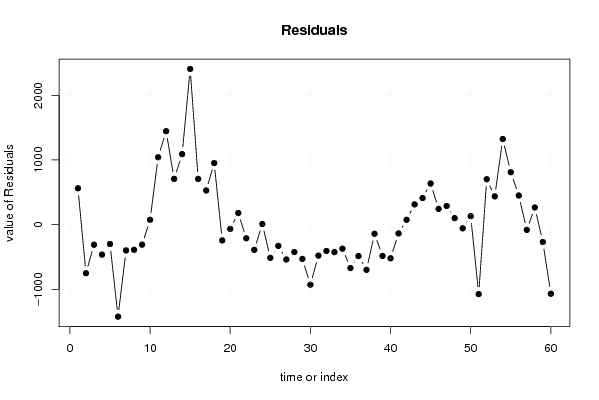
| Multiple Linear Regression - Actuals, Interpolation, and Residuals | |||
| Time or Index | Actuals | Interpolation Forecast | Residuals Prediction Error |
| 1 | 15836.8 | 15274.9565259715 | 561.843474028527 |
| 2 | 17570.4 | 18322.0573659354 | -751.657365935433 |
| 3 | 18252.1 | 18562.453748665 | -310.353748664989 |
| 4 | 16196.7 | 16660.4944158971 | -463.79441589712 |
| 5 | 16643 | 16941.9501534067 | -298.950153406699 |
| 6 | 17729 | 19152.0811762670 | -1423.08117626705 |
| 7 | 16446.1 | 16845.2404226690 | -399.140422669041 |
| 8 | 15993.8 | 16382.8998197906 | -389.099819790635 |
| 9 | 16373.5 | 16683.0222313043 | -309.522231304264 |
| 10 | 17842.2 | 17767.5732321525 | 74.6267678475399 |
| 11 | 22321.5 | 21280.0326732984 | 1041.46732670164 |
| 12 | 22786.7 | 21341.8206174130 | 1444.87938258705 |
| 13 | 18274.1 | 17566.1362291125 | 707.963770887464 |
| 14 | 22392.9 | 21302.4752824533 | 1090.42471754666 |
| 15 | 23899.3 | 21491.8169827105 | 2407.48301728947 |
| 16 | 21343.5 | 20636.4786406261 | 707.021359373852 |
| 17 | 22952.3 | 22424.0475110705 | 528.252488929496 |
| 18 | 21374.4 | 20422.1672299607 | 952.232770039286 |
| 19 | 21164.1 | 21408.3534958303 | -244.253495830269 |
| 20 | 20906.5 | 20971.5402341880 | -65.040234188046 |
| 21 | 17877.4 | 17697.8348726361 | 179.565127363899 |
| 22 | 20664.3 | 20875.6278548513 | -211.327854851277 |
| 23 | 22160 | 22550.1187269920 | -390.118726992027 |
| 24 | 19813.6 | 19803.8991351265 | 9.70086487347598 |
| 25 | 17735.4 | 18249.093434374 | -513.693434373999 |
| 26 | 19640.2 | 19968.7725300564 | -328.572530056371 |
| 27 | 20844.4 | 21383.4266096503 | -539.026609650327 |
| 28 | 19823.1 | 20247.2875139679 | -424.187513967941 |
| 29 | 18594.6 | 19124.7394834875 | -530.139483487471 |
| 30 | 21350.6 | 22279.3821320866 | -928.782132086583 |
| 31 | 18574.1 | 19053.557093986 | -479.457093985995 |
| 32 | 18924.2 | 19331.5093869569 | -407.309386956885 |
| 33 | 17343.4 | 17768.1358882292 | -424.735888229181 |
| 34 | 19961.2 | 20333.2726807760 | -372.072680775973 |
| 35 | 19932.1 | 20603.7597849267 | -671.659784926675 |
| 36 | 19464.6 | 19950.7821744282 | -486.18217442815 |
| 37 | 16165.4 | 16864.3359995047 | -698.935999504667 |
| 38 | 17574.9 | 17716.0854931568 | -141.185493156827 |
| 39 | 19795.4 | 20279.469928379 | -484.069928379002 |
| 40 | 19439.5 | 19960.2057522545 | -520.705752254463 |
| 41 | 17170 | 17306.0172476030 | -136.017247603034 |
| 42 | 21072.4 | 20996.734062162 | 75.6659378380214 |
| 43 | 17751.8 | 17439.0535879910 | 312.746412008982 |
| 44 | 17515.5 | 17104.3496912935 | 411.150308706476 |
| 45 | 18040.3 | 17404.4721028072 | 635.827897192845 |
| 46 | 19090.1 | 18846.4058809619 | 243.694119038091 |
| 47 | 17746.5 | 17457.6158047607 | 288.884195239263 |
| 48 | 19202.1 | 19102.0989055187 | 100.001094481345 |
| 49 | 15141.6 | 15198.7778110373 | -57.1778110373246 |
| 50 | 16258.1 | 16127.1093283980 | 130.990671601967 |
| 51 | 18586.5 | 19660.5327305952 | -1074.03273059515 |
| 52 | 17209.4 | 16507.7336772543 | 701.666322745671 |
| 53 | 17838.7 | 17401.8456044323 | 436.854395567707 |
| 54 | 19123.5 | 17799.5353995237 | 1323.96460047632 |
| 55 | 16583.6 | 15773.4953995237 | 810.104600476323 |
| 56 | 15991.2 | 15540.9008677709 | 450.299132229090 |
| 57 | 16704.4 | 16785.5349050233 | -81.1349050232993 |
| 58 | 17420.4 | 17155.3203512584 | 265.079648741617 |
| 59 | 17872 | 18140.5730100222 | -268.573010022198 |
| 60 | 17823.2 | 18891.5991675137 | -1068.39916751372 |
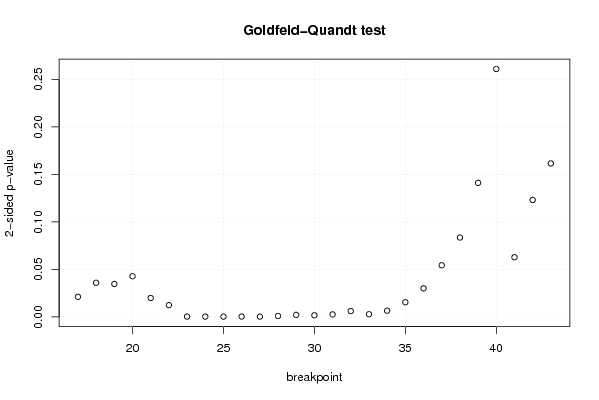
| Goldfeld-Quandt test for Heteroskedasticity | |||
| p-values | Alternative Hypothesis | ||
| breakpoint index | greater | 2-sided | less |
| 17 | 0.989387894912499 | 0.0212242101750023 | 0.0106121050875012 |
| 18 | 0.981985460119762 | 0.036029079760477 | 0.0180145398802385 |
| 19 | 0.982593851436694 | 0.0348122971266124 | 0.0174061485633062 |
| 20 | 0.978553994295268 | 0.0428920114094638 | 0.0214460057047319 |
| 21 | 0.989980493844117 | 0.0200390123117659 | 0.0100195061558830 |
| 22 | 0.993742819385807 | 0.0125143612283855 | 0.00625718061419276 |
| 23 | 0.99979479153886 | 0.000410416922279049 | 0.000205208461139525 |
| 24 | 0.999794342636775 | 0.000411314726450598 | 0.000205657363225299 |
| 25 | 0.999819670186837 | 0.000360659626325472 | 0.000180329813162736 |
| 26 | 0.99974980252476 | 0.000500394950479134 | 0.000250197475239567 |
| 27 | 0.999793502705728 | 0.000412994588543346 | 0.000206497294271673 |
| 28 | 0.999465852474575 | 0.00106829505084922 | 0.00053414752542461 |
| 29 | 0.998874959513717 | 0.00225008097256604 | 0.00112504048628302 |
| 30 | 0.999098481074178 | 0.00180303785164402 | 0.000901518925822008 |
| 31 | 0.998636024097467 | 0.00272795180506660 | 0.00136397590253330 |
| 32 | 0.996886652920194 | 0.00622669415961114 | 0.00311334707980557 |
| 33 | 0.99856802035174 | 0.00286395929651835 | 0.00143197964825917 |
| 34 | 0.996696082892573 | 0.00660783421485377 | 0.00330391710742689 |
| 35 | 0.992238806524734 | 0.0155223869505328 | 0.00776119347526639 |
| 36 | 0.98493348843278 | 0.0301330231344416 | 0.0150665115672208 |
| 37 | 0.972791905523192 | 0.0544161889536159 | 0.0272080944768080 |
| 38 | 0.958184582688477 | 0.0836308346230461 | 0.0418154173115231 |
| 39 | 0.929407983803977 | 0.141184032392045 | 0.0705920161960226 |
| 40 | 0.869461715126432 | 0.261076569747136 | 0.130538284873568 |
| 41 | 0.968539230958926 | 0.0629215380821469 | 0.0314607690410735 |
| 42 | 0.938401665868179 | 0.123196668263643 | 0.0615983341318215 |
| 43 | 0.919199858371093 | 0.161600283257814 | 0.0808001416289071 |
| Meta Analysis of Goldfeld-Quandt test for Heteroskedasticity | |||
| Description | # significant tests | % significant tests | OK/NOK |
| 1% type I error level | 12 | 0.444444444444444 | NOK |
| 5% type I error level | 20 | 0.740740740740741 | NOK |
| 10% type I error level | 23 | 0.851851851851852 | NOK |