| Multiple Linear Regression - Estimated Regression Equation |
| Y[t] = + 8.42354151735435 -0.263310125934268X[t] + 0.456805569775769M1[t] + 0.432604177331831M2[t] + 0.238935189925258M3[t] -0.0400000000000012M4[t] -0.211539367257091M5[t] -0.270474557182349M6[t] + 0.494791645336336M7[t] + 0.563194430224223M8[t] + 0.412662025186853M9[t] + 0.112662025186853M10[t] -0.134733797481316M11[t] + e[t] |
| Multiple Linear Regression - Ordinary Least Squares | |||||
| Variable | Parameter | S.D. | T-STAT H0: parameter = 0 | 2-tail p-value | 1-tail p-value |
| (Intercept) | 8.42354151735435 | 0.36092 | 23.3391 | 0 | 0 |
| X | -0.263310125934268 | 0.076988 | -3.4202 | 0.001304 | 0.000652 |
| M1 | 0.456805569775769 | 0.430801 | 1.0604 | 0.294398 | 0.147199 |
| M2 | 0.432604177331831 | 0.430628 | 1.0046 | 0.320239 | 0.160119 |
| M3 | 0.238935189925258 | 0.430449 | 0.5551 | 0.58147 | 0.290735 |
| M4 | -0.0400000000000012 | 0.430405 | -0.0929 | 0.92635 | 0.463175 |
| M5 | -0.211539367257091 | 0.43087 | -0.491 | 0.62574 | 0.31287 |
| M6 | -0.270474557182349 | 0.4312 | -0.6273 | 0.533524 | 0.266762 |
| M7 | 0.494791645336336 | 0.431296 | 1.1472 | 0.257097 | 0.128549 |
| M8 | 0.563194430224223 | 0.430801 | 1.3073 | 0.197464 | 0.098732 |
| M9 | 0.412662025186853 | 0.43068 | 0.9582 | 0.342883 | 0.171442 |
| M10 | 0.112662025186853 | 0.43068 | 0.2616 | 0.79478 | 0.39739 |
| M11 | -0.134733797481316 | 0.430407 | -0.313 | 0.755637 | 0.377818 |
| Multiple Linear Regression - Regression Statistics | |
| Multiple R | 0.576416949296871 |
| R-squared | 0.332256499436712 |
| Adjusted R-squared | 0.161768797165234 |
| F-TEST (value) | 1.94885903798293 |
| F-TEST (DF numerator) | 12 |
| F-TEST (DF denominator) | 47 |
| p-value | 0.0520596025542661 |
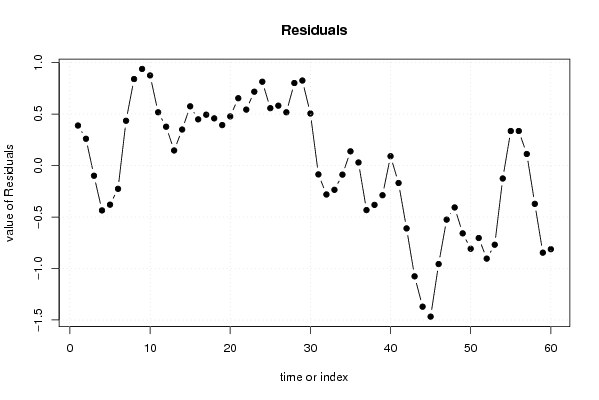
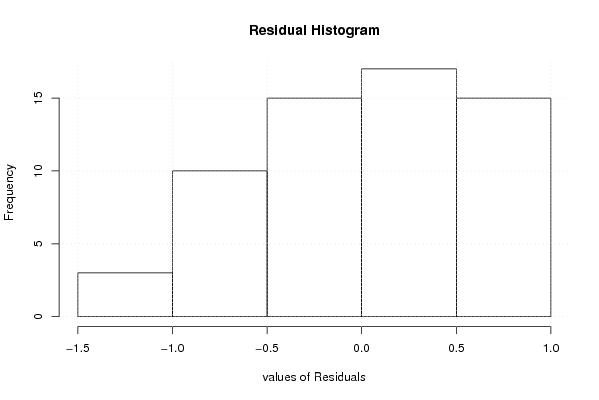
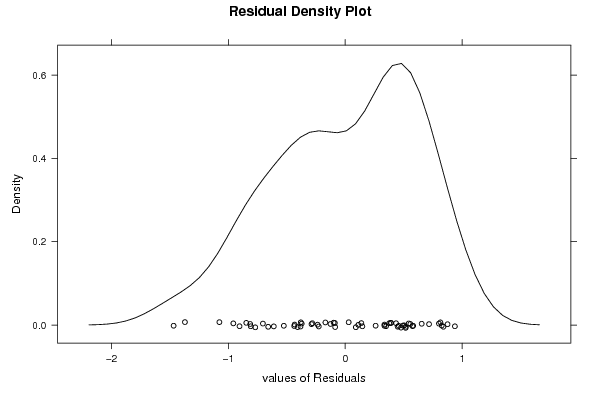
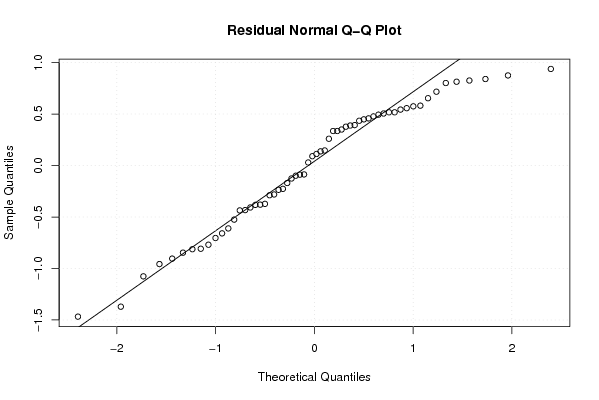
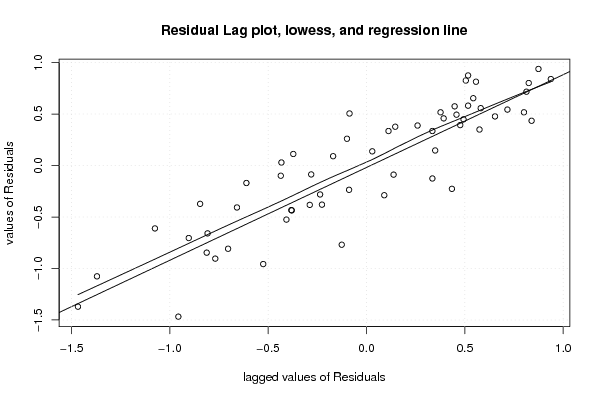
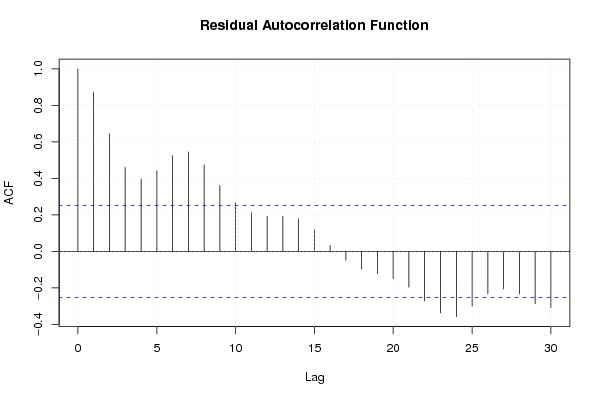
| Multiple Linear Regression - Residual Statistics | |
| Residual Standard Deviation | 0.68052947892171 |
| Sum Squared Residuals | 21.7666574690283 |
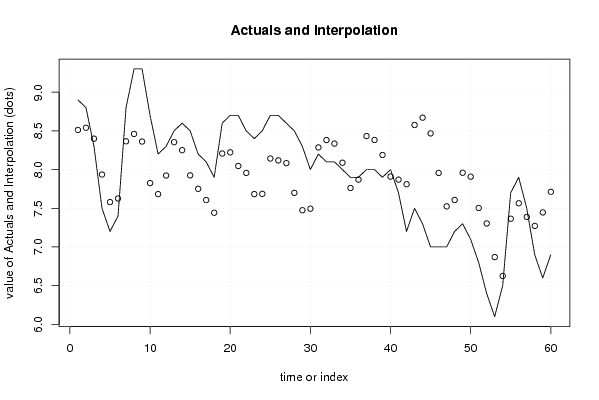
| Multiple Linear Regression - Actuals, Interpolation, and Residuals | |||
| Time or Index | Actuals | Interpolation Forecast | Residuals Prediction Error |
| 1 | 8.9 | 8.51171291082218 | 0.388287089177822 |
| 2 | 8.8 | 8.54017354356507 | 0.259826456434935 |
| 3 | 8.3 | 8.39916658134535 | -0.0991665813453451 |
| 4 | 7.5 | 7.9359143032661 | -0.4359143032661 |
| 5 | 7.2 | 7.58005784785502 | -0.380057847855022 |
| 6 | 7.4 | 7.62644670830347 | -0.226446708303470 |
| 7 | 8.8 | 8.36538189822873 | 0.434618101771272 |
| 8 | 9.3 | 8.46011569571004 | 0.839884304289957 |
| 9 | 9.3 | 8.36224531585953 | 0.937754684140474 |
| 10 | 8.7 | 7.82526620251868 | 0.874733797481315 |
| 11 | 8.2 | 7.68319443022422 | 0.516805569775775 |
| 12 | 8.3 | 7.92325227807925 | 0.376747721920754 |
| 13 | 8.5 | 8.35372683526159 | 0.14627316473841 |
| 14 | 8.6 | 8.25053240503737 | 0.349467594962629 |
| 15 | 8.5 | 7.92520835466366 | 0.574791645336336 |
| 16 | 8.2 | 7.75159721511211 | 0.448402784887887 |
| 17 | 8.1 | 7.60638886044845 | 0.49361113955155 |
| 18 | 7.9 | 7.44212962014948 | 0.457870379850517 |
| 19 | 8.6 | 8.20739582266817 | 0.392604177331831 |
| 20 | 8.7 | 8.2231365823692 | 0.476863417630797 |
| 21 | 8.7 | 8.0462731647384 | 0.653726835261594 |
| 22 | 8.5 | 7.95692126548582 | 0.543078734514181 |
| 23 | 8.4 | 7.68319443022422 | 0.716805569775776 |
| 24 | 8.5 | 7.6862731647384 | 0.813726835261594 |
| 25 | 8.7 | 8.14307873451417 | 0.556921265485824 |
| 26 | 8.7 | 8.11887734207024 | 0.581122657929763 |
| 27 | 8.6 | 8.08319443022422 | 0.516805569775775 |
| 28 | 8.5 | 7.69893518992526 | 0.801064810074742 |
| 29 | 8.3 | 7.47473379748132 | 0.825266202518686 |
| 30 | 8 | 7.49479164533634 | 0.505208354663663 |
| 31 | 8.2 | 8.28638886044845 | -0.0863888604484498 |
| 32 | 8.1 | 8.38112265792976 | -0.281122657929764 |
| 33 | 8.1 | 8.3359143032661 | -0.235914303266100 |
| 34 | 8 | 8.08857632845295 | -0.0885763284529536 |
| 35 | 7.9 | 7.7621874680045 | 0.137812531995496 |
| 36 | 7.9 | 7.8705902528924 | 0.0294097471076069 |
| 37 | 8 | 8.43271987304187 | -0.432719873041870 |
| 38 | 8 | 8.3821874680045 | -0.382187468004505 |
| 39 | 7.9 | 8.18851848059793 | -0.288518480597932 |
| 40 | 8 | 7.90958329067267 | 0.090416709327327 |
| 41 | 7.7 | 7.86969898638272 | -0.169698986382717 |
| 42 | 7.2 | 7.81076379645746 | -0.610763796457458 |
| 43 | 7.5 | 8.57602999897614 | -1.07602999897614 |
| 44 | 7.3 | 8.67076379645746 | -1.37076379645746 |
| 45 | 7 | 8.46756936623323 | -1.46756936623323 |
| 46 | 7 | 7.95692126548582 | -0.95692126548582 |
| 47 | 7 | 7.52520835466366 | -0.525208354663664 |
| 48 | 7.2 | 7.60728012695813 | -0.407280126958125 |
| 49 | 7.3 | 7.95876164636019 | -0.658761646360188 |
| 50 | 7.1 | 7.90822924132282 | -0.808229241322822 |
| 51 | 6.8 | 7.50391215316883 | -0.703912153168835 |
| 52 | 6.4 | 7.30397000102386 | -0.903970001023856 |
| 53 | 6.1 | 6.8691205078325 | -0.769120507832498 |
| 54 | 6.5 | 6.62586822975325 | -0.125868229753252 |
| 55 | 7.7 | 7.36480341967851 | 0.33519658032149 |
| 56 | 7.9 | 7.56486126753353 | 0.335138732466469 |
| 57 | 7.5 | 7.38799784990273 | 0.112002150097266 |
| 58 | 6.9 | 7.27231493805672 | -0.372314938056722 |
| 59 | 6.6 | 7.44621531688338 | -0.846215316883383 |
| 60 | 6.9 | 7.71260417733183 | -0.812604177331832 |
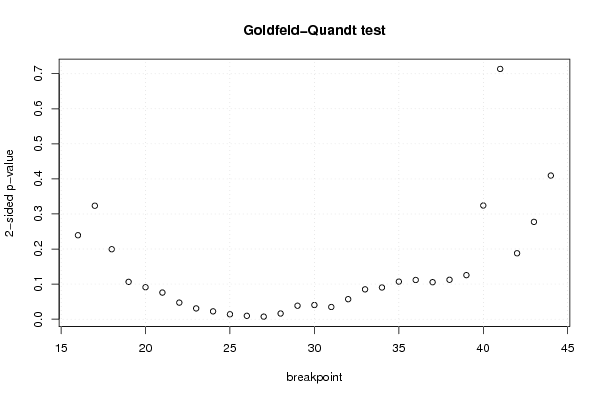
| Goldfeld-Quandt test for Heteroskedasticity | |||
| p-values | Alternative Hypothesis | ||
| breakpoint index | greater | 2-sided | less |
| 16 | 0.119686200902995 | 0.239372401805990 | 0.880313799097005 |
| 17 | 0.161740877364843 | 0.323481754729686 | 0.838259122635157 |
| 18 | 0.0997531127159773 | 0.199506225431955 | 0.900246887284023 |
| 19 | 0.0532367095131898 | 0.106473419026380 | 0.94676329048681 |
| 20 | 0.0455706117558529 | 0.0911412235117058 | 0.954429388244147 |
| 21 | 0.0379477084636609 | 0.0758954169273218 | 0.96205229153634 |
| 22 | 0.0236132422349685 | 0.047226484469937 | 0.976386757765032 |
| 23 | 0.0153700071023433 | 0.0307400142046867 | 0.984629992897657 |
| 24 | 0.0111657687815701 | 0.0223315375631402 | 0.98883423121843 |
| 25 | 0.00698238934255174 | 0.0139647786851035 | 0.993017610657448 |
| 26 | 0.0047997639928944 | 0.0095995279857888 | 0.995200236007106 |
| 27 | 0.00360719179859029 | 0.00721438359718058 | 0.99639280820141 |
| 28 | 0.00808944576762498 | 0.0161788915352500 | 0.991910554232375 |
| 29 | 0.0191897008347316 | 0.0383794016694633 | 0.980810299165268 |
| 30 | 0.0201834980250951 | 0.0403669960501901 | 0.979816501974905 |
| 31 | 0.0173834480945855 | 0.0347668961891711 | 0.982616551905414 |
| 32 | 0.0285144081424946 | 0.0570288162849892 | 0.971485591857505 |
| 33 | 0.0425279616339699 | 0.0850559232679398 | 0.95747203836603 |
| 34 | 0.0451902998244786 | 0.0903805996489572 | 0.954809700175521 |
| 35 | 0.0535658761393334 | 0.107131752278667 | 0.946434123860667 |
| 36 | 0.055898157687941 | 0.111796315375882 | 0.94410184231206 |
| 37 | 0.0527530182929485 | 0.105506036585897 | 0.947246981707051 |
| 38 | 0.0562130935649504 | 0.112426187129901 | 0.94378690643505 |
| 39 | 0.0627807188944748 | 0.125561437788950 | 0.937219281105525 |
| 40 | 0.162069036272537 | 0.324138072545075 | 0.837930963727463 |
| 41 | 0.643226369719047 | 0.713547260561905 | 0.356773630280953 |
| 42 | 0.906006446983474 | 0.187987106033053 | 0.0939935530165265 |
| 43 | 0.861306352119176 | 0.277387295761648 | 0.138693647880824 |
| 44 | 0.7952275927159 | 0.409544814568201 | 0.204772407284100 |
| Meta Analysis of Goldfeld-Quandt test for Heteroskedasticity | |||
| Description | # significant tests | % significant tests | OK/NOK |
| 1% type I error level | 2 | 0.0689655172413793 | NOK |
| 5% type I error level | 10 | 0.344827586206897 | NOK |
| 10% type I error level | 15 | 0.517241379310345 | NOK |