| Multiple Linear Regression - Estimated Regression Equation |
| Y[t] = -20975.9090114693 + 729.663124933304X[t] -739.925932000227M1[t] -810.905937388851M2[t] -751.494489025193M3[t] -381.362579415402M4[t] -761.283258554145M5[t] -425.773370194755M6[t] -590.816319326028M7[t] -773.893453448231M8[t] -228.600657584305M9[t] -585.677294222248M10[t] -448.101342111657M11[t] -86.799782107389t + e[t] |
| Multiple Linear Regression - Ordinary Least Squares | |||||
| Variable | Parameter | S.D. | T-STAT H0: parameter = 0 | 2-tail p-value | 1-tail p-value |
| (Intercept) | -20975.9090114693 | 15020.830195 | -1.3965 | 0.16928 | 0.08464 |
| X | 729.663124933304 | 411.029669 | 1.7752 | 0.08248 | 0.04124 |
| M1 | -739.925932000227 | 361.33308 | -2.0478 | 0.046317 | 0.023158 |
| M2 | -810.905937388851 | 360.924335 | -2.2467 | 0.029498 | 0.014749 |
| M3 | -751.494489025193 | 360.445791 | -2.0849 | 0.042656 | 0.021328 |
| M4 | -381.362579415402 | 361.544004 | -1.0548 | 0.297018 | 0.148509 |
| M5 | -761.283258554145 | 362.940294 | -2.0975 | 0.041469 | 0.020735 |
| M6 | -425.773370194755 | 367.244965 | -1.1594 | 0.252288 | 0.126144 |
| M7 | -590.816319326028 | 361.764758 | -1.6332 | 0.109265 | 0.054632 |
| M8 | -773.893453448231 | 360.92585 | -2.1442 | 0.037335 | 0.018668 |
| M9 | -228.600657584305 | 360.894558 | -0.6334 | 0.529591 | 0.264796 |
| M10 | -585.677294222248 | 359.715325 | -1.6282 | 0.11032 | 0.05516 |
| M11 | -448.101342111657 | 358.441167 | -1.2501 | 0.217571 | 0.108786 |
| t | -86.799782107389 | 39.225203 | -2.2129 | 0.031909 | 0.015955 |
| Multiple Linear Regression - Regression Statistics | |
| Multiple R | 0.618001316467757 |
| R-squared | 0.381925627155881 |
| Adjusted R-squared | 0.207252434830369 |
| F-TEST (value) | 2.18651541241740 |
| F-TEST (DF numerator) | 13 |
| F-TEST (DF denominator) | 46 |
| p-value | 0.0259702954238020 |
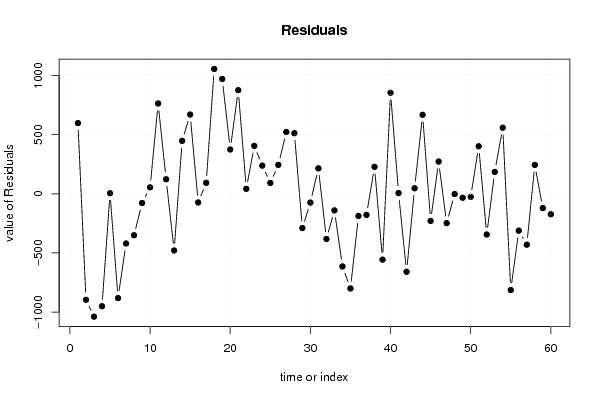
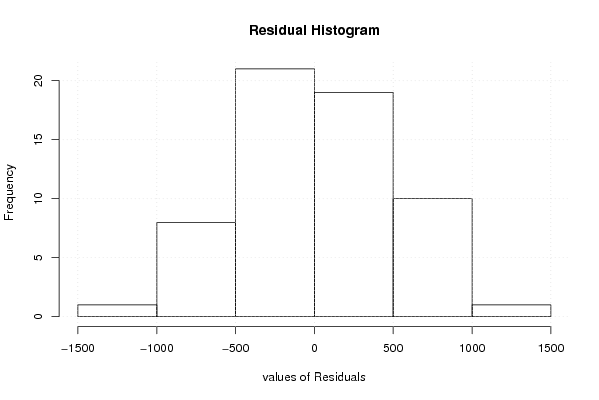
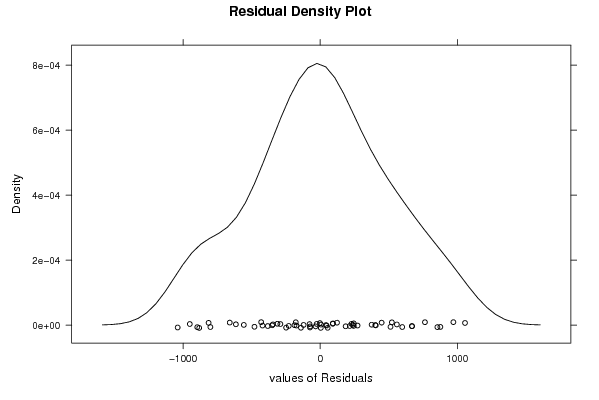
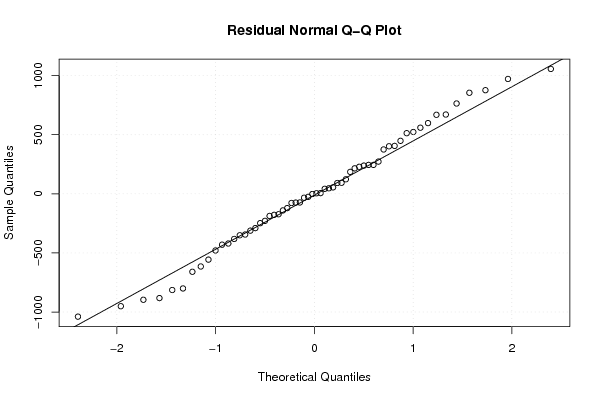
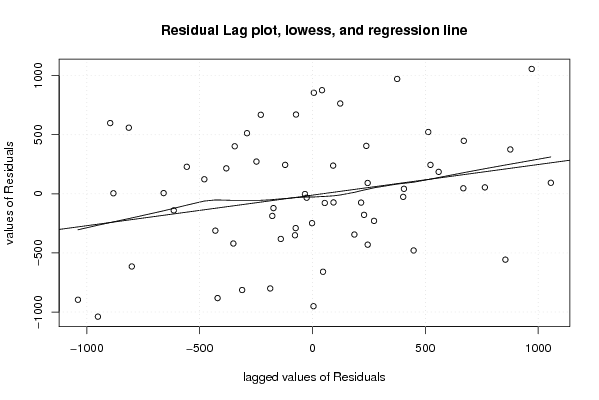
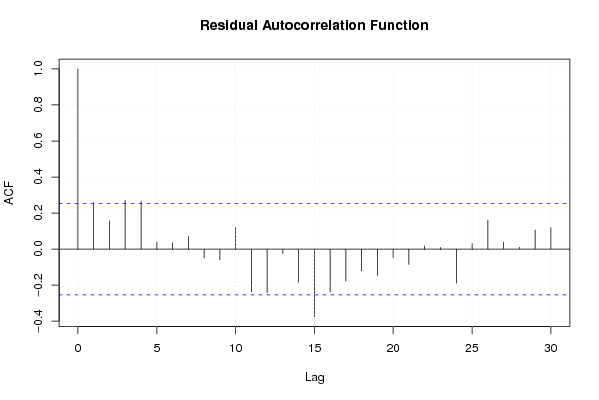
| Multiple Linear Regression - Residual Statistics | |
| Residual Standard Deviation | 566.34944137796 |
| Sum Squared Residuals | 14754577.7284599 |
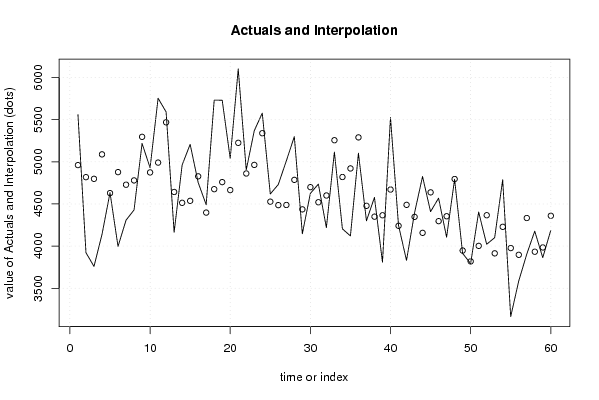
| Multiple Linear Regression - Actuals, Interpolation, and Residuals | |||
| Time or Index | Actuals | Interpolation Forecast | Residuals Prediction Error |
| 1 | 5560 | 4961.40869697655 | 598.591303023452 |
| 2 | 3922 | 4818.22217197927 | -896.222171979267 |
| 3 | 3759 | 4798.13046948487 | -1039.13046948487 |
| 4 | 4138 | 5088.75922823661 | -950.759228236606 |
| 5 | 4634 | 4629.3353982398 | 4.66460176019562 |
| 6 | 3996 | 4878.04550449181 | -882.045504491806 |
| 7 | 4308 | 4728.35561074381 | -420.355610743807 |
| 8 | 4429 | 4779.53046948487 | -350.530469484872 |
| 9 | 5219 | 5296.39653323607 | -77.3965332360716 |
| 10 | 4929 | 4874.41000823874 | 54.5899917612590 |
| 11 | 5755 | 4990.85585948594 | 764.144140514063 |
| 12 | 5592 | 5468.90351947954 | 123.096480520464 |
| 13 | 4163 | 4642.17780537192 | -479.17780537192 |
| 14 | 4962 | 4513.58454287324 | 448.415457126761 |
| 15 | 5208 | 4537.27262787484 | 670.72737212516 |
| 16 | 4755 | 4827.90138662657 | -72.9013866265736 |
| 17 | 4491 | 4397.66408162711 | 93.3359183728906 |
| 18 | 5732 | 4675.56071287644 | 1056.43928712356 |
| 19 | 5731 | 4759.3630191071 | 971.636980892899 |
| 20 | 5040 | 4664.6052528615 | 375.394747138503 |
| 21 | 6102 | 5225.2511041087 | 876.748895891302 |
| 22 | 4904 | 4861.63762910603 | 42.362370893971 |
| 23 | 5369 | 4963.49021785456 | 405.509782145438 |
| 24 | 5578 | 5339.3850403575 | 238.614959642502 |
| 25 | 4619 | 4527.25258874855 | 91.7474112514548 |
| 26 | 4731 | 4486.21890124186 | 244.781098758136 |
| 27 | 5011 | 4488.01709249547 | 522.982907504535 |
| 28 | 5299 | 4785.94248249653 | 513.05751750347 |
| 29 | 4146 | 4435.96812123973 | -289.968121239729 |
| 30 | 4625 | 4699.2714899904 | -74.2714899903987 |
| 31 | 4736 | 4520.39507124506 | 215.604928754937 |
| 32 | 4219 | 4600.75645498346 | -381.75645498346 |
| 33 | 5116 | 5256.25851247199 | -140.258512471986 |
| 34 | 4205 | 4819.67872497599 | -614.678724975991 |
| 35 | 4121 | 4921.53131372452 | -800.531313724524 |
| 36 | 5103 | 5290.12950497812 | -187.129504978124 |
| 37 | 4300 | 4477.99705336917 | -177.997053369170 |
| 38 | 4578 | 4349.40379087049 | 228.596209129506 |
| 39 | 3809 | 4365.79524462276 | -556.795244622759 |
| 40 | 5526 | 4671.01726587316 | 854.982734126839 |
| 41 | 4247 | 4240.77996087369 | 6.22003912630821 |
| 42 | 3830 | 4489.49006712569 | -659.490067125693 |
| 43 | 4394 | 4347.09680462703 | 46.9031953729692 |
| 44 | 4826 | 4157.4828321401 | 668.517167859899 |
| 45 | 4409 | 4637.86573964464 | -228.865739644638 |
| 46 | 4569 | 4296.14215838996 | 272.857841610036 |
| 47 | 4106 | 4354.2149596425 | -248.214959642503 |
| 48 | 4794 | 4795.77946338943 | -1.77946338943394 |
| 49 | 3914 | 3947.16385553382 | -33.1638555338176 |
| 50 | 3793 | 3818.57059303514 | -25.5705930351362 |
| 51 | 4405 | 4002.78456552206 | 402.215434477936 |
| 52 | 4022 | 4366.37963676713 | -344.379636767129 |
| 53 | 4100 | 3914.25243801966 | 185.747561980335 |
| 54 | 4788 | 4228.63222551566 | 559.36777448434 |
| 55 | 3163 | 3976.789494277 | -813.789494276999 |
| 56 | 3585 | 3896.62499053007 | -311.624990530069 |
| 57 | 3903 | 4333.22811053861 | -430.228110538606 |
| 58 | 4178 | 3933.13147928927 | 244.868520710726 |
| 59 | 3863 | 3983.90764929248 | -120.907649292476 |
| 60 | 4187 | 4359.80247179541 | -172.802471795408 |
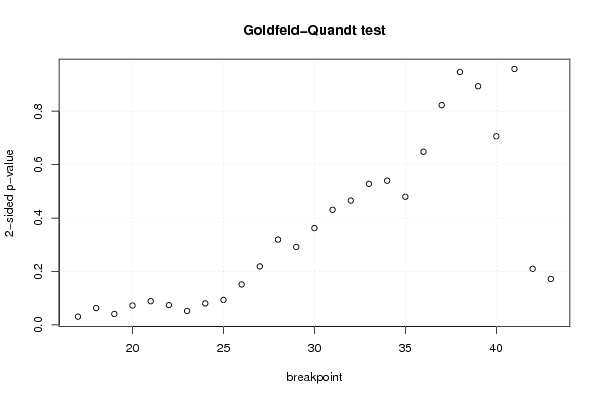
| Goldfeld-Quandt test for Heteroskedasticity | |||
| p-values | Alternative Hypothesis | ||
| breakpoint index | greater | 2-sided | less |
| 17 | 0.98447911526464 | 0.0310417694707174 | 0.0155208847353587 |
| 18 | 0.968436798177031 | 0.0631264036459373 | 0.0315632018229686 |
| 19 | 0.97943742237151 | 0.0411251552569789 | 0.0205625776284895 |
| 20 | 0.963642395011113 | 0.072715209977775 | 0.0363576049888875 |
| 21 | 0.9556007764401 | 0.088798447119798 | 0.044399223559899 |
| 22 | 0.962878854435964 | 0.0742422911280714 | 0.0371211455640357 |
| 23 | 0.973835190909451 | 0.0523296181810976 | 0.0261648090905488 |
| 24 | 0.959666541109701 | 0.080666917780598 | 0.040333458890299 |
| 25 | 0.953061604122692 | 0.0938767917546158 | 0.0469383958773079 |
| 26 | 0.924148315312925 | 0.151703369374151 | 0.0758516846870754 |
| 27 | 0.890450684965556 | 0.219098630068887 | 0.109549315034444 |
| 28 | 0.840238573247776 | 0.319522853504448 | 0.159761426752224 |
| 29 | 0.854130157300236 | 0.291739685399529 | 0.145869842699764 |
| 30 | 0.818723775648812 | 0.362552448702376 | 0.181276224351188 |
| 31 | 0.784461335444151 | 0.431077329111698 | 0.215538664555849 |
| 32 | 0.767194392649825 | 0.46561121470035 | 0.232805607350175 |
| 33 | 0.735922078705622 | 0.528155842588757 | 0.264077921294378 |
| 34 | 0.73000246762626 | 0.53999506474748 | 0.26999753237374 |
| 35 | 0.760093123776092 | 0.479813752447817 | 0.239906876223909 |
| 36 | 0.675853741146533 | 0.648292517706935 | 0.324146258853467 |
| 37 | 0.588578515058161 | 0.822842969883678 | 0.411421484941839 |
| 38 | 0.473494684126184 | 0.946989368252367 | 0.526505315873816 |
| 39 | 0.553191451186967 | 0.893617097626066 | 0.446808548813033 |
| 40 | 0.646821966975791 | 0.706356066048418 | 0.353178033024209 |
| 41 | 0.520872463986411 | 0.958255072027178 | 0.479127536013589 |
| 42 | 0.89492939118921 | 0.210141217621580 | 0.105070608810790 |
| 43 | 0.913996362646163 | 0.172007274707673 | 0.0860036373538365 |
| Meta Analysis of Goldfeld-Quandt test for Heteroskedasticity | |||
| Description | # significant tests | % significant tests | OK/NOK |
| 1% type I error level | 0 | 0 | OK |
| 5% type I error level | 2 | 0.0740740740740741 | NOK |
| 10% type I error level | 9 | 0.333333333333333 | NOK |