| Multiple Linear Regression - Estimated Regression Equation |
| Y1[t] = -14573.6863254658 + 0.286065503358865Y[t] + 459.077940222844X[t] + 0.172963208384406Y2[t] + 263.451877994075M1[t] + 270.461141609439M2[t] + 718.898880064055M3[t] + 200.951950880125M4[t] + 554.657601557322M5[t] + 304.09070366431M6[t] + 134.175190321277M7[t] + 803.65049328323M8[t] + 323.783975068084M9[t] + 382.612353324275M10[t] + 1149.28201806185M11[t] -51.1841435474764t + e[t] |
| Multiple Linear Regression - Ordinary Least Squares | |||||
| Variable | Parameter | S.D. | T-STAT H0: parameter = 0 | 2-tail p-value | 1-tail p-value |
| (Intercept) | -14573.6863254658 | 14958.587512 | -0.9743 | 0.335501 | 0.167751 |
| Y | 0.286065503358865 | 0.148166 | 1.9307 | 0.060288 | 0.030144 |
| X | 459.077940222844 | 416.924803 | 1.1011 | 0.277122 | 0.138561 |
| Y2 | 0.172963208384406 | 0.144688 | 1.1954 | 0.238629 | 0.119314 |
| M1 | 263.451877994075 | 379.092278 | 0.695 | 0.490911 | 0.245455 |
| M2 | 270.461141609439 | 384.662919 | 0.7031 | 0.485865 | 0.242933 |
| M3 | 718.898880064055 | 378.815311 | 1.8978 | 0.064616 | 0.032308 |
| M4 | 200.951950880125 | 370.652147 | 0.5422 | 0.590575 | 0.295287 |
| M5 | 554.657601557322 | 382.617656 | 1.4496 | 0.154586 | 0.077293 |
| M6 | 304.09070366431 | 379.21696 | 0.8019 | 0.42713 | 0.213565 |
| M7 | 134.175190321277 | 390.902398 | 0.3432 | 0.733127 | 0.366563 |
| M8 | 803.65049328323 | 384.186933 | 2.0918 | 0.042539 | 0.02127 |
| M9 | 323.783975068084 | 363.724633 | 0.8902 | 0.378435 | 0.189217 |
| M10 | 382.612353324275 | 385.360681 | 0.9929 | 0.32646 | 0.16323 |
| M11 | 1149.28201806185 | 386.044247 | 2.9771 | 0.004814 | 0.002407 |
| t | -51.1841435474764 | 41.091625 | -1.2456 | 0.219812 | 0.109906 |
| Multiple Linear Regression - Regression Statistics | |
| Multiple R | 0.686774285814741 |
| R-squared | 0.471658919656347 |
| Adjusted R-squared | 0.282965676676471 |
| F-TEST (value) | 2.49960683386341 |
| F-TEST (DF numerator) | 15 |
| F-TEST (DF denominator) | 42 |
| p-value | 0.00992526955596018 |
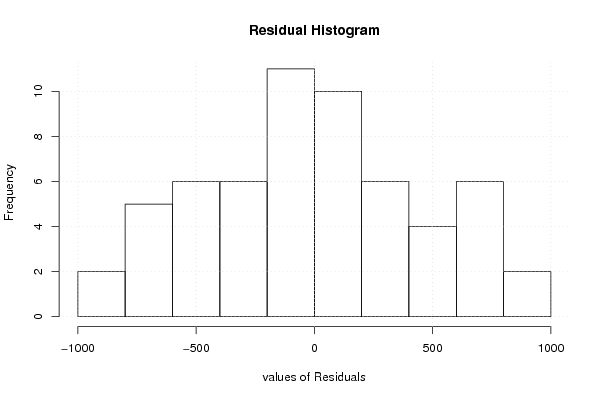
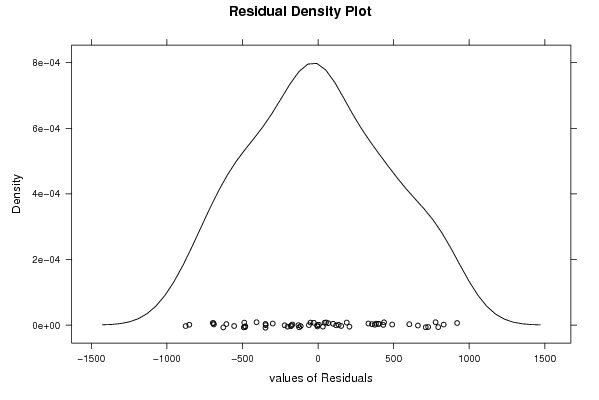
| Multiple Linear Regression - Residual Statistics | |
| Residual Standard Deviation | 535.137166105338 |
| Sum Squared Residuals | 12027615.0349846 |
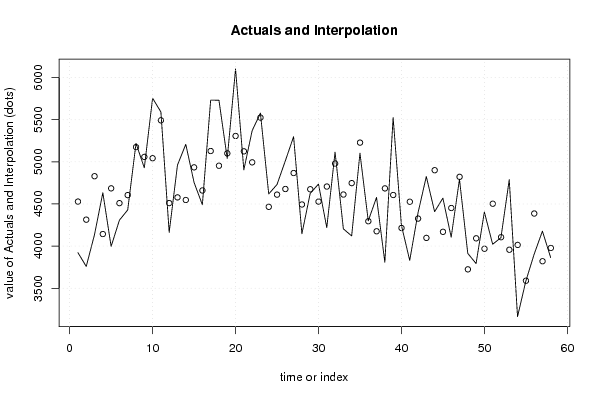
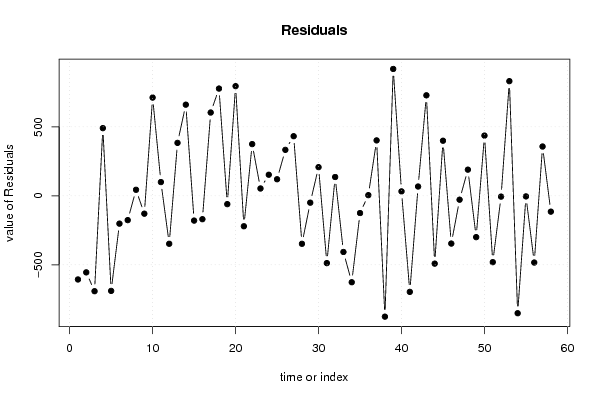
| Multiple Linear Regression - Actuals, Interpolation, and Residuals | |||
| Time or Index | Actuals | Interpolation Forecast | Residuals Prediction Error |
| 1 | 3922 | 4528.32826030459 | -606.328260304594 |
| 2 | 3759 | 4313.8492502141 | -554.849250214103 |
| 3 | 4138 | 4829.38911122281 | -691.389111222806 |
| 4 | 4634 | 4143.30130332614 | 490.698696673864 |
| 5 | 3996 | 4685.13591049369 | -689.135910493687 |
| 6 | 4308 | 4509.64256170842 | -201.642561708424 |
| 7 | 4429 | 4605.22540870518 | -176.225408705179 |
| 8 | 5219 | 5175.25845856678 | 43.7415414332157 |
| 9 | 4929 | 5058.45585182232 | -129.455851822320 |
| 10 | 5755 | 5042.76454948772 | 712.235450512281 |
| 11 | 5592 | 5492.33007650352 | 99.6699234964825 |
| 12 | 4163 | 4510.60036672018 | -347.600366720179 |
| 13 | 4962 | 4578.21124602734 | 383.788753972658 |
| 14 | 5208 | 4547.23707597503 | 660.762924024967 |
| 15 | 4755 | 4934.47222426914 | -179.47222426914 |
| 16 | 4491 | 4660.35922541686 | -169.359225416862 |
| 17 | 5732 | 5128.10823253225 | 603.89176746775 |
| 18 | 5731 | 4953.51197552931 | 777.488024470685 |
| 19 | 5040 | 5100.31183162873 | -60.311831628734 |
| 20 | 6102 | 5306.87751445018 | 795.122485549823 |
| 21 | 4904 | 5124.66969486927 | -220.669694869266 |
| 22 | 5369 | 4994.07325493992 | 374.926745060076 |
| 23 | 5578 | 5524.83140911207 | 53.1685908879253 |
| 24 | 4619 | 4466.00636486694 | 152.993635133062 |
| 25 | 4731 | 4610.86384102229 | 120.136158977713 |
| 26 | 5011 | 4677.62926420104 | 333.370735798963 |
| 27 | 5299 | 4866.9315025187 | 432.068497481305 |
| 28 | 4146 | 4493.82076871535 | -347.820768715352 |
| 29 | 4625 | 4674.57676147297 | -49.5767614729691 |
| 30 | 4736 | 4528.13664291905 | 207.863357080955 |
| 31 | 4219 | 4706.78770253227 | -487.787702532273 |
| 32 | 5116 | 4979.64198905432 | 136.358010945684 |
| 33 | 4205 | 4611.84527874596 | -406.84527874596 |
| 34 | 4121 | 4747.42713431711 | -626.427134317115 |
| 35 | 5103 | 5227.85470561021 | -124.854705610210 |
| 36 | 4300 | 4295.12774217705 | 4.87225782294966 |
| 37 | 4578 | 4176.06632462137 | 401.933675378628 |
| 38 | 3809 | 4684.92202409398 | -875.922024093982 |
| 39 | 5526 | 4606.24302996867 | 919.756970031334 |
| 40 | 4247 | 4214.80047113264 | 32.1995288673625 |
| 41 | 3830 | 4526.30466966653 | -696.304669666533 |
| 42 | 4394 | 4326.50684120529 | 67.4931587947101 |
| 43 | 4826 | 4097.44145714962 | 728.558542850376 |
| 44 | 4409 | 4900.49411475478 | -491.494114754778 |
| 45 | 4569 | 4169.46024644293 | 399.539753557066 |
| 46 | 4106 | 4452.09023422857 | -346.090234228566 |
| 47 | 4794 | 4821.9838087742 | -27.9838087741978 |
| 48 | 3914 | 3724.26552623583 | 189.734473764168 |
| 49 | 3793 | 4092.5303280244 | -299.530328024404 |
| 50 | 4405 | 3968.36238551585 | 436.637614484154 |
| 51 | 4022 | 4502.96413202069 | -480.964132020692 |
| 52 | 4100 | 4105.71823140901 | -5.71823140901141 |
| 53 | 4788 | 3956.87442583456 | 831.12557416544 |
| 54 | 3163 | 4014.20197863793 | -851.201978637926 |
| 55 | 3585 | 3589.23359998419 | -4.23359998418977 |
| 56 | 3903 | 4386.72792317394 | -483.727923173945 |
| 57 | 4178 | 3820.56892811952 | 357.431071880479 |
| 58 | 3863 | 3977.64482702668 | -114.644827026676 |
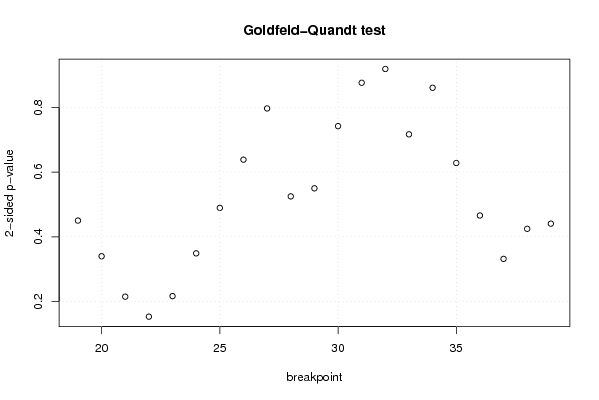
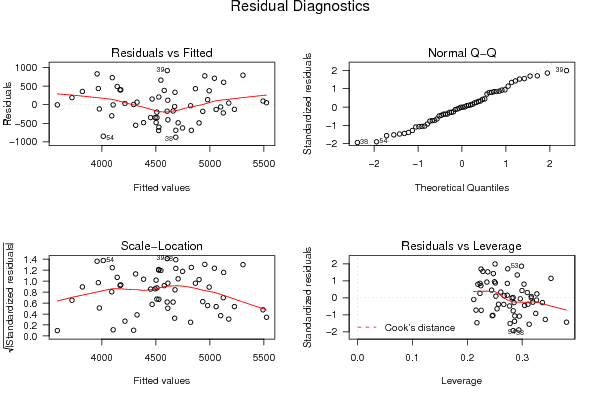
| Goldfeld-Quandt test for Heteroskedasticity | |||
| p-values | Alternative Hypothesis | ||
| breakpoint index | greater | 2-sided | less |
| 19 | 0.774948798953122 | 0.450102402093756 | 0.225051201046878 |
| 20 | 0.830050058651671 | 0.339899882696657 | 0.169949941348329 |
| 21 | 0.89247157207679 | 0.215056855846419 | 0.107528427923210 |
| 22 | 0.923314629343871 | 0.153370741312257 | 0.0766853706561287 |
| 23 | 0.891604309902073 | 0.216791380195855 | 0.108395690097928 |
| 24 | 0.825555777847983 | 0.348888444304034 | 0.174444222152017 |
| 25 | 0.755378193266417 | 0.489243613467166 | 0.244621806733583 |
| 26 | 0.680939749926435 | 0.63812050014713 | 0.319060250073565 |
| 27 | 0.601849104399755 | 0.79630179120049 | 0.398150895600245 |
| 28 | 0.737608598272066 | 0.524782803455867 | 0.262391401727934 |
| 29 | 0.725173411044574 | 0.549653177910852 | 0.274826588955426 |
| 30 | 0.629111031518388 | 0.741777936963224 | 0.370888968481612 |
| 31 | 0.56219818743132 | 0.875603625137361 | 0.437801812568680 |
| 32 | 0.459150169569431 | 0.918300339138862 | 0.540849830430569 |
| 33 | 0.358204090785821 | 0.716408181571641 | 0.641795909214179 |
| 34 | 0.430082432065884 | 0.860164864131768 | 0.569917567934116 |
| 35 | 0.313977851568805 | 0.62795570313761 | 0.686022148431195 |
| 36 | 0.232850948491587 | 0.465701896983174 | 0.767149051508413 |
| 37 | 0.165901157180902 | 0.331802314361804 | 0.834098842819098 |
| 38 | 0.212300087060764 | 0.424600174121529 | 0.787699912939236 |
| 39 | 0.220266087741130 | 0.440532175482261 | 0.77973391225887 |
| Meta Analysis of Goldfeld-Quandt test for Heteroskedasticity | |||
| Description | # significant tests | % significant tests | OK/NOK |
| 1% type I error level | 0 | 0 | OK |
| 5% type I error level | 0 | 0 | OK |
| 10% type I error level | 0 | 0 | OK |