| Multiple Linear Regression - Estimated Regression Equation |
| Werkloosheidsgraad[t] = + 21.8542582437825 -0.135961536651284Consumptiepris[t] + e[t] |
| Multiple Linear Regression - Ordinary Least Squares | |||||
| Variable | Parameter | S.D. | T-STAT H0: parameter = 0 | 2-tail p-value | 1-tail p-value |
| (Intercept) | 21.8542582437825 | 1.64605 | 13.2768 | 0 | 0 |
| Consumptiepris | -0.135961536651284 | 0.016033 | -8.4799 | 0 | 0 |
| Multiple Linear Regression - Regression Statistics | |
| Multiple R | 0.743998368902218 |
| R-squared | 0.553533572929161 |
| Adjusted R-squared | 0.545835875910698 |
| F-TEST (value) | 71.9089841548094 |
| F-TEST (DF numerator) | 1 |
| F-TEST (DF denominator) | 58 |
| p-value | 9.66049462647334e-12 |
| Multiple Linear Regression - Residual Statistics | |
| Residual Standard Deviation | 0.500923542678757 |
| Sum Squared Residuals | 14.5536149453705 |
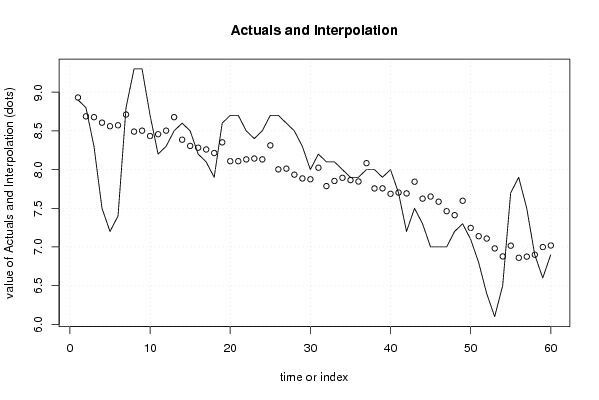
| Multiple Linear Regression - Actuals, Interpolation, and Residuals | |||
| Time or Index | Actuals | Interpolation Forecast | Residuals Prediction Error |
| 1 | 8.9 | 8.93111418507803 | -0.0311141850780302 |
| 2 | 8.8 | 8.68774303447218 | 0.112256965527816 |
| 3 | 8.3 | 8.67686611154008 | -0.376866111540082 |
| 4 | 7.5 | 8.60616611248141 | -1.10616611248142 |
| 5 | 7.2 | 8.55993919001998 | -1.35993919001998 |
| 6 | 7.4 | 8.5721757283186 | -1.17217572831859 |
| 7 | 8.8 | 8.7108564957029 | 0.0891435042970973 |
| 8 | 9.3 | 8.49059880632782 | 0.809401193672178 |
| 9 | 9.3 | 8.50283534462644 | 0.797164655373563 |
| 10 | 8.7 | 8.43349496093428 | 0.266505039065715 |
| 11 | 8.2 | 8.456608422165 | -0.256608422165002 |
| 12 | 8.3 | 8.50283534462644 | -0.202835344626438 |
| 13 | 8.5 | 8.67686611154008 | -0.176866111540082 |
| 14 | 8.6 | 8.38590842310633 | 0.214091576893666 |
| 15 | 8.5 | 8.30569111648208 | 0.194308883517924 |
| 16 | 8.2 | 8.28257765525136 | -0.08257765525136 |
| 17 | 8.1 | 8.25946419402064 | -0.159464194020641 |
| 18 | 7.9 | 8.2132372715592 | -0.313237271559203 |
| 19 | 8.6 | 8.35191803894351 | 0.248081961056487 |
| 20 | 8.7 | 8.10854688833771 | 0.591453111662284 |
| 21 | 8.7 | 8.10854688833771 | 0.591453111662284 |
| 22 | 8.5 | 8.13166034956843 | 0.368339650431568 |
| 23 | 8.4 | 8.14253727250054 | 0.257462727499464 |
| 24 | 8.5 | 8.13166034956843 | 0.368339650431568 |
| 25 | 8.7 | 8.31248919331464 | 0.387510806685358 |
| 26 | 8.7 | 8.00249688974971 | 0.697503110250286 |
| 27 | 8.6 | 8.0120141973153 | 0.587985802684697 |
| 28 | 8.5 | 7.93451612142407 | 0.565483878575929 |
| 29 | 8.3 | 7.8855699682296 | 0.414430031770392 |
| 30 | 8 | 7.8746930452975 | 0.125306954702493 |
| 31 | 8.2 | 8.02425073561392 | 0.175749264386081 |
| 32 | 8.1 | 7.78631804647417 | 0.313681953525829 |
| 33 | 8.1 | 7.8529391994333 | 0.2470608005667 |
| 34 | 8 | 7.89372766042868 | 0.106272339571316 |
| 35 | 7.9 | 7.8638161223654 | 0.0361838776345983 |
| 36 | 7.9 | 7.84614112260074 | 0.0538588773992646 |
| 37 | 8 | 8.08271419637397 | -0.0827141963739696 |
| 38 | 8 | 7.75640650841089 | 0.243593491589111 |
| 39 | 7.9 | 7.7577661237774 | 0.1422338762226 |
| 40 | 8 | 7.68706612471873 | 0.312933875281267 |
| 41 | 7.7 | 7.70338150911689 | -0.00338150911688754 |
| 42 | 7.2 | 7.69250458618479 | -0.492504586184785 |
| 43 | 7.5 | 7.84342189186771 | -0.343421891867711 |
| 44 | 7.3 | 7.62452381785914 | -0.324523817859143 |
| 45 | 7 | 7.6517161251894 | -0.6517161251894 |
| 46 | 7 | 7.58509497223027 | -0.58509497223027 |
| 47 | 7 | 7.46272958924412 | -0.462729589244115 |
| 48 | 7.2 | 7.41106420531663 | -0.211064205316626 |
| 49 | 7.3 | 7.59733151052889 | -0.297331510528886 |
| 50 | 7.1 | 7.24655074596857 | -0.146550745968573 |
| 51 | 6.8 | 7.13914113201406 | -0.339141132014058 |
| 52 | 6.4 | 7.10922959395077 | -0.709229593950775 |
| 53 | 6.1 | 6.98142574949857 | -0.881425749498568 |
| 54 | 6.5 | 6.87809498164359 | -0.378094981643592 |
| 55 | 7.7 | 7.0167757490279 | 0.683224250972097 |
| 56 | 7.9 | 6.86041998187893 | 1.03958001812108 |
| 57 | 7.5 | 6.87537575091057 | 0.624624249089434 |
| 58 | 6.9 | 6.8998488275078 | 0.000151172492202026 |
| 59 | 6.6 | 6.99910074926323 | -0.399100749263235 |
| 60 | 6.9 | 7.01949497976093 | -0.119494979760928 |
| Goldfeld-Quandt test for Heteroskedasticity | |||
| p-values | Alternative Hypothesis | ||
| breakpoint index | greater | 2-sided | less |
| 5 | 0.712404484097454 | 0.575191031805092 | 0.287595515902546 |
| 6 | 0.676402630220011 | 0.647194739559978 | 0.323597369779989 |
| 7 | 0.719912016223904 | 0.560175967552192 | 0.280087983776096 |
| 8 | 0.99677361556438 | 0.00645276887124019 | 0.00322638443562010 |
| 9 | 0.99941912761184 | 0.00116174477631937 | 0.000580872388159686 |
| 10 | 0.998970339718087 | 0.00205932056382507 | 0.00102966028191254 |
| 11 | 0.99816077196389 | 0.00367845607222058 | 0.00183922803611029 |
| 12 | 0.996767403306458 | 0.00646519338708447 | 0.00323259669354224 |
| 13 | 0.994803830715779 | 0.0103923385684417 | 0.00519616928422084 |
| 14 | 0.991270314277962 | 0.0174593714440756 | 0.0087296857220378 |
| 15 | 0.98501392069513 | 0.0299721586097406 | 0.0149860793048703 |
| 16 | 0.977011080751185 | 0.0459778384976295 | 0.0229889192488147 |
| 17 | 0.968045538443341 | 0.0639089231133173 | 0.0319544615566586 |
| 18 | 0.96382156381916 | 0.0723568723616791 | 0.0361784361808395 |
| 19 | 0.949378570810054 | 0.101242858379891 | 0.0506214291899457 |
| 20 | 0.942977037481824 | 0.114045925036351 | 0.0570229625181755 |
| 21 | 0.932686497006605 | 0.13462700598679 | 0.067313502993395 |
| 22 | 0.906248054840286 | 0.187503890319427 | 0.0937519451597136 |
| 23 | 0.869670720753626 | 0.260658558492748 | 0.130329279246374 |
| 24 | 0.829245486612178 | 0.341509026775644 | 0.170754513387822 |
| 25 | 0.790200207681698 | 0.419599584636604 | 0.209799792318302 |
| 26 | 0.78644250034804 | 0.42711499930392 | 0.21355749965196 |
| 27 | 0.769600540732242 | 0.460798918535516 | 0.230399459267758 |
| 28 | 0.756895364404945 | 0.486209271190109 | 0.243104635595055 |
| 29 | 0.73283755051602 | 0.53432489896796 | 0.26716244948398 |
| 30 | 0.70075994623849 | 0.59848010752302 | 0.29924005376151 |
| 31 | 0.65072253348449 | 0.698554933031019 | 0.349277466515509 |
| 32 | 0.623072627664553 | 0.753854744670895 | 0.376927372335447 |
| 33 | 0.588357338777944 | 0.823285322444112 | 0.411642661222056 |
| 34 | 0.544798996830375 | 0.910402006339249 | 0.455201003169625 |
| 35 | 0.501353909335802 | 0.997292181328395 | 0.498646090664198 |
| 36 | 0.458001409024835 | 0.916002818049669 | 0.541998590975165 |
| 37 | 0.405426268916498 | 0.810852537832996 | 0.594573731083502 |
| 38 | 0.39427154047413 | 0.78854308094826 | 0.60572845952587 |
| 39 | 0.381270111472258 | 0.762540222944517 | 0.618729888527742 |
| 40 | 0.426617755895214 | 0.853235511790427 | 0.573382244104786 |
| 41 | 0.427073217380410 | 0.854146434760819 | 0.57292678261959 |
| 42 | 0.429344225582782 | 0.858688451165564 | 0.570655774417218 |
| 43 | 0.409224683242471 | 0.818449366484941 | 0.590775316757529 |
| 44 | 0.377442568340637 | 0.754885136681273 | 0.622557431659363 |
| 45 | 0.362954960576485 | 0.72590992115297 | 0.637045039423515 |
| 46 | 0.326238838045367 | 0.652477676090735 | 0.673761161954633 |
| 47 | 0.27111475937271 | 0.54222951874542 | 0.72888524062729 |
| 48 | 0.207990373650767 | 0.415980747301534 | 0.792009626349233 |
| 49 | 0.196371325319089 | 0.392742650638178 | 0.803628674680911 |
| 50 | 0.189260837017498 | 0.378521674034996 | 0.810739162982502 |
| 51 | 0.144325897825537 | 0.288651795651074 | 0.855674102174463 |
| 52 | 0.10384920659911 | 0.20769841319822 | 0.89615079340089 |
| 53 | 0.202032760609653 | 0.404065521219305 | 0.797967239390347 |
| 54 | 0.33064165760238 | 0.66128331520476 | 0.66935834239762 |
| 55 | 0.651680480657215 | 0.696639038685571 | 0.348319519342786 |
| Meta Analysis of Goldfeld-Quandt test for Heteroskedasticity | |||
| Description | # significant tests | % significant tests | OK/NOK |
| 1% type I error level | 5 | 0.0980392156862745 | NOK |
| 5% type I error level | 9 | 0.176470588235294 | NOK |
| 10% type I error level | 11 | 0.215686274509804 | NOK |