| Multiple Linear Regression - Estimated Regression Equation |
| Y[t] = + 45157.3216699624 + 0.492045256054949X[t] + 0.469069737125908`yt-1`[t] -0.0789174470844457`yt-2`[t] + 0.0872661433584767`yt-3`[t] -0.289706583131103`yt-4`[t] + 3347.42238425707M1[t] + 4680.4007143094M2[t] -5912.44143343331M3[t] -20106.8179521148M4[t] -20373.1414736510M5[t] -17006.4450401302M6[t] -10613.8820516124M7[t] -2691.84006111352M8[t] -2069.86719893052M9[t] -1154.20523955606M10[t] -2543.26157898661M11[t] -311.187481241182t + e[t] |
| Multiple Linear Regression - Ordinary Least Squares | |||||
| Variable | Parameter | S.D. | T-STAT H0: parameter = 0 | 2-tail p-value | 1-tail p-value |
| (Intercept) | 45157.3216699624 | 14651.865569 | 3.082 | 0.003341 | 0.00167 |
| X | 0.492045256054949 | 0.069907 | 7.0386 | 0 | 0 |
| `yt-1` | 0.469069737125908 | 0.123888 | 3.7862 | 0.000411 | 0.000205 |
| `yt-2` | -0.0789174470844457 | 0.137762 | -0.5729 | 0.569312 | 0.284656 |
| `yt-3` | 0.0872661433584767 | 0.138214 | 0.6314 | 0.530666 | 0.265333 |
| `yt-4` | -0.289706583131103 | 0.10223 | -2.8339 | 0.006616 | 0.003308 |
| M1 | 3347.42238425707 | 1934.151162 | 1.7307 | 0.089674 | 0.044837 |
| M2 | 4680.4007143094 | 1973.884906 | 2.3712 | 0.021626 | 0.010813 |
| M3 | -5912.44143343331 | 4091.049188 | -1.4452 | 0.154636 | 0.077318 |
| M4 | -20106.8179521148 | 4438.569686 | -4.53 | 3.7e-05 | 1.8e-05 |
| M5 | -20373.1414736510 | 4236.880926 | -4.8085 | 1.4e-05 | 7e-06 |
| M6 | -17006.4450401302 | 3546.159356 | -4.7957 | 1.5e-05 | 7e-06 |
| M7 | -10613.8820516124 | 1997.729216 | -5.313 | 3e-06 | 1e-06 |
| M8 | -2691.84006111352 | 2418.919532 | -1.1128 | 0.271104 | 0.135552 |
| M9 | -2069.86719893052 | 2472.791929 | -0.8371 | 0.406544 | 0.203272 |
| M10 | -1154.20523955606 | 2413.719748 | -0.4782 | 0.634603 | 0.317301 |
| M11 | -2543.26157898661 | 1988.365583 | -1.2791 | 0.206776 | 0.103388 |
| t | -311.187481241182 | 84.895304 | -3.6655 | 0.000597 | 0.000299 |
| Multiple Linear Regression - Regression Statistics | |
| Multiple R | 0.99481067895626 |
| R-squared | 0.989648286965417 |
| Adjusted R-squared | 0.98612870453366 |
| F-TEST (value) | 281.183437567921 |
| F-TEST (DF numerator) | 17 |
| F-TEST (DF denominator) | 50 |
| p-value | 0 |
| Multiple Linear Regression - Residual Statistics | |
| Residual Standard Deviation | 2933.95709978877 |
| Sum Squared Residuals | 430405213.170048 |
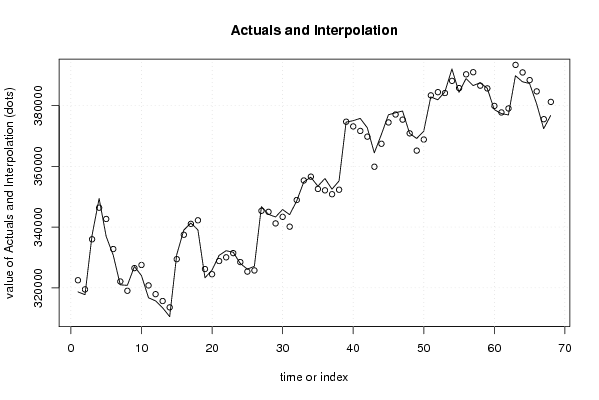
| Multiple Linear Regression - Actuals, Interpolation, and Residuals | |||
| Time or Index | Actuals | Interpolation Forecast | Residuals Prediction Error |
| 1 | 318672 | 322518.863375641 | -3846.86337564090 |
| 2 | 317756 | 319503.035591463 | -1747.03559146340 |
| 3 | 337302 | 335999.134617619 | 1302.86538238138 |
| 4 | 349420 | 346388.214976538 | 3031.78502346251 |
| 5 | 336923 | 342676.301539132 | -5753.30153913222 |
| 6 | 330758 | 332782.090399556 | -2024.09039955607 |
| 7 | 321002 | 322103.957926635 | -1101.95792663474 |
| 8 | 320820 | 319042.890572957 | 1777.10942704312 |
| 9 | 327032 | 326499.566044411 | 532.43395558866 |
| 10 | 324047 | 327538.857996403 | -3491.85799640324 |
| 11 | 316735 | 320813.810032402 | -4078.81003240201 |
| 12 | 315710 | 317926.674916245 | -2216.6749162452 |
| 13 | 313427 | 315662.944143400 | -2235.94414340046 |
| 14 | 310527 | 313579.779902458 | -3052.77990245839 |
| 15 | 330962 | 329448.891712182 | 1513.10828781758 |
| 16 | 339015 | 337480.246209252 | 1534.7537907476 |
| 17 | 341332 | 341076.919345131 | 255.080654869102 |
| 18 | 339092 | 342239.48450244 | -3147.48450244010 |
| 19 | 323308 | 326199.72703026 | -2891.72703025979 |
| 20 | 325849 | 324493.588186651 | 1355.41181334932 |
| 21 | 330675 | 328826.555905838 | 1848.44409416168 |
| 22 | 332225 | 330055.252292 | 2169.74770800022 |
| 23 | 331735 | 331445.822405934 | 289.177594066029 |
| 24 | 328047 | 328489.820456986 | -442.820456985822 |
| 25 | 326165 | 325360.354884297 | 804.645115702978 |
| 26 | 327081 | 325742.423239547 | 1338.57676045265 |
| 27 | 346764 | 345360.205435152 | 1403.79456484809 |
| 28 | 344190 | 345025.373348114 | -835.373348114505 |
| 29 | 343333 | 341221.443975107 | 2111.55602489277 |
| 30 | 345777 | 343370.303266961 | 2406.69673303912 |
| 31 | 344094 | 340140.144772061 | 3953.85522793919 |
| 32 | 348609 | 348915.242056091 | -306.242056091246 |
| 33 | 354846 | 355346.157803148 | -500.157803147705 |
| 34 | 356427 | 356604.638622906 | -177.63862290585 |
| 35 | 353467 | 352553.656523993 | 913.343476007163 |
| 36 | 355996 | 352112.180952915 | 3883.81904708533 |
| 37 | 352487 | 350830.142410579 | 1656.85758942143 |
| 38 | 355178 | 352298.416131387 | 2879.58386861305 |
| 39 | 374556 | 374691.807854988 | -135.807854988002 |
| 40 | 375021 | 373137.467780870 | 1883.53221912957 |
| 41 | 375787 | 371652.923577312 | 4134.07642268766 |
| 42 | 372720 | 369778.143278275 | 2941.85672172550 |
| 43 | 364431 | 359871.215686351 | 4559.78431364924 |
| 44 | 370490 | 367430.908145509 | 3059.09185449054 |
| 45 | 376974 | 374456.918373107 | 2517.08162689259 |
| 46 | 377632 | 377066.062671388 | 565.937328611743 |
| 47 | 378205 | 375375.815537097 | 2829.18446290288 |
| 48 | 370861 | 370862.073411086 | -1.0734110864272 |
| 49 | 369167 | 365173.886163525 | 3993.11383647512 |
| 50 | 371551 | 368821.81342917 | 2729.18657082995 |
| 51 | 382842 | 383362.683149536 | -520.683149536432 |
| 52 | 381903 | 384424.438554914 | -2521.43855491353 |
| 53 | 384502 | 384124.503335237 | 377.496664763145 |
| 54 | 392058 | 388133.64321254 | 3924.35678745983 |
| 55 | 384359 | 385759.162811686 | -1400.16281168602 |
| 56 | 388884 | 390294.450617333 | -1410.45061733278 |
| 57 | 386586 | 390983.801873495 | -4397.80187349523 |
| 58 | 387495 | 386561.188417303 | 933.811582697123 |
| 59 | 385705 | 385657.895500574 | 47.1044994259362 |
| 60 | 378670 | 379893.250262768 | -1223.25026276788 |
| 61 | 377367 | 377738.809022558 | -371.809022558154 |
| 62 | 376911 | 379058.531705974 | -2147.53170597386 |
| 63 | 389827 | 393390.277230523 | -3563.27723052262 |
| 64 | 387820 | 390913.259130312 | -3093.25913031164 |
| 65 | 387267 | 388391.908228080 | -1124.90822808045 |
| 66 | 380575 | 384676.335340228 | -4101.33534022829 |
| 67 | 372402 | 375521.791773008 | -3119.79177300787 |
| 68 | 376740 | 381214.920421459 | -4474.92042145895 |
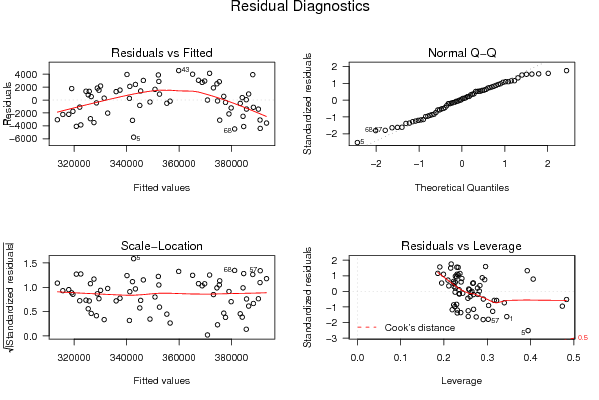
| Goldfeld-Quandt test for Heteroskedasticity | |||
| p-values | Alternative Hypothesis | ||
| breakpoint index | greater | 2-sided | less |
| 21 | 0.213464633058115 | 0.42692926611623 | 0.786535366941885 |
| 22 | 0.177298904143395 | 0.354597808286789 | 0.822701095856605 |
| 23 | 0.32655072462697 | 0.65310144925394 | 0.67344927537303 |
| 24 | 0.298686649910441 | 0.597373299820882 | 0.701313350089559 |
| 25 | 0.364781489580082 | 0.729562979160164 | 0.635218510419918 |
| 26 | 0.302013684721280 | 0.604027369442559 | 0.697986315278720 |
| 27 | 0.910613330437333 | 0.178773339125334 | 0.0893866695626672 |
| 28 | 0.937143548241273 | 0.125712903517454 | 0.062856451758727 |
| 29 | 0.905547248302536 | 0.188905503394929 | 0.0944527516974643 |
| 30 | 0.862560090896088 | 0.274879818207825 | 0.137439909103912 |
| 31 | 0.799505326016185 | 0.40098934796763 | 0.200494673983815 |
| 32 | 0.859296701138353 | 0.281406597723295 | 0.140703298861647 |
| 33 | 0.822198769766059 | 0.355602460467881 | 0.177801230233941 |
| 34 | 0.748843435039151 | 0.502313129921698 | 0.251156564960849 |
| 35 | 0.774728957525867 | 0.450542084948266 | 0.225271042474133 |
| 36 | 0.759179619929041 | 0.481640760141918 | 0.240820380070959 |
| 37 | 0.749345968237198 | 0.501308063525603 | 0.250654031762802 |
| 38 | 0.728725819251568 | 0.542548361496865 | 0.271274180748432 |
| 39 | 0.839872081578054 | 0.320255836843891 | 0.160127918421946 |
| 40 | 0.7865629626518 | 0.4268740746964 | 0.2134370373482 |
| 41 | 0.701674537616568 | 0.596650924766865 | 0.298325462383432 |
| 42 | 0.592512409329291 | 0.814975181341419 | 0.407487590670709 |
| 43 | 0.50405582813052 | 0.99188834373896 | 0.49594417186948 |
| 44 | 0.396883899770071 | 0.793767799540142 | 0.603116100229929 |
| 45 | 0.298553147691187 | 0.597106295382374 | 0.701446852308813 |
| 46 | 0.265654504151218 | 0.531309008302435 | 0.734345495848782 |
| 47 | 0.161279252498087 | 0.322558504996175 | 0.838720747501913 |
| Meta Analysis of Goldfeld-Quandt test for Heteroskedasticity | |||
| Description | # significant tests | % significant tests | OK/NOK |
| 1% type I error level | 0 | 0 | OK |
| 5% type I error level | 0 | 0 | OK |
| 10% type I error level | 0 | 0 | OK |