| Multiple Linear Regression - Estimated Regression Equation |
| Y[t] = + 879.344444444444 -48.3777777777777X[t] + e[t] |
| Multiple Linear Regression - Ordinary Least Squares | |||||
| Variable | Parameter | S.D. | T-STAT H0: parameter = 0 | 2-tail p-value | 1-tail p-value |
| (Intercept) | 879.344444444444 | 12.212258 | 72.0051 | 0 | 0 |
| X | -48.3777777777777 | 19.309275 | -2.5054 | 0.01506 | 0.00753 |
| Multiple Linear Regression - Regression Statistics | |
| Multiple R | 0.312501253514239 |
| R-squared | 0.0976570334479704 |
| Adjusted R-squared | 0.0820993960936252 |
| F-TEST (value) | 6.27711208480472 |
| F-TEST (DF numerator) | 1 |
| F-TEST (DF denominator) | 58 |
| p-value | 0.0150603190912271 |
| Multiple Linear Regression - Residual Statistics | |
| Residual Standard Deviation | 73.2735477299609 |
| Sum Squared Residuals | 311402.742222222 |
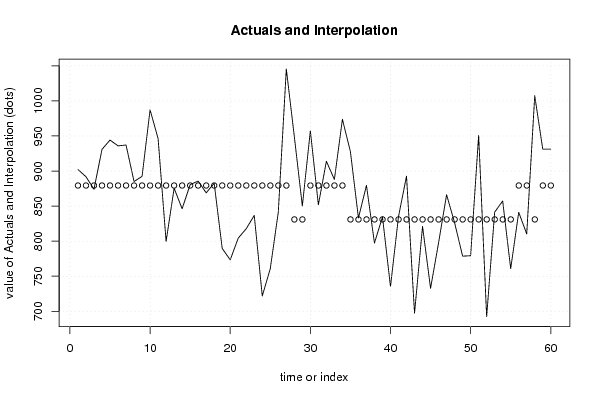
| Multiple Linear Regression - Actuals, Interpolation, and Residuals | |||
| Time or Index | Actuals | Interpolation Forecast | Residuals Prediction Error |
| 1 | 902.2 | 879.344444444447 | 22.8555555555531 |
| 2 | 891.9 | 879.344444444444 | 12.5555555555556 |
| 3 | 874 | 879.344444444444 | -5.34444444444436 |
| 4 | 930.9 | 879.344444444444 | 51.5555555555556 |
| 5 | 944.2 | 879.344444444444 | 64.8555555555557 |
| 6 | 935.9 | 879.344444444444 | 56.5555555555556 |
| 7 | 937.1 | 879.344444444444 | 57.7555555555557 |
| 8 | 885.1 | 879.344444444444 | 5.75555555555566 |
| 9 | 892.4 | 879.344444444444 | 13.0555555555556 |
| 10 | 987.3 | 879.344444444444 | 107.955555555556 |
| 11 | 946.3 | 879.344444444444 | 66.9555555555556 |
| 12 | 799.6 | 879.344444444444 | -79.7444444444443 |
| 13 | 875.4 | 879.344444444444 | -3.94444444444439 |
| 14 | 846.2 | 879.344444444444 | -33.1444444444443 |
| 15 | 880.6 | 879.344444444444 | 1.25555555555566 |
| 16 | 885.7 | 879.344444444444 | 6.35555555555568 |
| 17 | 868.9 | 879.344444444444 | -10.4444444444444 |
| 18 | 882.5 | 879.344444444444 | 3.15555555555564 |
| 19 | 789.6 | 879.344444444444 | -89.7444444444443 |
| 20 | 773.3 | 879.344444444444 | -106.044444444444 |
| 21 | 804.3 | 879.344444444444 | -75.0444444444444 |
| 22 | 817.8 | 879.344444444444 | -61.5444444444444 |
| 23 | 836.7 | 879.344444444444 | -42.6444444444443 |
| 24 | 721.8 | 879.344444444444 | -157.544444444444 |
| 25 | 760.8 | 879.344444444444 | -118.544444444444 |
| 26 | 841.4 | 879.344444444444 | -37.9444444444444 |
| 27 | 1045.6 | 879.344444444444 | 166.255555555556 |
| 28 | 949.2 | 830.966666666667 | 118.233333333333 |
| 29 | 850.1 | 830.966666666667 | 19.1333333333334 |
| 30 | 957.4 | 879.344444444444 | 78.0555555555556 |
| 31 | 851.8 | 879.344444444444 | -27.5444444444444 |
| 32 | 913.9 | 879.344444444444 | 34.5555555555556 |
| 33 | 888 | 879.344444444444 | 8.65555555555564 |
| 34 | 973.8 | 879.344444444444 | 94.4555555555556 |
| 35 | 927.6 | 830.966666666667 | 96.6333333333334 |
| 36 | 833 | 830.966666666667 | 2.03333333333333 |
| 37 | 879.5 | 830.966666666667 | 48.5333333333333 |
| 38 | 797.3 | 830.966666666667 | -33.6666666666667 |
| 39 | 834.5 | 830.966666666667 | 3.53333333333333 |
| 40 | 735.1 | 830.966666666667 | -95.8666666666666 |
| 41 | 835 | 830.966666666667 | 4.03333333333333 |
| 42 | 892.8 | 830.966666666667 | 61.8333333333333 |
| 43 | 697.2 | 830.966666666667 | -133.766666666667 |
| 44 | 821.1 | 830.966666666667 | -9.86666666666665 |
| 45 | 732.7 | 830.966666666667 | -98.2666666666666 |
| 46 | 797.6 | 830.966666666667 | -33.3666666666666 |
| 47 | 866.3 | 830.966666666667 | 35.3333333333333 |
| 48 | 826.3 | 830.966666666667 | -4.66666666666672 |
| 49 | 778.6 | 830.966666666667 | -52.3666666666666 |
| 50 | 779.2 | 830.966666666667 | -51.7666666666666 |
| 51 | 951 | 830.966666666667 | 120.033333333333 |
| 52 | 692.3 | 830.966666666667 | -138.666666666667 |
| 53 | 841.4 | 830.966666666667 | 10.4333333333333 |
| 54 | 857.3 | 830.966666666667 | 26.3333333333333 |
| 55 | 760.7 | 830.966666666667 | -70.2666666666666 |
| 56 | 841.2 | 879.344444444444 | -38.1444444444443 |
| 57 | 810.3 | 879.344444444444 | -69.0444444444444 |
| 58 | 1007.4 | 830.966666666667 | 176.433333333333 |
| 59 | 931.3 | 879.344444444444 | 51.9555555555556 |
| 60 | 931.2 | 879.344444444444 | 51.8555555555557 |
| Goldfeld-Quandt test for Heteroskedasticity | |||
| p-values | Alternative Hypothesis | ||
| breakpoint index | greater | 2-sided | less |
| 5 | 0.0980985137088883 | 0.196197027417777 | 0.901901486291112 |
| 6 | 0.0469888077638944 | 0.0939776155277887 | 0.953011192236106 |
| 7 | 0.0214353527312179 | 0.0428707054624358 | 0.978564647268782 |
| 8 | 0.0115113682628098 | 0.0230227365256195 | 0.98848863173719 |
| 9 | 0.00477060494822676 | 0.00954120989645351 | 0.995229395051773 |
| 10 | 0.0176590143833917 | 0.0353180287667834 | 0.982340985616608 |
| 11 | 0.0104423785991855 | 0.0208847571983710 | 0.989557621400814 |
| 12 | 0.0755150520699445 | 0.151030104139889 | 0.924484947930055 |
| 13 | 0.051109310716038 | 0.102218621432076 | 0.948890689283962 |
| 14 | 0.0468557965292793 | 0.0937115930585585 | 0.95314420347072 |
| 15 | 0.0287073368630036 | 0.0574146737260073 | 0.971292663136996 |
| 16 | 0.0165585742754063 | 0.0331171485508126 | 0.983441425724594 |
| 17 | 0.0102840854893288 | 0.0205681709786576 | 0.989715914510671 |
| 18 | 0.0056140901780003 | 0.0112281803560006 | 0.994385909822 |
| 19 | 0.0165242118682728 | 0.0330484237365455 | 0.983475788131727 |
| 20 | 0.0444531436397962 | 0.0889062872795925 | 0.955546856360204 |
| 21 | 0.0510155193055026 | 0.102031038611005 | 0.948984480694497 |
| 22 | 0.047126285803272 | 0.094252571606544 | 0.952873714196728 |
| 23 | 0.0356882356907258 | 0.0713764713814515 | 0.964311764309274 |
| 24 | 0.155293396571060 | 0.310586793142119 | 0.84470660342894 |
| 25 | 0.250992789027719 | 0.501985578055438 | 0.749007210972281 |
| 26 | 0.215153165109709 | 0.430306330219417 | 0.784846834890291 |
| 27 | 0.485489228371542 | 0.970978456743084 | 0.514510771628458 |
| 28 | 0.501465507016909 | 0.997068985966183 | 0.498534492983091 |
| 29 | 0.466191671723719 | 0.932383343447439 | 0.53380832827628 |
| 30 | 0.465507534394849 | 0.931015068789698 | 0.534492465605151 |
| 31 | 0.40687328950342 | 0.81374657900684 | 0.59312671049658 |
| 32 | 0.345854966333339 | 0.691709932666677 | 0.654145033666661 |
| 33 | 0.279273538792405 | 0.55854707758481 | 0.720726461207595 |
| 34 | 0.311545053420367 | 0.623090106840735 | 0.688454946579633 |
| 35 | 0.32077923435525 | 0.6415584687105 | 0.67922076564475 |
| 36 | 0.278644721307343 | 0.557289442614686 | 0.721355278692657 |
| 37 | 0.240516552686317 | 0.481033105372635 | 0.759483447313683 |
| 38 | 0.215118266769451 | 0.430236533538903 | 0.784881733230549 |
| 39 | 0.167981553116445 | 0.335963106232889 | 0.832018446883555 |
| 40 | 0.211152495010323 | 0.422304990020645 | 0.788847504989677 |
| 41 | 0.158979308496635 | 0.31795861699327 | 0.841020691503365 |
| 42 | 0.144444429413793 | 0.288888858827586 | 0.855555570586207 |
| 43 | 0.256084898815458 | 0.512169797630915 | 0.743915101184542 |
| 44 | 0.192916444132741 | 0.385832888265483 | 0.807083555867259 |
| 45 | 0.227122308435387 | 0.454244616870774 | 0.772877691564613 |
| 46 | 0.176385914960700 | 0.352771829921401 | 0.8236140850393 |
| 47 | 0.131579403099512 | 0.263158806199025 | 0.868420596900488 |
| 48 | 0.087904118397873 | 0.175808236795746 | 0.912095881602127 |
| 49 | 0.0690131439615766 | 0.138026287923153 | 0.930986856038423 |
| 50 | 0.0553692991456853 | 0.110738598291371 | 0.944630700854315 |
| 51 | 0.0823732437347665 | 0.164746487469533 | 0.917626756265234 |
| 52 | 0.241046553808561 | 0.482093107617121 | 0.75895344619144 |
| 53 | 0.162748818340156 | 0.325497636680312 | 0.837251181659844 |
| 54 | 0.0972365135065442 | 0.194473027013088 | 0.902763486493456 |
| 55 | 0.517536135177893 | 0.964927729644213 | 0.482463864822107 |
| Meta Analysis of Goldfeld-Quandt test for Heteroskedasticity | |||
| Description | # significant tests | % significant tests | OK/NOK |
| 1% type I error level | 1 | 0.0196078431372549 | NOK |
| 5% type I error level | 9 | 0.176470588235294 | NOK |
| 10% type I error level | 15 | 0.294117647058824 | NOK |