| Multiple Linear Regression - Estimated Regression Equation |
| Y[t] = + 2.19333333333333 + 2.31666666666667X[t] + 0.391111111111108M1[t] + 0.672222222222222M2[t] + 0.773333333333333M3[t] + 0.814444444444445M4[t] + 0.715555555555555M5[t] + 0.696666666666665M6[t] + 0.254444444444444M7[t] + 0.0955555555555554M8[t] + 0.0966666666666665M9[t] + 0.0177777777777775M10[t] + 0.0988888888888882M11[t] -0.0211111111111111t + e[t] |
| Multiple Linear Regression - Ordinary Least Squares | |||||
| Variable | Parameter | S.D. | T-STAT H0: parameter = 0 | 2-tail p-value | 1-tail p-value |
| (Intercept) | 2.19333333333333 | 0.515713 | 4.253 | 0.000102 | 5.1e-05 |
| X | 2.31666666666667 | 0.44222 | 5.2387 | 4e-06 | 2e-06 |
| M1 | 0.391111111111108 | 0.59861 | 0.6534 | 0.516774 | 0.258387 |
| M2 | 0.672222222222222 | 0.597589 | 1.1249 | 0.266471 | 0.133235 |
| M3 | 0.773333333333333 | 0.596793 | 1.2958 | 0.201503 | 0.100752 |
| M4 | 0.814444444444445 | 0.596223 | 1.366 | 0.178579 | 0.089289 |
| M5 | 0.715555555555555 | 0.595882 | 1.2008 | 0.235962 | 0.117981 |
| M6 | 0.696666666666665 | 0.595768 | 1.1694 | 0.248283 | 0.124141 |
| M7 | 0.254444444444444 | 0.596155 | 0.4268 | 0.671509 | 0.335755 |
| M8 | 0.0955555555555554 | 0.595129 | 0.1606 | 0.873141 | 0.43657 |
| M9 | 0.0966666666666665 | 0.59433 | 0.1626 | 0.871508 | 0.435754 |
| M10 | 0.0177777777777775 | 0.593758 | 0.0299 | 0.976244 | 0.488122 |
| M11 | 0.0988888888888882 | 0.593415 | 0.1666 | 0.868381 | 0.43419 |
| t | -0.0211111111111111 | 0.011654 | -1.8116 | 0.076585 | 0.038293 |
| Multiple Linear Regression - Regression Statistics | |
| Multiple R | 0.698672819377352 |
| R-squared | 0.488143708536698 |
| Adjusted R-squared | 0.343488669644896 |
| F-TEST (value) | 3.37453649922153 |
| F-TEST (DF numerator) | 13 |
| F-TEST (DF denominator) | 46 |
| p-value | 0.00112376002416636 |
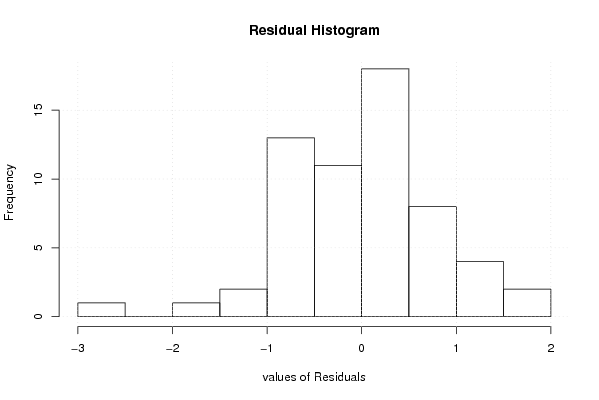
| Multiple Linear Regression - Residual Statistics | |
| Residual Standard Deviation | 0.938090876596518 |
| Sum Squared Residuals | 40.4806666666667 |
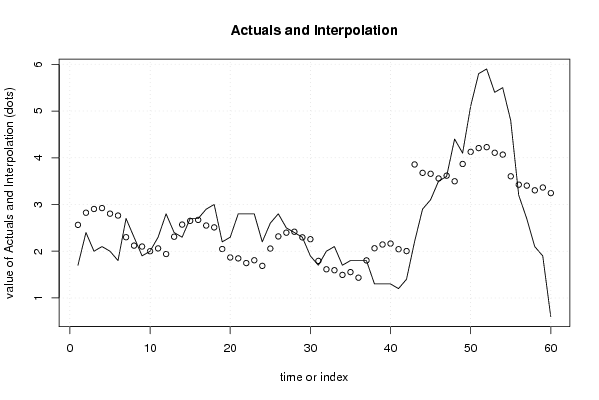
| Multiple Linear Regression - Actuals, Interpolation, and Residuals | |||
| Time or Index | Actuals | Interpolation Forecast | Residuals Prediction Error |
| 1 | 1.7 | 2.56333333333334 | -0.86333333333334 |
| 2 | 2.4 | 2.82333333333333 | -0.423333333333331 |
| 3 | 2 | 2.90333333333333 | -0.903333333333332 |
| 4 | 2.1 | 2.92333333333333 | -0.823333333333334 |
| 5 | 2 | 2.80333333333333 | -0.803333333333332 |
| 6 | 1.8 | 2.76333333333333 | -0.963333333333334 |
| 7 | 2.7 | 2.3 | 0.400000000000002 |
| 8 | 2.3 | 2.12 | 0.180000000000000 |
| 9 | 1.9 | 2.1 | -0.2 |
| 10 | 2 | 2 | 1.66533453693773e-16 |
| 11 | 2.3 | 2.06 | 0.24 |
| 12 | 2.8 | 1.94 | 0.86 |
| 13 | 2.4 | 2.31 | 0.0900000000000015 |
| 14 | 2.3 | 2.57 | -0.270000000000001 |
| 15 | 2.7 | 2.65 | 0.0499999999999999 |
| 16 | 2.7 | 2.67 | 0.0300000000000005 |
| 17 | 2.9 | 2.55 | 0.35 |
| 18 | 3 | 2.51 | 0.490000000000001 |
| 19 | 2.2 | 2.04666666666667 | 0.153333333333334 |
| 20 | 2.3 | 1.86666666666667 | 0.433333333333333 |
| 21 | 2.8 | 1.84666666666667 | 0.953333333333333 |
| 22 | 2.8 | 1.74666666666667 | 1.05333333333333 |
| 23 | 2.8 | 1.80666666666667 | 0.993333333333333 |
| 24 | 2.2 | 1.68666666666667 | 0.513333333333333 |
| 25 | 2.6 | 2.05666666666666 | 0.543333333333335 |
| 26 | 2.8 | 2.31666666666667 | 0.483333333333333 |
| 27 | 2.5 | 2.39666666666667 | 0.103333333333333 |
| 28 | 2.4 | 2.41666666666667 | -0.0166666666666666 |
| 29 | 2.3 | 2.29666666666667 | 0.00333333333333302 |
| 30 | 1.9 | 2.25666666666667 | -0.356666666666666 |
| 31 | 1.7 | 1.79333333333333 | -0.0933333333333333 |
| 32 | 2 | 1.61333333333333 | 0.386666666666666 |
| 33 | 2.1 | 1.59333333333333 | 0.506666666666666 |
| 34 | 1.7 | 1.49333333333333 | 0.206666666666666 |
| 35 | 1.8 | 1.55333333333333 | 0.246666666666667 |
| 36 | 1.8 | 1.43333333333333 | 0.366666666666666 |
| 37 | 1.8 | 1.80333333333333 | -0.00333333333333195 |
| 38 | 1.3 | 2.06333333333333 | -0.763333333333334 |
| 39 | 1.3 | 2.14333333333333 | -0.843333333333334 |
| 40 | 1.3 | 2.16333333333333 | -0.863333333333333 |
| 41 | 1.2 | 2.04333333333333 | -0.843333333333334 |
| 42 | 1.4 | 2.00333333333333 | -0.603333333333333 |
| 43 | 2.2 | 3.85666666666667 | -1.65666666666667 |
| 44 | 2.9 | 3.67666666666667 | -0.776666666666667 |
| 45 | 3.1 | 3.65666666666667 | -0.556666666666667 |
| 46 | 3.5 | 3.55666666666667 | -0.0566666666666667 |
| 47 | 3.6 | 3.61666666666667 | -0.0166666666666663 |
| 48 | 4.4 | 3.49666666666667 | 0.903333333333333 |
| 49 | 4.1 | 3.86666666666666 | 0.233333333333335 |
| 50 | 5.1 | 4.12666666666667 | 0.973333333333333 |
| 51 | 5.8 | 4.20666666666667 | 1.59333333333333 |
| 52 | 5.9 | 4.22666666666667 | 1.67333333333333 |
| 53 | 5.4 | 4.10666666666667 | 1.29333333333333 |
| 54 | 5.5 | 4.06666666666667 | 1.43333333333333 |
| 55 | 4.8 | 3.60333333333333 | 1.19666666666667 |
| 56 | 3.2 | 3.42333333333333 | -0.223333333333334 |
| 57 | 2.7 | 3.40333333333333 | -0.703333333333334 |
| 58 | 2.1 | 3.30333333333333 | -1.20333333333333 |
| 59 | 1.9 | 3.36333333333333 | -1.46333333333333 |
| 60 | 0.6 | 3.24333333333333 | -2.64333333333333 |
| Goldfeld-Quandt test for Heteroskedasticity | |||
| p-values | Alternative Hypothesis | ||
| breakpoint index | greater | 2-sided | less |
| 17 | 0.043037081809525 | 0.08607416361905 | 0.956962918190475 |
| 18 | 0.0262032992933039 | 0.0524065985866079 | 0.973796700706696 |
| 19 | 0.0451234289975354 | 0.0902468579950709 | 0.954876571002465 |
| 20 | 0.0221883398429926 | 0.0443766796859851 | 0.977811660157007 |
| 21 | 0.0105063715043277 | 0.0210127430086554 | 0.989493628495672 |
| 22 | 0.00440627913126174 | 0.00881255826252349 | 0.995593720868738 |
| 23 | 0.00160579744759499 | 0.00321159489518999 | 0.998394202552405 |
| 24 | 0.00247881108281684 | 0.00495762216563369 | 0.997521188917183 |
| 25 | 0.000891019436875723 | 0.00178203887375145 | 0.999108980563124 |
| 26 | 0.00031060863899125 | 0.0006212172779825 | 0.99968939136101 |
| 27 | 0.000141560111038614 | 0.000283120222077228 | 0.999858439888961 |
| 28 | 7.69962916701483e-05 | 0.000153992583340297 | 0.99992300370833 |
| 29 | 4.72658269742324e-05 | 9.45316539484647e-05 | 0.999952734173026 |
| 30 | 7.0002883637721e-05 | 0.000140005767275442 | 0.999929997116362 |
| 31 | 9.36543726337404e-05 | 0.000187308745267481 | 0.999906345627366 |
| 32 | 5.24932600055746e-05 | 0.000104986520011149 | 0.999947506739994 |
| 33 | 3.35445007176023e-05 | 6.70890014352047e-05 | 0.999966455499282 |
| 34 | 3.80249155590266e-05 | 7.60498311180533e-05 | 0.99996197508444 |
| 35 | 6.157440915633e-05 | 0.00012314881831266 | 0.999938425590844 |
| 36 | 0.000267590646308785 | 0.00053518129261757 | 0.999732409353691 |
| 37 | 0.000281492509836661 | 0.000562985019673323 | 0.999718507490163 |
| 38 | 0.000334499759329283 | 0.000668999518658566 | 0.99966550024067 |
| 39 | 0.000232552859223209 | 0.000465105718446418 | 0.999767447140777 |
| 40 | 0.000137419599191941 | 0.000274839198383883 | 0.999862580400808 |
| 41 | 7.34083723223419e-05 | 0.000146816744644684 | 0.999926591627678 |
| 42 | 2.32832942647783e-05 | 4.65665885295566e-05 | 0.999976716705735 |
| 43 | 0.00222171629940108 | 0.00444343259880216 | 0.997778283700599 |
| Meta Analysis of Goldfeld-Quandt test for Heteroskedasticity | |||
| Description | # significant tests | % significant tests | OK/NOK |
| 1% type I error level | 22 | 0.814814814814815 | NOK |
| 5% type I error level | 24 | 0.888888888888889 | NOK |
| 10% type I error level | 27 | 1 | NOK |