| Multiple Linear Regression - Estimated Regression Equation |
| Consvertr[t] = -2.54623902332245 + 0.0061421420368986Aand[t] + 0.609520892164507M1[t] -0.280403213295958M2[t] + 1.75852696995038M3[t] + 0.577457909719086M4[t] + 1.42655819316205M5[t] + 0.676750919876607M6[t] + 0.879589447508637M7[t] -1.76292560165979M8[t] -2.55132966649962M9[t] + 0.0562001706321281M10[t] + 0.551095836096717M11[t] + e[t] |
| Multiple Linear Regression - Ordinary Least Squares | |||||
| Variable | Parameter | S.D. | T-STAT H0: parameter = 0 | 2-tail p-value | 1-tail p-value |
| (Intercept) | -2.54623902332245 | 3.479677 | -0.7317 | 0.467881 | 0.233941 |
| Aand | 0.0061421420368986 | 0.000795 | 7.722 | 0 | 0 |
| M1 | 0.609520892164507 | 3.036513 | 0.2007 | 0.841757 | 0.420879 |
| M2 | -0.280403213295958 | 3.175646 | -0.0883 | 0.930007 | 0.465004 |
| M3 | 1.75852696995038 | 3.172402 | 0.5543 | 0.581933 | 0.290967 |
| M4 | 0.577457909719086 | 3.171445 | 0.1821 | 0.856286 | 0.428143 |
| M5 | 1.42655819316205 | 3.171394 | 0.4498 | 0.654865 | 0.327432 |
| M6 | 0.676750919876607 | 3.172038 | 0.2133 | 0.831958 | 0.415979 |
| M7 | 0.879589447508637 | 3.171353 | 0.2774 | 0.782699 | 0.391349 |
| M8 | -1.76292560165979 | 3.171463 | -0.5559 | 0.580881 | 0.29044 |
| M9 | -2.55132966649962 | 3.171321 | -0.8045 | 0.425075 | 0.212537 |
| M10 | 0.0562001706321281 | 3.171369 | 0.0177 | 0.985935 | 0.492967 |
| M11 | 0.551095836096717 | 3.171478 | 0.1738 | 0.86278 | 0.43139 |
| Multiple Linear Regression - Regression Statistics | |
| Multiple R | 0.755982426459113 |
| R-squared | 0.571509429115009 |
| Adjusted R-squared | 0.464386786393761 |
| F-TEST (value) | 5.33509456634839 |
| F-TEST (DF numerator) | 12 |
| F-TEST (DF denominator) | 48 |
| p-value | 1.24190173838024e-05 |
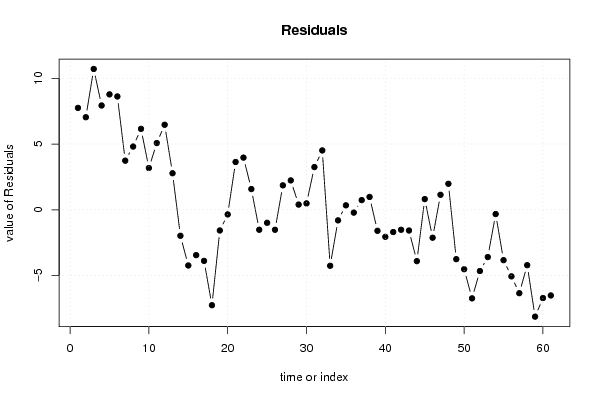
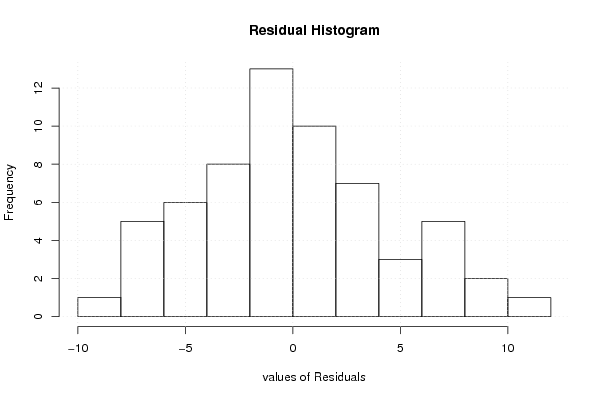
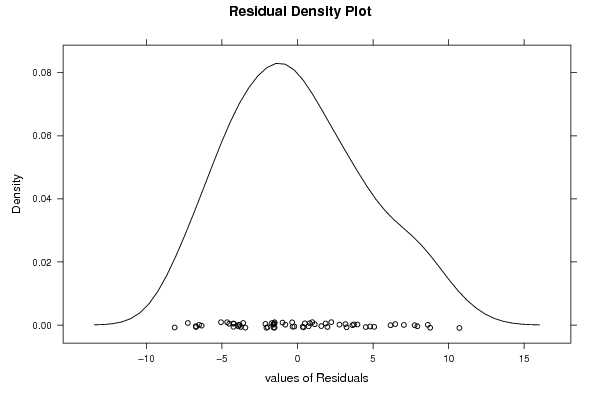
| Multiple Linear Regression - Residual Statistics | |
| Residual Standard Deviation | 5.01428849726404 |
| Sum Squared Residuals | 1206.86827842214 |
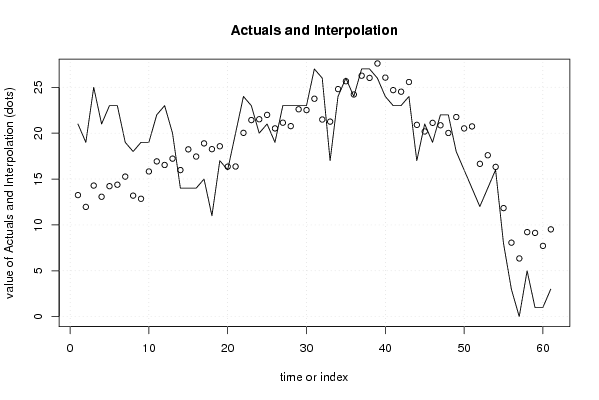
| Multiple Linear Regression - Actuals, Interpolation, and Residuals | |||
| Time or Index | Actuals | Interpolation Forecast | Residuals Prediction Error |
| 1 | 21 | 13.2516321191053 | 7.74836788089471 |
| 2 | 19 | 11.9611789314187 | 7.03882106858135 |
| 3 | 25 | 14.2889126332400 | 10.7110873667600 |
| 4 | 21 | 13.0674896998262 | 7.93251030017375 |
| 5 | 23 | 14.2224072352864 | 8.7775927647136 |
| 6 | 23 | 14.3804085550546 | 8.61959144494545 |
| 7 | 19 | 15.2657619058268 | 3.73423809417324 |
| 8 | 18 | 13.1914564164918 | 4.80854358350818 |
| 9 | 19 | 12.8463307424550 | 6.15366925754504 |
| 10 | 19 | 15.8249073800358 | 3.17509261996425 |
| 11 | 22 | 16.9262167288033 | 5.07378327119665 |
| 12 | 23 | 16.5326054145327 | 6.4673945854673 |
| 13 | 20 | 17.2225269459602 | 2.77747305403978 |
| 14 | 14 | 15.9760514952578 | -1.97605149525779 |
| 15 | 14 | 18.2364058989343 | -4.23640589893432 |
| 16 | 14 | 17.4507679430386 | -3.45076794303856 |
| 17 | 15 | 18.8862585267442 | -3.88625852674423 |
| 18 | 11 | 18.2583727728912 | -7.25837277289122 |
| 19 | 17 | 18.5736739212189 | -1.57367392121887 |
| 20 | 16 | 16.3529397657243 | -0.352939765724267 |
| 21 | 20 | 16.3641197512479 | 3.6358802487521 |
| 22 | 24 | 20.0333802608779 | 3.96661973912206 |
| 23 | 23 | 21.4252129279908 | 1.57478707200917 |
| 24 | 20 | 21.5184277915648 | -1.51842779156477 |
| 25 | 21 | 21.9900575950009 | -0.990057595000907 |
| 26 | 19 | 20.5200081741554 | -1.52000817415537 |
| 27 | 23 | 21.1404720754003 | 1.85952792459965 |
| 28 | 23 | 20.7670332716009 | 2.23296672839915 |
| 29 | 23 | 22.6029300946919 | 0.397069905308057 |
| 30 | 23 | 22.5154299972453 | 0.484570002754728 |
| 31 | 27 | 23.7527280867318 | 3.24727191326823 |
| 32 | 26 | 21.4862963944826 | 4.51370360551736 |
| 33 | 17 | 21.2576871548858 | -4.25768715488575 |
| 34 | 24 | 24.8050875665037 | -0.805087566503718 |
| 35 | 26 | 25.6607112337954 | 0.339288766204634 |
| 36 | 24 | 24.214950988604 | -0.214950988603991 |
| 37 | 27 | 26.2635143385935 | 0.736485661406522 |
| 38 | 27 | 26.0227532250128 | 0.97724677498718 |
| 39 | 26 | 27.5975831559511 | -1.59758315595110 |
| 40 | 24 | 26.0568302580390 | -2.05683025803903 |
| 41 | 23 | 24.6927939227467 | -1.69279392274669 |
| 42 | 23 | 24.5201637366686 | -1.52016373666860 |
| 43 | 24 | 25.5751630504999 | -1.57516305049995 |
| 44 | 17 | 20.9054340220531 | -3.90543402205314 |
| 45 | 21 | 20.1876645906376 | 0.812335409362354 |
| 46 | 19 | 21.1233647867460 | -2.12336478674596 |
| 47 | 22 | 20.8596444892332 | 1.14035551076679 |
| 48 | 22 | 20.0224476770578 | 1.97755232294225 |
| 49 | 18 | 21.7573318332228 | -3.75733183322282 |
| 50 | 16 | 20.5200081741554 | -4.52000817415537 |
| 51 | 14 | 20.7366262364743 | -6.73662623647426 |
| 52 | 12 | 16.6578788274953 | -4.65787882749532 |
| 53 | 14 | 17.5956102205307 | -3.59561022053073 |
| 54 | 16 | 16.3256249381403 | -0.325624938140343 |
| 55 | 8 | 11.8326730357227 | -3.83267303572266 |
| 56 | 3 | 8.06387340124813 | -5.06387340124813 |
| 57 | 0 | 6.34419776077374 | -6.34419776077374 |
| 58 | 5 | 9.21326000583663 | -4.21326000583663 |
| 59 | 1 | 9.12821462017726 | -8.12821462017726 |
| 60 | 1 | 7.71156812824078 | -6.71156812824078 |
| 61 | 3 | 9.51493716811727 | -6.51493716811727 |
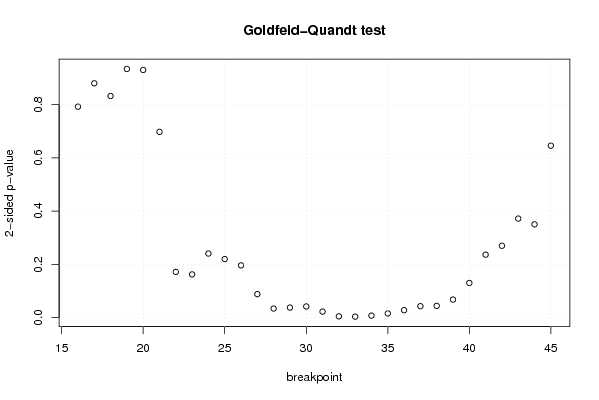
| Goldfeld-Quandt test for Heteroskedasticity | |||
| p-values | Alternative Hypothesis | ||
| breakpoint index | greater | 2-sided | less |
| 16 | 0.603801658701031 | 0.792396682597938 | 0.396198341298969 |
| 17 | 0.440081188389555 | 0.88016237677911 | 0.559918811610445 |
| 18 | 0.583774238933011 | 0.832451522133978 | 0.416225761066989 |
| 19 | 0.532931215638896 | 0.934137568722208 | 0.467068784361104 |
| 20 | 0.465176475811577 | 0.930352951623153 | 0.534823524188423 |
| 21 | 0.65103566925367 | 0.697928661492658 | 0.348964330746329 |
| 22 | 0.914156102432267 | 0.171687795135466 | 0.085843897567733 |
| 23 | 0.918912635458432 | 0.162174729083135 | 0.0810873645415675 |
| 24 | 0.87973559826693 | 0.240528803466142 | 0.120264401733071 |
| 25 | 0.89012698181446 | 0.219746036371081 | 0.109873018185540 |
| 26 | 0.901891923506315 | 0.196216152987370 | 0.0981080764936852 |
| 27 | 0.955927426496677 | 0.0881451470066467 | 0.0440725735033233 |
| 28 | 0.98298781708092 | 0.0340243658381601 | 0.0170121829190800 |
| 29 | 0.981270809227924 | 0.0374583815441519 | 0.0187291907720759 |
| 30 | 0.979128338545642 | 0.0417433229087159 | 0.0208716614543579 |
| 31 | 0.988856975702336 | 0.0222860485953271 | 0.0111430242976635 |
| 32 | 0.997664826876392 | 0.00467034624721592 | 0.00233517312360796 |
| 33 | 0.998271835845545 | 0.0034563283089101 | 0.00172816415445505 |
| 34 | 0.996338295795995 | 0.00732340840800958 | 0.00366170420400479 |
| 35 | 0.992243572928488 | 0.0155128541430249 | 0.00775642707151247 |
| 36 | 0.986080628513796 | 0.0278387429724074 | 0.0139193714862037 |
| 37 | 0.978625033343156 | 0.0427499333136877 | 0.0213749666568438 |
| 38 | 0.977991124953334 | 0.0440177500933315 | 0.0220088750466658 |
| 39 | 0.966198403559523 | 0.0676031928809541 | 0.0338015964404771 |
| 40 | 0.93498640973738 | 0.130027180525239 | 0.0650135902626197 |
| 41 | 0.881838797131366 | 0.236322405737268 | 0.118161202868634 |
| 42 | 0.865082462583303 | 0.269835074833394 | 0.134917537416697 |
| 43 | 0.814025158619457 | 0.371949682761087 | 0.185974841380543 |
| 44 | 0.824818792678278 | 0.350362414643445 | 0.175181207321723 |
| 45 | 0.677084700825407 | 0.645830598349187 | 0.322915299174593 |
| Meta Analysis of Goldfeld-Quandt test for Heteroskedasticity | |||
| Description | # significant tests | % significant tests | OK/NOK |
| 1% type I error level | 3 | 0.1 | NOK |
| 5% type I error level | 11 | 0.366666666666667 | NOK |
| 10% type I error level | 13 | 0.433333333333333 | NOK |