Free Statistics

of Irreproducible Research!

Author's title

Author*The author of this computation has been verified*
R Software Modulerwasp_multipleregression.wasp
Title produced by softwareMultiple Regression
Date of computationThu, 19 Nov 2009 00:51:21 -0700
Cite this page as followsStatistical Computations at FreeStatistics.org, Office for Research Development and Education, URL https://freestatistics.org/blog/index.php?v=date/2009/Nov/19/t12586174536nua1u3nk1iug1w.htm/, Retrieved Thu, 25 Apr 2024 04:54:17 +0000
Statistical Computations at FreeStatistics.org, Office for Research Development and Education, URL https://freestatistics.org/blog/index.php?pk=57641, Retrieved Thu, 25 Apr 2024 04:54:17 +0000
QR Codes:

Original text written by user:
IsPrivate?No (this computation is public)
User-defined keywords
Estimated Impact190
Family? (F = Feedback message, R = changed R code, M = changed R Module, P = changed Parameters, D = changed Data)
-     [Multiple Regression] [Q1 The Seatbeltlaw] [2007-11-14 19:27:43] [8cd6641b921d30ebe00b648d1481bba0]
- RMPD  [Multiple Regression] [Seatbelt] [2009-11-12 13:54:52] [b98453cac15ba1066b407e146608df68]
-    D    [Multiple Regression] [] [2009-11-18 16:30:48] [74be16979710d4c4e7c6647856088456]
-   P       [Multiple Regression] [] [2009-11-19 07:41:31] [74be16979710d4c4e7c6647856088456]
-   P           [Multiple Regression] [] [2009-11-19 07:51:21] [d41d8cd98f00b204e9800998ecf8427e] [Current]
Feedback Forum

Post a new message
Dataseries X:
2.085	0
2.053	0
2.077	0
2.058	0
2.057	0
2.076	0
2.07	0
2.062	0
2.073	0
2.061	0
2.094	0
2.067	0
2.086	0
2.276	0
2.326	0
2.349	0
2.52	0
2.628	0
2.577	0
2.698	0
2.814	0
2.968	0
3.041	0
3.278	0
3.328	0
3.5	0
3.563	0
3.569	0
3.69	0
3.819	0
3.79	0
3.956	0
4.063	0
4.047	0
4.029	0
3.941	0
4.022	0
3.879	0
4.022	0
4.028	0
4.091	0
3.987	0
4.01	0
4.007	0
4.191	0
4.299	0
4.273	0
3.82	0
3.15	1
2.486	1
1.812	1
1.257	1
1.062	1
0.842	1
0.782	1
0.698	1
0.358	1
0.347	1
0.363	1
0.359	1
0.355	1


Summary of computational transaction
Raw Inputview raw input (R code)
Raw Outputview raw output of R engine
Computing time3 seconds
R Server'Gwilym Jenkins' @ 72.249.127.135

\begin{tabular}{lllllllll}
\hline
Summary of computational transaction \tabularnewline
Raw Input & view raw input (R code)  \tabularnewline
Raw Output & view raw output of R engine  \tabularnewline
Computing time & 3 seconds \tabularnewline
R Server & 'Gwilym Jenkins' @ 72.249.127.135 \tabularnewline
\hline
\end{tabular}
%Source: https://freestatistics.org/blog/index.php?pk=57641&T=0

[TABLE]
[ROW][C]Summary of computational transaction[/C][/ROW]
[ROW][C]Raw Input[/C][C]view raw input (R code) [/C][/ROW]
[ROW][C]Raw Output[/C][C]view raw output of R engine [/C][/ROW]
[ROW][C]Computing time[/C][C]3 seconds[/C][/ROW]
[ROW][C]R Server[/C][C]'Gwilym Jenkins' @ 72.249.127.135[/C][/ROW]
[/TABLE]
Source: https://freestatistics.org/blog/index.php?pk=57641&T=0

Globally Unique Identifier (entire table): ba.freestatistics.org/blog/index.php?pk=57641&T=0

As an alternative you can also use a QR Code:  

The GUIDs for individual cells are displayed in the table below:

Summary of computational transaction
Raw Inputview raw input (R code)
Raw Outputview raw output of R engine
Computing time3 seconds
R Server'Gwilym Jenkins' @ 72.249.127.135


Multiple Linear Regression - Estimated Regression Equation
intb[t] = + 3.10688684210527 -2.06943421052632x[t] + 0.0872578947368416M1[t] + 0.145799999999998M2[t] + 0.0669999999999987M3[t] -0.0408000000000015M4[t] -0.00900000000000142M5[t] -0.0226000000000013M6[t] -0.0472000000000012M7[t] -0.00880000000000143M8[t] + 0.00679999999999856M9[t] + 0.0513999999999987M10[t] + 0.0669999999999985M11[t] + e[t]

\begin{tabular}{lllllllll}
\hline
Multiple Linear Regression - Estimated Regression Equation \tabularnewline
intb[t] =  +  3.10688684210527 -2.06943421052632x[t] +  0.0872578947368416M1[t] +  0.145799999999998M2[t] +  0.0669999999999987M3[t] -0.0408000000000015M4[t] -0.00900000000000142M5[t] -0.0226000000000013M6[t] -0.0472000000000012M7[t] -0.00880000000000143M8[t] +  0.00679999999999856M9[t] +  0.0513999999999987M10[t] +  0.0669999999999985M11[t]  + e[t] \tabularnewline
\hline
\end{tabular}
%Source: https://freestatistics.org/blog/index.php?pk=57641&T=1

[TABLE]
[ROW][C]Multiple Linear Regression - Estimated Regression Equation[/C][/ROW]
[ROW][C]intb[t] =  +  3.10688684210527 -2.06943421052632x[t] +  0.0872578947368416M1[t] +  0.145799999999998M2[t] +  0.0669999999999987M3[t] -0.0408000000000015M4[t] -0.00900000000000142M5[t] -0.0226000000000013M6[t] -0.0472000000000012M7[t] -0.00880000000000143M8[t] +  0.00679999999999856M9[t] +  0.0513999999999987M10[t] +  0.0669999999999985M11[t]  + e[t][/C][/ROW]
[/TABLE]
Source: https://freestatistics.org/blog/index.php?pk=57641&T=1

Globally Unique Identifier (entire table): ba.freestatistics.org/blog/index.php?pk=57641&T=1

As an alternative you can also use a QR Code:  

The GUIDs for individual cells are displayed in the table below:

Multiple Linear Regression - Estimated Regression Equation
intb[t] = + 3.10688684210527 -2.06943421052632x[t] + 0.0872578947368416M1[t] + 0.145799999999998M2[t] + 0.0669999999999987M3[t] -0.0408000000000015M4[t] -0.00900000000000142M5[t] -0.0226000000000013M6[t] -0.0472000000000012M7[t] -0.00880000000000143M8[t] + 0.00679999999999856M9[t] + 0.0513999999999987M10[t] + 0.0669999999999985M11[t] + e[t]


Multiple Linear Regression - Ordinary Least Squares
VariableParameterS.D.T-STATH0: parameter = 02-tail p-value1-tail p-value
(Intercept)3.106886842105270.4297517.229500
x-2.069434210526320.298938-6.922600
M10.08725789473684160.5776030.15110.8805540.440277
M20.1457999999999980.6018490.24230.8096160.404808
M30.06699999999999870.6018490.11130.9118240.455912
M4-0.04080000000000150.601849-0.06780.9462340.473117
M5-0.009000000000001420.601849-0.0150.9881310.494065
M6-0.02260000000000130.601849-0.03760.9702010.485101
M7-0.04720000000000120.601849-0.07840.9378160.468908
M8-0.008800000000001430.601849-0.01460.9883950.494197
M90.006799999999998560.6018490.01130.9910320.495516
M100.05139999999999870.6018490.08540.9322960.466148
M110.06699999999999850.6018490.11130.9118240.455912

\begin{tabular}{lllllllll}
\hline
Multiple Linear Regression - Ordinary Least Squares \tabularnewline
Variable & Parameter & S.D. & T-STATH0: parameter = 0 & 2-tail p-value & 1-tail p-value \tabularnewline
(Intercept) & 3.10688684210527 & 0.429751 & 7.2295 & 0 & 0 \tabularnewline
x & -2.06943421052632 & 0.298938 & -6.9226 & 0 & 0 \tabularnewline
M1 & 0.0872578947368416 & 0.577603 & 0.1511 & 0.880554 & 0.440277 \tabularnewline
M2 & 0.145799999999998 & 0.601849 & 0.2423 & 0.809616 & 0.404808 \tabularnewline
M3 & 0.0669999999999987 & 0.601849 & 0.1113 & 0.911824 & 0.455912 \tabularnewline
M4 & -0.0408000000000015 & 0.601849 & -0.0678 & 0.946234 & 0.473117 \tabularnewline
M5 & -0.00900000000000142 & 0.601849 & -0.015 & 0.988131 & 0.494065 \tabularnewline
M6 & -0.0226000000000013 & 0.601849 & -0.0376 & 0.970201 & 0.485101 \tabularnewline
M7 & -0.0472000000000012 & 0.601849 & -0.0784 & 0.937816 & 0.468908 \tabularnewline
M8 & -0.00880000000000143 & 0.601849 & -0.0146 & 0.988395 & 0.494197 \tabularnewline
M9 & 0.00679999999999856 & 0.601849 & 0.0113 & 0.991032 & 0.495516 \tabularnewline
M10 & 0.0513999999999987 & 0.601849 & 0.0854 & 0.932296 & 0.466148 \tabularnewline
M11 & 0.0669999999999985 & 0.601849 & 0.1113 & 0.911824 & 0.455912 \tabularnewline
\hline
\end{tabular}
%Source: https://freestatistics.org/blog/index.php?pk=57641&T=2

[TABLE]
[ROW][C]Multiple Linear Regression - Ordinary Least Squares[/C][/ROW]
[ROW][C]Variable[/C][C]Parameter[/C][C]S.D.[/C][C]T-STATH0: parameter = 0[/C][C]2-tail p-value[/C][C]1-tail p-value[/C][/ROW]
[ROW][C](Intercept)[/C][C]3.10688684210527[/C][C]0.429751[/C][C]7.2295[/C][C]0[/C][C]0[/C][/ROW]
[ROW][C]x[/C][C]-2.06943421052632[/C][C]0.298938[/C][C]-6.9226[/C][C]0[/C][C]0[/C][/ROW]
[ROW][C]M1[/C][C]0.0872578947368416[/C][C]0.577603[/C][C]0.1511[/C][C]0.880554[/C][C]0.440277[/C][/ROW]
[ROW][C]M2[/C][C]0.145799999999998[/C][C]0.601849[/C][C]0.2423[/C][C]0.809616[/C][C]0.404808[/C][/ROW]
[ROW][C]M3[/C][C]0.0669999999999987[/C][C]0.601849[/C][C]0.1113[/C][C]0.911824[/C][C]0.455912[/C][/ROW]
[ROW][C]M4[/C][C]-0.0408000000000015[/C][C]0.601849[/C][C]-0.0678[/C][C]0.946234[/C][C]0.473117[/C][/ROW]
[ROW][C]M5[/C][C]-0.00900000000000142[/C][C]0.601849[/C][C]-0.015[/C][C]0.988131[/C][C]0.494065[/C][/ROW]
[ROW][C]M6[/C][C]-0.0226000000000013[/C][C]0.601849[/C][C]-0.0376[/C][C]0.970201[/C][C]0.485101[/C][/ROW]
[ROW][C]M7[/C][C]-0.0472000000000012[/C][C]0.601849[/C][C]-0.0784[/C][C]0.937816[/C][C]0.468908[/C][/ROW]
[ROW][C]M8[/C][C]-0.00880000000000143[/C][C]0.601849[/C][C]-0.0146[/C][C]0.988395[/C][C]0.494197[/C][/ROW]
[ROW][C]M9[/C][C]0.00679999999999856[/C][C]0.601849[/C][C]0.0113[/C][C]0.991032[/C][C]0.495516[/C][/ROW]
[ROW][C]M10[/C][C]0.0513999999999987[/C][C]0.601849[/C][C]0.0854[/C][C]0.932296[/C][C]0.466148[/C][/ROW]
[ROW][C]M11[/C][C]0.0669999999999985[/C][C]0.601849[/C][C]0.1113[/C][C]0.911824[/C][C]0.455912[/C][/ROW]
[/TABLE]
Source: https://freestatistics.org/blog/index.php?pk=57641&T=2

Globally Unique Identifier (entire table): ba.freestatistics.org/blog/index.php?pk=57641&T=2

As an alternative you can also use a QR Code:  

The GUIDs for individual cells are displayed in the table below:

Multiple Linear Regression - Ordinary Least Squares
VariableParameterS.D.T-STATH0: parameter = 02-tail p-value1-tail p-value
(Intercept)3.106886842105270.4297517.229500
x-2.069434210526320.298938-6.922600
M10.08725789473684160.5776030.15110.8805540.440277
M20.1457999999999980.6018490.24230.8096160.404808
M30.06699999999999870.6018490.11130.9118240.455912
M4-0.04080000000000150.601849-0.06780.9462340.473117
M5-0.009000000000001420.601849-0.0150.9881310.494065
M6-0.02260000000000130.601849-0.03760.9702010.485101
M7-0.04720000000000120.601849-0.07840.9378160.468908
M8-0.008800000000001430.601849-0.01460.9883950.494197
M90.006799999999998560.6018490.01130.9910320.495516
M100.05139999999999870.6018490.08540.9322960.466148
M110.06699999999999850.6018490.11130.9118240.455912


Multiple Linear Regression - Regression Statistics
Multiple R0.708445806051584
R-squared0.501895460112078
Adjusted R-squared0.377369325140098
F-TEST (value)4.03044276789775
F-TEST (DF numerator)12
F-TEST (DF denominator)48
p-value0.000253603796910418
Multiple Linear Regression - Residual Statistics
Residual Standard Deviation0.951606738730537
Sum Squared Residuals43.4666584894737

\begin{tabular}{lllllllll}
\hline
Multiple Linear Regression - Regression Statistics \tabularnewline
Multiple R & 0.708445806051584 \tabularnewline
R-squared & 0.501895460112078 \tabularnewline
Adjusted R-squared & 0.377369325140098 \tabularnewline
F-TEST (value) & 4.03044276789775 \tabularnewline
F-TEST (DF numerator) & 12 \tabularnewline
F-TEST (DF denominator) & 48 \tabularnewline
p-value & 0.000253603796910418 \tabularnewline
Multiple Linear Regression - Residual Statistics \tabularnewline
Residual Standard Deviation & 0.951606738730537 \tabularnewline
Sum Squared Residuals & 43.4666584894737 \tabularnewline
\hline
\end{tabular}
%Source: https://freestatistics.org/blog/index.php?pk=57641&T=3

[TABLE]
[ROW][C]Multiple Linear Regression - Regression Statistics[/C][/ROW]
[ROW][C]Multiple R[/C][C]0.708445806051584[/C][/ROW]
[ROW][C]R-squared[/C][C]0.501895460112078[/C][/ROW]
[ROW][C]Adjusted R-squared[/C][C]0.377369325140098[/C][/ROW]
[ROW][C]F-TEST (value)[/C][C]4.03044276789775[/C][/ROW]
[ROW][C]F-TEST (DF numerator)[/C][C]12[/C][/ROW]
[ROW][C]F-TEST (DF denominator)[/C][C]48[/C][/ROW]
[ROW][C]p-value[/C][C]0.000253603796910418[/C][/ROW]
[ROW][C]Multiple Linear Regression - Residual Statistics[/C][/ROW]
[ROW][C]Residual Standard Deviation[/C][C]0.951606738730537[/C][/ROW]
[ROW][C]Sum Squared Residuals[/C][C]43.4666584894737[/C][/ROW]
[/TABLE]
Source: https://freestatistics.org/blog/index.php?pk=57641&T=3

Globally Unique Identifier (entire table): ba.freestatistics.org/blog/index.php?pk=57641&T=3

As an alternative you can also use a QR Code:  

The GUIDs for individual cells are displayed in the table below:

Multiple Linear Regression - Regression Statistics
Multiple R0.708445806051584
R-squared0.501895460112078
Adjusted R-squared0.377369325140098
F-TEST (value)4.03044276789775
F-TEST (DF numerator)12
F-TEST (DF denominator)48
p-value0.000253603796910418
Multiple Linear Regression - Residual Statistics
Residual Standard Deviation0.951606738730537
Sum Squared Residuals43.4666584894737


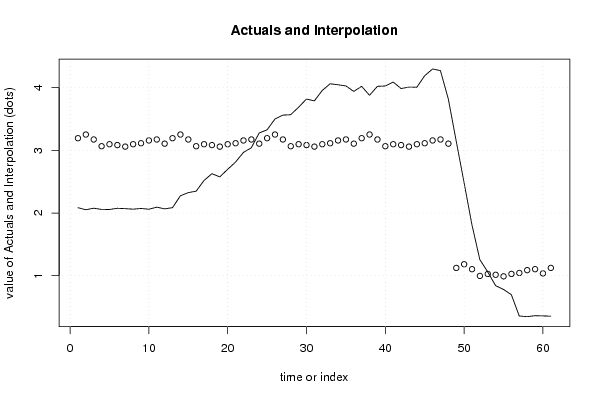
Multiple Linear Regression - Actuals, Interpolation, and Residuals
Time or IndexActualsInterpolationForecastResidualsPrediction Error
12.0853.1941447368421-1.10914473684210
22.0533.25268684210526-1.19968684210526
32.0773.17388684210526-1.09688684210526
42.0583.06608684210526-1.00808684210526
52.0573.09788684210526-1.04088684210526
62.0763.08428684210526-1.00828684210526
72.073.05968684210526-0.989686842105263
82.0623.09808684210526-1.03608684210526
92.0733.11368684210526-1.04068684210526
102.0613.15828684210526-1.09728684210526
112.0943.17388684210526-1.07988684210526
122.0673.10688684210526-1.03988684210526
132.0863.19414473684211-1.10814473684211
142.2763.25268684210526-0.976686842105263
152.3263.17388684210526-0.847886842105262
162.3493.06608684210526-0.717086842105262
172.523.09788684210526-0.577886842105263
182.6283.08428684210526-0.456286842105263
192.5773.05968684210526-0.482686842105263
202.6983.09808684210526-0.400086842105263
212.8143.11368684210526-0.299686842105263
222.9683.15828684210526-0.190286842105263
233.0413.17388684210526-0.132886842105263
243.2783.106886842105260.171113157894736
253.3283.194144736842110.133855263157894
263.53.252686842105260.247313157894738
273.5633.173886842105260.389113157894738
283.5693.066086842105260.502913157894737
293.693.097886842105260.592113157894737
303.8193.084286842105260.734713157894737
313.793.059686842105260.730313157894737
323.9563.098086842105260.857913157894737
334.0633.113686842105260.949313157894737
344.0473.158286842105260.888713157894737
354.0293.173886842105260.855113157894737
363.9413.106886842105260.834113157894736
374.0223.194144736842110.827855263157894
383.8793.252686842105260.626313157894738
394.0223.173886842105260.848113157894738
404.0283.066086842105260.961913157894737
414.0913.097886842105260.993113157894737
423.9873.084286842105260.902713157894737
434.013.059686842105260.950313157894736
444.0073.098086842105260.908913157894737
454.1913.113686842105261.07731315789474
464.2993.158286842105261.14071315789474
474.2733.173886842105261.09911315789474
483.823.106886842105260.713113157894736
493.151.124710526315792.02528947368421
502.4861.183252631578951.30274736842105
511.8121.104452631578950.707547368421053
521.2570.9966526315789470.260347368421053
531.0621.028452631578950.0335473684210529
540.8421.01485263157895-0.172852631578947
550.7820.990252631578947-0.208252631578947
560.6981.02865263157895-0.330652631578947
570.3581.04425263157895-0.686252631578947
580.3471.08885263157895-0.741852631578948
590.3631.10445263157895-0.741452631578947
600.3591.03745263157895-0.678452631578949
610.3551.12471052631579-0.76971052631579

\begin{tabular}{lllllllll}
\hline
Multiple Linear Regression - Actuals, Interpolation, and Residuals \tabularnewline
Time or Index & Actuals & InterpolationForecast & ResidualsPrediction Error \tabularnewline
1 & 2.085 & 3.1941447368421 & -1.10914473684210 \tabularnewline
2 & 2.053 & 3.25268684210526 & -1.19968684210526 \tabularnewline
3 & 2.077 & 3.17388684210526 & -1.09688684210526 \tabularnewline
4 & 2.058 & 3.06608684210526 & -1.00808684210526 \tabularnewline
5 & 2.057 & 3.09788684210526 & -1.04088684210526 \tabularnewline
6 & 2.076 & 3.08428684210526 & -1.00828684210526 \tabularnewline
7 & 2.07 & 3.05968684210526 & -0.989686842105263 \tabularnewline
8 & 2.062 & 3.09808684210526 & -1.03608684210526 \tabularnewline
9 & 2.073 & 3.11368684210526 & -1.04068684210526 \tabularnewline
10 & 2.061 & 3.15828684210526 & -1.09728684210526 \tabularnewline
11 & 2.094 & 3.17388684210526 & -1.07988684210526 \tabularnewline
12 & 2.067 & 3.10688684210526 & -1.03988684210526 \tabularnewline
13 & 2.086 & 3.19414473684211 & -1.10814473684211 \tabularnewline
14 & 2.276 & 3.25268684210526 & -0.976686842105263 \tabularnewline
15 & 2.326 & 3.17388684210526 & -0.847886842105262 \tabularnewline
16 & 2.349 & 3.06608684210526 & -0.717086842105262 \tabularnewline
17 & 2.52 & 3.09788684210526 & -0.577886842105263 \tabularnewline
18 & 2.628 & 3.08428684210526 & -0.456286842105263 \tabularnewline
19 & 2.577 & 3.05968684210526 & -0.482686842105263 \tabularnewline
20 & 2.698 & 3.09808684210526 & -0.400086842105263 \tabularnewline
21 & 2.814 & 3.11368684210526 & -0.299686842105263 \tabularnewline
22 & 2.968 & 3.15828684210526 & -0.190286842105263 \tabularnewline
23 & 3.041 & 3.17388684210526 & -0.132886842105263 \tabularnewline
24 & 3.278 & 3.10688684210526 & 0.171113157894736 \tabularnewline
25 & 3.328 & 3.19414473684211 & 0.133855263157894 \tabularnewline
26 & 3.5 & 3.25268684210526 & 0.247313157894738 \tabularnewline
27 & 3.563 & 3.17388684210526 & 0.389113157894738 \tabularnewline
28 & 3.569 & 3.06608684210526 & 0.502913157894737 \tabularnewline
29 & 3.69 & 3.09788684210526 & 0.592113157894737 \tabularnewline
30 & 3.819 & 3.08428684210526 & 0.734713157894737 \tabularnewline
31 & 3.79 & 3.05968684210526 & 0.730313157894737 \tabularnewline
32 & 3.956 & 3.09808684210526 & 0.857913157894737 \tabularnewline
33 & 4.063 & 3.11368684210526 & 0.949313157894737 \tabularnewline
34 & 4.047 & 3.15828684210526 & 0.888713157894737 \tabularnewline
35 & 4.029 & 3.17388684210526 & 0.855113157894737 \tabularnewline
36 & 3.941 & 3.10688684210526 & 0.834113157894736 \tabularnewline
37 & 4.022 & 3.19414473684211 & 0.827855263157894 \tabularnewline
38 & 3.879 & 3.25268684210526 & 0.626313157894738 \tabularnewline
39 & 4.022 & 3.17388684210526 & 0.848113157894738 \tabularnewline
40 & 4.028 & 3.06608684210526 & 0.961913157894737 \tabularnewline
41 & 4.091 & 3.09788684210526 & 0.993113157894737 \tabularnewline
42 & 3.987 & 3.08428684210526 & 0.902713157894737 \tabularnewline
43 & 4.01 & 3.05968684210526 & 0.950313157894736 \tabularnewline
44 & 4.007 & 3.09808684210526 & 0.908913157894737 \tabularnewline
45 & 4.191 & 3.11368684210526 & 1.07731315789474 \tabularnewline
46 & 4.299 & 3.15828684210526 & 1.14071315789474 \tabularnewline
47 & 4.273 & 3.17388684210526 & 1.09911315789474 \tabularnewline
48 & 3.82 & 3.10688684210526 & 0.713113157894736 \tabularnewline
49 & 3.15 & 1.12471052631579 & 2.02528947368421 \tabularnewline
50 & 2.486 & 1.18325263157895 & 1.30274736842105 \tabularnewline
51 & 1.812 & 1.10445263157895 & 0.707547368421053 \tabularnewline
52 & 1.257 & 0.996652631578947 & 0.260347368421053 \tabularnewline
53 & 1.062 & 1.02845263157895 & 0.0335473684210529 \tabularnewline
54 & 0.842 & 1.01485263157895 & -0.172852631578947 \tabularnewline
55 & 0.782 & 0.990252631578947 & -0.208252631578947 \tabularnewline
56 & 0.698 & 1.02865263157895 & -0.330652631578947 \tabularnewline
57 & 0.358 & 1.04425263157895 & -0.686252631578947 \tabularnewline
58 & 0.347 & 1.08885263157895 & -0.741852631578948 \tabularnewline
59 & 0.363 & 1.10445263157895 & -0.741452631578947 \tabularnewline
60 & 0.359 & 1.03745263157895 & -0.678452631578949 \tabularnewline
61 & 0.355 & 1.12471052631579 & -0.76971052631579 \tabularnewline
\hline
\end{tabular}
%Source: https://freestatistics.org/blog/index.php?pk=57641&T=4

[TABLE]
[ROW][C]Multiple Linear Regression - Actuals, Interpolation, and Residuals[/C][/ROW]
[ROW][C]Time or Index[/C][C]Actuals[/C][C]InterpolationForecast[/C][C]ResidualsPrediction Error[/C][/ROW]
[ROW][C]1[/C][C]2.085[/C][C]3.1941447368421[/C][C]-1.10914473684210[/C][/ROW]
[ROW][C]2[/C][C]2.053[/C][C]3.25268684210526[/C][C]-1.19968684210526[/C][/ROW]
[ROW][C]3[/C][C]2.077[/C][C]3.17388684210526[/C][C]-1.09688684210526[/C][/ROW]
[ROW][C]4[/C][C]2.058[/C][C]3.06608684210526[/C][C]-1.00808684210526[/C][/ROW]
[ROW][C]5[/C][C]2.057[/C][C]3.09788684210526[/C][C]-1.04088684210526[/C][/ROW]
[ROW][C]6[/C][C]2.076[/C][C]3.08428684210526[/C][C]-1.00828684210526[/C][/ROW]
[ROW][C]7[/C][C]2.07[/C][C]3.05968684210526[/C][C]-0.989686842105263[/C][/ROW]
[ROW][C]8[/C][C]2.062[/C][C]3.09808684210526[/C][C]-1.03608684210526[/C][/ROW]
[ROW][C]9[/C][C]2.073[/C][C]3.11368684210526[/C][C]-1.04068684210526[/C][/ROW]
[ROW][C]10[/C][C]2.061[/C][C]3.15828684210526[/C][C]-1.09728684210526[/C][/ROW]
[ROW][C]11[/C][C]2.094[/C][C]3.17388684210526[/C][C]-1.07988684210526[/C][/ROW]
[ROW][C]12[/C][C]2.067[/C][C]3.10688684210526[/C][C]-1.03988684210526[/C][/ROW]
[ROW][C]13[/C][C]2.086[/C][C]3.19414473684211[/C][C]-1.10814473684211[/C][/ROW]
[ROW][C]14[/C][C]2.276[/C][C]3.25268684210526[/C][C]-0.976686842105263[/C][/ROW]
[ROW][C]15[/C][C]2.326[/C][C]3.17388684210526[/C][C]-0.847886842105262[/C][/ROW]
[ROW][C]16[/C][C]2.349[/C][C]3.06608684210526[/C][C]-0.717086842105262[/C][/ROW]
[ROW][C]17[/C][C]2.52[/C][C]3.09788684210526[/C][C]-0.577886842105263[/C][/ROW]
[ROW][C]18[/C][C]2.628[/C][C]3.08428684210526[/C][C]-0.456286842105263[/C][/ROW]
[ROW][C]19[/C][C]2.577[/C][C]3.05968684210526[/C][C]-0.482686842105263[/C][/ROW]
[ROW][C]20[/C][C]2.698[/C][C]3.09808684210526[/C][C]-0.400086842105263[/C][/ROW]
[ROW][C]21[/C][C]2.814[/C][C]3.11368684210526[/C][C]-0.299686842105263[/C][/ROW]
[ROW][C]22[/C][C]2.968[/C][C]3.15828684210526[/C][C]-0.190286842105263[/C][/ROW]
[ROW][C]23[/C][C]3.041[/C][C]3.17388684210526[/C][C]-0.132886842105263[/C][/ROW]
[ROW][C]24[/C][C]3.278[/C][C]3.10688684210526[/C][C]0.171113157894736[/C][/ROW]
[ROW][C]25[/C][C]3.328[/C][C]3.19414473684211[/C][C]0.133855263157894[/C][/ROW]
[ROW][C]26[/C][C]3.5[/C][C]3.25268684210526[/C][C]0.247313157894738[/C][/ROW]
[ROW][C]27[/C][C]3.563[/C][C]3.17388684210526[/C][C]0.389113157894738[/C][/ROW]
[ROW][C]28[/C][C]3.569[/C][C]3.06608684210526[/C][C]0.502913157894737[/C][/ROW]
[ROW][C]29[/C][C]3.69[/C][C]3.09788684210526[/C][C]0.592113157894737[/C][/ROW]
[ROW][C]30[/C][C]3.819[/C][C]3.08428684210526[/C][C]0.734713157894737[/C][/ROW]
[ROW][C]31[/C][C]3.79[/C][C]3.05968684210526[/C][C]0.730313157894737[/C][/ROW]
[ROW][C]32[/C][C]3.956[/C][C]3.09808684210526[/C][C]0.857913157894737[/C][/ROW]
[ROW][C]33[/C][C]4.063[/C][C]3.11368684210526[/C][C]0.949313157894737[/C][/ROW]
[ROW][C]34[/C][C]4.047[/C][C]3.15828684210526[/C][C]0.888713157894737[/C][/ROW]
[ROW][C]35[/C][C]4.029[/C][C]3.17388684210526[/C][C]0.855113157894737[/C][/ROW]
[ROW][C]36[/C][C]3.941[/C][C]3.10688684210526[/C][C]0.834113157894736[/C][/ROW]
[ROW][C]37[/C][C]4.022[/C][C]3.19414473684211[/C][C]0.827855263157894[/C][/ROW]
[ROW][C]38[/C][C]3.879[/C][C]3.25268684210526[/C][C]0.626313157894738[/C][/ROW]
[ROW][C]39[/C][C]4.022[/C][C]3.17388684210526[/C][C]0.848113157894738[/C][/ROW]
[ROW][C]40[/C][C]4.028[/C][C]3.06608684210526[/C][C]0.961913157894737[/C][/ROW]
[ROW][C]41[/C][C]4.091[/C][C]3.09788684210526[/C][C]0.993113157894737[/C][/ROW]
[ROW][C]42[/C][C]3.987[/C][C]3.08428684210526[/C][C]0.902713157894737[/C][/ROW]
[ROW][C]43[/C][C]4.01[/C][C]3.05968684210526[/C][C]0.950313157894736[/C][/ROW]
[ROW][C]44[/C][C]4.007[/C][C]3.09808684210526[/C][C]0.908913157894737[/C][/ROW]
[ROW][C]45[/C][C]4.191[/C][C]3.11368684210526[/C][C]1.07731315789474[/C][/ROW]
[ROW][C]46[/C][C]4.299[/C][C]3.15828684210526[/C][C]1.14071315789474[/C][/ROW]
[ROW][C]47[/C][C]4.273[/C][C]3.17388684210526[/C][C]1.09911315789474[/C][/ROW]
[ROW][C]48[/C][C]3.82[/C][C]3.10688684210526[/C][C]0.713113157894736[/C][/ROW]
[ROW][C]49[/C][C]3.15[/C][C]1.12471052631579[/C][C]2.02528947368421[/C][/ROW]
[ROW][C]50[/C][C]2.486[/C][C]1.18325263157895[/C][C]1.30274736842105[/C][/ROW]
[ROW][C]51[/C][C]1.812[/C][C]1.10445263157895[/C][C]0.707547368421053[/C][/ROW]
[ROW][C]52[/C][C]1.257[/C][C]0.996652631578947[/C][C]0.260347368421053[/C][/ROW]
[ROW][C]53[/C][C]1.062[/C][C]1.02845263157895[/C][C]0.0335473684210529[/C][/ROW]
[ROW][C]54[/C][C]0.842[/C][C]1.01485263157895[/C][C]-0.172852631578947[/C][/ROW]
[ROW][C]55[/C][C]0.782[/C][C]0.990252631578947[/C][C]-0.208252631578947[/C][/ROW]
[ROW][C]56[/C][C]0.698[/C][C]1.02865263157895[/C][C]-0.330652631578947[/C][/ROW]
[ROW][C]57[/C][C]0.358[/C][C]1.04425263157895[/C][C]-0.686252631578947[/C][/ROW]
[ROW][C]58[/C][C]0.347[/C][C]1.08885263157895[/C][C]-0.741852631578948[/C][/ROW]
[ROW][C]59[/C][C]0.363[/C][C]1.10445263157895[/C][C]-0.741452631578947[/C][/ROW]
[ROW][C]60[/C][C]0.359[/C][C]1.03745263157895[/C][C]-0.678452631578949[/C][/ROW]
[ROW][C]61[/C][C]0.355[/C][C]1.12471052631579[/C][C]-0.76971052631579[/C][/ROW]
[/TABLE]
Source: https://freestatistics.org/blog/index.php?pk=57641&T=4

Globally Unique Identifier (entire table): ba.freestatistics.org/blog/index.php?pk=57641&T=4

As an alternative you can also use a QR Code:  

The GUIDs for individual cells are displayed in the table below:

Multiple Linear Regression - Actuals, Interpolation, and Residuals
Time or IndexActualsInterpolationForecastResidualsPrediction Error
12.0853.1941447368421-1.10914473684210
22.0533.25268684210526-1.19968684210526
32.0773.17388684210526-1.09688684210526
42.0583.06608684210526-1.00808684210526
52.0573.09788684210526-1.04088684210526
62.0763.08428684210526-1.00828684210526
72.073.05968684210526-0.989686842105263
82.0623.09808684210526-1.03608684210526
92.0733.11368684210526-1.04068684210526
102.0613.15828684210526-1.09728684210526
112.0943.17388684210526-1.07988684210526
122.0673.10688684210526-1.03988684210526
132.0863.19414473684211-1.10814473684211
142.2763.25268684210526-0.976686842105263
152.3263.17388684210526-0.847886842105262
162.3493.06608684210526-0.717086842105262
172.523.09788684210526-0.577886842105263
182.6283.08428684210526-0.456286842105263
192.5773.05968684210526-0.482686842105263
202.6983.09808684210526-0.400086842105263
212.8143.11368684210526-0.299686842105263
222.9683.15828684210526-0.190286842105263
233.0413.17388684210526-0.132886842105263
243.2783.106886842105260.171113157894736
253.3283.194144736842110.133855263157894
263.53.252686842105260.247313157894738
273.5633.173886842105260.389113157894738
283.5693.066086842105260.502913157894737
293.693.097886842105260.592113157894737
303.8193.084286842105260.734713157894737
313.793.059686842105260.730313157894737
323.9563.098086842105260.857913157894737
334.0633.113686842105260.949313157894737
344.0473.158286842105260.888713157894737
354.0293.173886842105260.855113157894737
363.9413.106886842105260.834113157894736
374.0223.194144736842110.827855263157894
383.8793.252686842105260.626313157894738
394.0223.173886842105260.848113157894738
404.0283.066086842105260.961913157894737
414.0913.097886842105260.993113157894737
423.9873.084286842105260.902713157894737
434.013.059686842105260.950313157894736
444.0073.098086842105260.908913157894737
454.1913.113686842105261.07731315789474
464.2993.158286842105261.14071315789474
474.2733.173886842105261.09911315789474
483.823.106886842105260.713113157894736
493.151.124710526315792.02528947368421
502.4861.183252631578951.30274736842105
511.8121.104452631578950.707547368421053
521.2570.9966526315789470.260347368421053
531.0621.028452631578950.0335473684210529
540.8421.01485263157895-0.172852631578947
550.7820.990252631578947-0.208252631578947
560.6981.02865263157895-0.330652631578947
570.3581.04425263157895-0.686252631578947
580.3471.08885263157895-0.741852631578948
590.3631.10445263157895-0.741452631578947
600.3591.03745263157895-0.678452631578949
610.3551.12471052631579-0.76971052631579


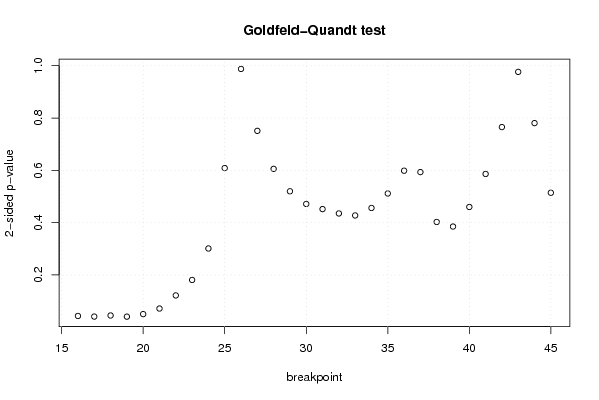
Goldfeld-Quandt test for Heteroskedasticity
p-valuesAlternative Hypothesis
breakpoint indexgreater2-sidedless
160.02162466042394850.04324932084789690.978375339576051
170.02045589640259430.04091179280518860.979544103597406
180.02253336731700880.04506673463401760.977466632682991
190.02030238521706280.04060477043412550.979697614782937
200.02517119406392240.05034238812784480.974828805936078
210.03579321928493270.07158643856986540.964206780715067
220.06087977945890890.1217595589178180.939120220541091
230.09042479109056760.1808495821811350.909575208909432
240.1505934518336610.3011869036673220.849406548166339
250.3042927151386040.6085854302772090.695707284861396
260.4937472697091080.9874945394182150.506252730290892
270.6245891769449050.750821646110190.375410823055095
280.6971800084474690.6056399831050620.302819991552531
290.7400566575008840.5198866849982310.259943342499116
300.7642937899073350.4714124201853290.235706210092665
310.7741202822568940.4517594354862120.225879717743106
320.782435090937280.4351298181254390.217564909062719
330.7862743244728110.4274513510543780.213725675527189
340.7719941359052330.4560117281895340.228005864094767
350.7442660571595940.5114678856808120.255733942840406
360.7007401468124860.5985197063750280.299259853187514
370.7034095648919750.5931808702160490.296590435108025
380.7986934023585520.4026131952828960.201306597641448
390.8074603212698440.3850793574603120.192539678730156
400.7700756832380040.4598486335239920.229924316761996
410.7069550684284220.5860898631431550.293044931571577
420.6173211129424840.7653577741150330.382678887057516
430.5118722510316450.9762554979367090.488127748968355
440.39018469104590.78036938209180.6098153089541
450.2571228498809290.5142456997618590.74287715011907

\begin{tabular}{lllllllll}
\hline
Goldfeld-Quandt test for Heteroskedasticity \tabularnewline
p-values & Alternative Hypothesis \tabularnewline
breakpoint index & greater & 2-sided & less \tabularnewline
16 & 0.0216246604239485 & 0.0432493208478969 & 0.978375339576051 \tabularnewline
17 & 0.0204558964025943 & 0.0409117928051886 & 0.979544103597406 \tabularnewline
18 & 0.0225333673170088 & 0.0450667346340176 & 0.977466632682991 \tabularnewline
19 & 0.0203023852170628 & 0.0406047704341255 & 0.979697614782937 \tabularnewline
20 & 0.0251711940639224 & 0.0503423881278448 & 0.974828805936078 \tabularnewline
21 & 0.0357932192849327 & 0.0715864385698654 & 0.964206780715067 \tabularnewline
22 & 0.0608797794589089 & 0.121759558917818 & 0.939120220541091 \tabularnewline
23 & 0.0904247910905676 & 0.180849582181135 & 0.909575208909432 \tabularnewline
24 & 0.150593451833661 & 0.301186903667322 & 0.849406548166339 \tabularnewline
25 & 0.304292715138604 & 0.608585430277209 & 0.695707284861396 \tabularnewline
26 & 0.493747269709108 & 0.987494539418215 & 0.506252730290892 \tabularnewline
27 & 0.624589176944905 & 0.75082164611019 & 0.375410823055095 \tabularnewline
28 & 0.697180008447469 & 0.605639983105062 & 0.302819991552531 \tabularnewline
29 & 0.740056657500884 & 0.519886684998231 & 0.259943342499116 \tabularnewline
30 & 0.764293789907335 & 0.471412420185329 & 0.235706210092665 \tabularnewline
31 & 0.774120282256894 & 0.451759435486212 & 0.225879717743106 \tabularnewline
32 & 0.78243509093728 & 0.435129818125439 & 0.217564909062719 \tabularnewline
33 & 0.786274324472811 & 0.427451351054378 & 0.213725675527189 \tabularnewline
34 & 0.771994135905233 & 0.456011728189534 & 0.228005864094767 \tabularnewline
35 & 0.744266057159594 & 0.511467885680812 & 0.255733942840406 \tabularnewline
36 & 0.700740146812486 & 0.598519706375028 & 0.299259853187514 \tabularnewline
37 & 0.703409564891975 & 0.593180870216049 & 0.296590435108025 \tabularnewline
38 & 0.798693402358552 & 0.402613195282896 & 0.201306597641448 \tabularnewline
39 & 0.807460321269844 & 0.385079357460312 & 0.192539678730156 \tabularnewline
40 & 0.770075683238004 & 0.459848633523992 & 0.229924316761996 \tabularnewline
41 & 0.706955068428422 & 0.586089863143155 & 0.293044931571577 \tabularnewline
42 & 0.617321112942484 & 0.765357774115033 & 0.382678887057516 \tabularnewline
43 & 0.511872251031645 & 0.976255497936709 & 0.488127748968355 \tabularnewline
44 & 0.3901846910459 & 0.7803693820918 & 0.6098153089541 \tabularnewline
45 & 0.257122849880929 & 0.514245699761859 & 0.74287715011907 \tabularnewline
\hline
\end{tabular}
%Source: https://freestatistics.org/blog/index.php?pk=57641&T=5

[TABLE]
[ROW][C]Goldfeld-Quandt test for Heteroskedasticity[/C][/ROW]
[ROW][C]p-values[/C][C]Alternative Hypothesis[/C][/ROW]
[ROW][C]breakpoint index[/C][C]greater[/C][C]2-sided[/C][C]less[/C][/ROW]
[ROW][C]16[/C][C]0.0216246604239485[/C][C]0.0432493208478969[/C][C]0.978375339576051[/C][/ROW]
[ROW][C]17[/C][C]0.0204558964025943[/C][C]0.0409117928051886[/C][C]0.979544103597406[/C][/ROW]
[ROW][C]18[/C][C]0.0225333673170088[/C][C]0.0450667346340176[/C][C]0.977466632682991[/C][/ROW]
[ROW][C]19[/C][C]0.0203023852170628[/C][C]0.0406047704341255[/C][C]0.979697614782937[/C][/ROW]
[ROW][C]20[/C][C]0.0251711940639224[/C][C]0.0503423881278448[/C][C]0.974828805936078[/C][/ROW]
[ROW][C]21[/C][C]0.0357932192849327[/C][C]0.0715864385698654[/C][C]0.964206780715067[/C][/ROW]
[ROW][C]22[/C][C]0.0608797794589089[/C][C]0.121759558917818[/C][C]0.939120220541091[/C][/ROW]
[ROW][C]23[/C][C]0.0904247910905676[/C][C]0.180849582181135[/C][C]0.909575208909432[/C][/ROW]
[ROW][C]24[/C][C]0.150593451833661[/C][C]0.301186903667322[/C][C]0.849406548166339[/C][/ROW]
[ROW][C]25[/C][C]0.304292715138604[/C][C]0.608585430277209[/C][C]0.695707284861396[/C][/ROW]
[ROW][C]26[/C][C]0.493747269709108[/C][C]0.987494539418215[/C][C]0.506252730290892[/C][/ROW]
[ROW][C]27[/C][C]0.624589176944905[/C][C]0.75082164611019[/C][C]0.375410823055095[/C][/ROW]
[ROW][C]28[/C][C]0.697180008447469[/C][C]0.605639983105062[/C][C]0.302819991552531[/C][/ROW]
[ROW][C]29[/C][C]0.740056657500884[/C][C]0.519886684998231[/C][C]0.259943342499116[/C][/ROW]
[ROW][C]30[/C][C]0.764293789907335[/C][C]0.471412420185329[/C][C]0.235706210092665[/C][/ROW]
[ROW][C]31[/C][C]0.774120282256894[/C][C]0.451759435486212[/C][C]0.225879717743106[/C][/ROW]
[ROW][C]32[/C][C]0.78243509093728[/C][C]0.435129818125439[/C][C]0.217564909062719[/C][/ROW]
[ROW][C]33[/C][C]0.786274324472811[/C][C]0.427451351054378[/C][C]0.213725675527189[/C][/ROW]
[ROW][C]34[/C][C]0.771994135905233[/C][C]0.456011728189534[/C][C]0.228005864094767[/C][/ROW]
[ROW][C]35[/C][C]0.744266057159594[/C][C]0.511467885680812[/C][C]0.255733942840406[/C][/ROW]
[ROW][C]36[/C][C]0.700740146812486[/C][C]0.598519706375028[/C][C]0.299259853187514[/C][/ROW]
[ROW][C]37[/C][C]0.703409564891975[/C][C]0.593180870216049[/C][C]0.296590435108025[/C][/ROW]
[ROW][C]38[/C][C]0.798693402358552[/C][C]0.402613195282896[/C][C]0.201306597641448[/C][/ROW]
[ROW][C]39[/C][C]0.807460321269844[/C][C]0.385079357460312[/C][C]0.192539678730156[/C][/ROW]
[ROW][C]40[/C][C]0.770075683238004[/C][C]0.459848633523992[/C][C]0.229924316761996[/C][/ROW]
[ROW][C]41[/C][C]0.706955068428422[/C][C]0.586089863143155[/C][C]0.293044931571577[/C][/ROW]
[ROW][C]42[/C][C]0.617321112942484[/C][C]0.765357774115033[/C][C]0.382678887057516[/C][/ROW]
[ROW][C]43[/C][C]0.511872251031645[/C][C]0.976255497936709[/C][C]0.488127748968355[/C][/ROW]
[ROW][C]44[/C][C]0.3901846910459[/C][C]0.7803693820918[/C][C]0.6098153089541[/C][/ROW]
[ROW][C]45[/C][C]0.257122849880929[/C][C]0.514245699761859[/C][C]0.74287715011907[/C][/ROW]
[/TABLE]
Source: https://freestatistics.org/blog/index.php?pk=57641&T=5

Globally Unique Identifier (entire table): ba.freestatistics.org/blog/index.php?pk=57641&T=5

As an alternative you can also use a QR Code:  

The GUIDs for individual cells are displayed in the table below:

Goldfeld-Quandt test for Heteroskedasticity
p-valuesAlternative Hypothesis
breakpoint indexgreater2-sidedless
160.02162466042394850.04324932084789690.978375339576051
170.02045589640259430.04091179280518860.979544103597406
180.02253336731700880.04506673463401760.977466632682991
190.02030238521706280.04060477043412550.979697614782937
200.02517119406392240.05034238812784480.974828805936078
210.03579321928493270.07158643856986540.964206780715067
220.06087977945890890.1217595589178180.939120220541091
230.09042479109056760.1808495821811350.909575208909432
240.1505934518336610.3011869036673220.849406548166339
250.3042927151386040.6085854302772090.695707284861396
260.4937472697091080.9874945394182150.506252730290892
270.6245891769449050.750821646110190.375410823055095
280.6971800084474690.6056399831050620.302819991552531
290.7400566575008840.5198866849982310.259943342499116
300.7642937899073350.4714124201853290.235706210092665
310.7741202822568940.4517594354862120.225879717743106
320.782435090937280.4351298181254390.217564909062719
330.7862743244728110.4274513510543780.213725675527189
340.7719941359052330.4560117281895340.228005864094767
350.7442660571595940.5114678856808120.255733942840406
360.7007401468124860.5985197063750280.299259853187514
370.7034095648919750.5931808702160490.296590435108025
380.7986934023585520.4026131952828960.201306597641448
390.8074603212698440.3850793574603120.192539678730156
400.7700756832380040.4598486335239920.229924316761996
410.7069550684284220.5860898631431550.293044931571577
420.6173211129424840.7653577741150330.382678887057516
430.5118722510316450.9762554979367090.488127748968355
440.39018469104590.78036938209180.6098153089541
450.2571228498809290.5142456997618590.74287715011907


Meta Analysis of Goldfeld-Quandt test for Heteroskedasticity
Description# significant tests% significant testsOK/NOK
1% type I error level00OK
5% type I error level40.133333333333333NOK
10% type I error level60.2NOK

\begin{tabular}{lllllllll}
\hline
Meta Analysis of Goldfeld-Quandt test for Heteroskedasticity \tabularnewline
Description & # significant tests & % significant tests & OK/NOK \tabularnewline
1% type I error level & 0 & 0 & OK \tabularnewline
5% type I error level & 4 & 0.133333333333333 & NOK \tabularnewline
10% type I error level & 6 & 0.2 & NOK \tabularnewline
\hline
\end{tabular}
%Source: https://freestatistics.org/blog/index.php?pk=57641&T=6

[TABLE]
[ROW][C]Meta Analysis of Goldfeld-Quandt test for Heteroskedasticity[/C][/ROW]
[ROW][C]Description[/C][C]# significant tests[/C][C]% significant tests[/C][C]OK/NOK[/C][/ROW]
[ROW][C]1% type I error level[/C][C]0[/C][C]0[/C][C]OK[/C][/ROW]
[ROW][C]5% type I error level[/C][C]4[/C][C]0.133333333333333[/C][C]NOK[/C][/ROW]
[ROW][C]10% type I error level[/C][C]6[/C][C]0.2[/C][C]NOK[/C][/ROW]
[/TABLE]
Source: https://freestatistics.org/blog/index.php?pk=57641&T=6

Globally Unique Identifier (entire table): ba.freestatistics.org/blog/index.php?pk=57641&T=6

As an alternative you can also use a QR Code:  

The GUIDs for individual cells are displayed in the table below:

Meta Analysis of Goldfeld-Quandt test for Heteroskedasticity
Description# significant tests% significant testsOK/NOK
1% type I error level00OK
5% type I error level40.133333333333333NOK
10% type I error level60.2NOK


Parameters (Session):
par1 = 1 ; par2 = Include Monthly Dummies ; par3 = No Linear Trend ;
Parameters (R input):
par1 = 1 ; par2 = Include Monthly Dummies ; par3 = No Linear Trend ;
R code (references can be found in the software module):
library(lattice)
library(lmtest)
n25 <- 25 #minimum number of obs. for Goldfeld-Quandt test
par1 <- as.numeric(par1)
x <- t(y)
k <- length(x[1,])
n <- length(x[,1])
x1 <- cbind(x[,par1], x[,1:k!=par1])
mycolnames <- c(colnames(x)[par1], colnames(x)[1:k!=par1])
colnames(x1) <- mycolnames #colnames(x)[par1]
x <- x1
if (par3 == 'First Differences'){
x2 <- array(0, dim=c(n-1,k), dimnames=list(1:(n-1), paste('(1-B)',colnames(x),sep='')))
for (i in 1:n-1) {
for (j in 1:k) {
x2[i,j] <- x[i+1,j] - x[i,j]
}
}
x <- x2
}
if (par2 == 'Include Monthly Dummies'){
x2 <- array(0, dim=c(n,11), dimnames=list(1:n, paste('M', seq(1:11), sep ='')))
for (i in 1:11){
x2[seq(i,n,12),i] <- 1
}
x <- cbind(x, x2)
}
if (par2 == 'Include Quarterly Dummies'){
x2 <- array(0, dim=c(n,3), dimnames=list(1:n, paste('Q', seq(1:3), sep ='')))
for (i in 1:3){
x2[seq(i,n,4),i] <- 1
}
x <- cbind(x, x2)
}
k <- length(x[1,])
if (par3 == 'Linear Trend'){
x <- cbind(x, c(1:n))
colnames(x)[k+1] <- 't'
}
x
k <- length(x[1,])
df <- as.data.frame(x)
(mylm <- lm(df))
(mysum <- summary(mylm))
if (n > n25) {
kp3 <- k + 3
nmkm3 <- n - k - 3
gqarr <- array(NA, dim=c(nmkm3-kp3+1,3))
numgqtests <- 0
numsignificant1 <- 0
numsignificant5 <- 0
numsignificant10 <- 0
for (mypoint in kp3:nmkm3) {
j <- 0
numgqtests <- numgqtests + 1
for (myalt in c('greater', 'two.sided', 'less')) {
j <- j + 1
gqarr[mypoint-kp3+1,j] <- gqtest(mylm, point=mypoint, alternative=myalt)$p.value
}
if (gqarr[mypoint-kp3+1,2] < 0.01) numsignificant1 <- numsignificant1 + 1
if (gqarr[mypoint-kp3+1,2] < 0.05) numsignificant5 <- numsignificant5 + 1
if (gqarr[mypoint-kp3+1,2] < 0.10) numsignificant10 <- numsignificant10 + 1
}
gqarr
}
bitmap(file='test0.png')
plot(x[,1], type='l', main='Actuals and Interpolation', ylab='value of Actuals and Interpolation (dots)', xlab='time or index')
points(x[,1]-mysum$resid)
grid()
dev.off()
bitmap(file='test1.png')
plot(mysum$resid, type='b', pch=19, main='Residuals', ylab='value of Residuals', xlab='time or index')
grid()
dev.off()
bitmap(file='test2.png')
hist(mysum$resid, main='Residual Histogram', xlab='values of Residuals')
grid()
dev.off()
bitmap(file='test3.png')
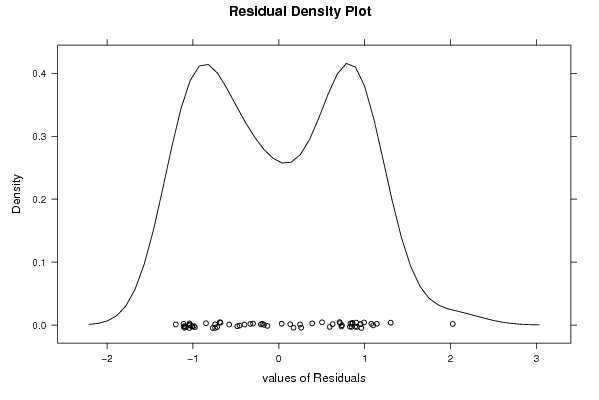
densityplot(~mysum$resid,col='black',main='Residual Density Plot', xlab='values of Residuals')
dev.off()
bitmap(file='test4.png')
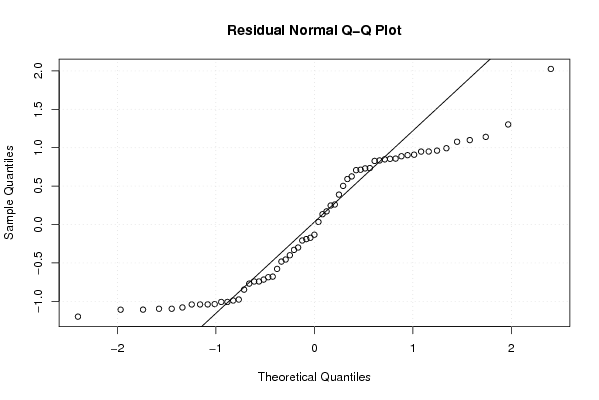
qqnorm(mysum$resid, main='Residual Normal Q-Q Plot')
qqline(mysum$resid)
grid()
dev.off()
(myerror <- as.ts(mysum$resid))
bitmap(file='test5.png')
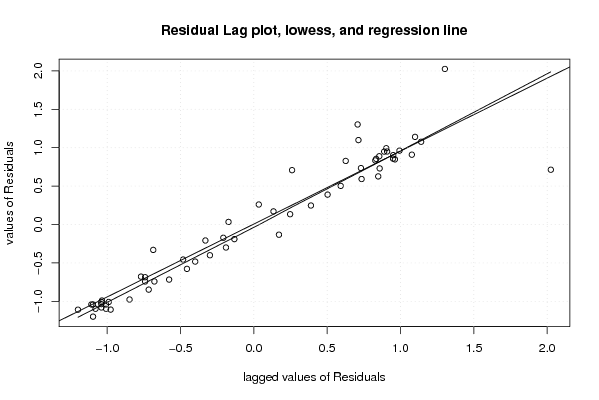
dum <- cbind(lag(myerror,k=1),myerror)
dum
dum1 <- dum[2:length(myerror),]
dum1
z <- as.data.frame(dum1)
z
plot(z,main=paste('Residual Lag plot, lowess, and regression line'), ylab='values of Residuals', xlab='lagged values of Residuals')
lines(lowess(z))
abline(lm(z))
grid()
dev.off()
bitmap(file='test6.png')
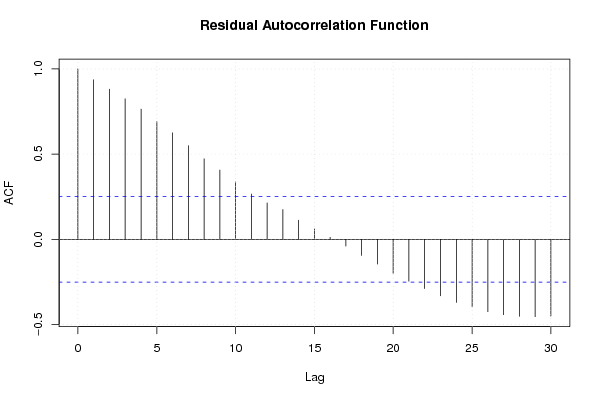
acf(mysum$resid, lag.max=length(mysum$resid)/2, main='Residual Autocorrelation Function')
grid()
dev.off()
bitmap(file='test7.png')
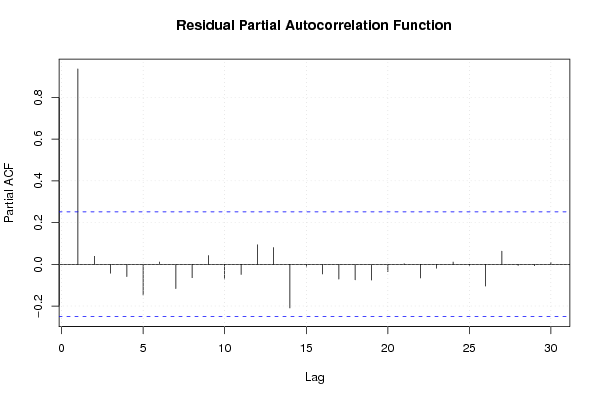
pacf(mysum$resid, lag.max=length(mysum$resid)/2, main='Residual Partial Autocorrelation Function')
grid()
dev.off()
bitmap(file='test8.png')
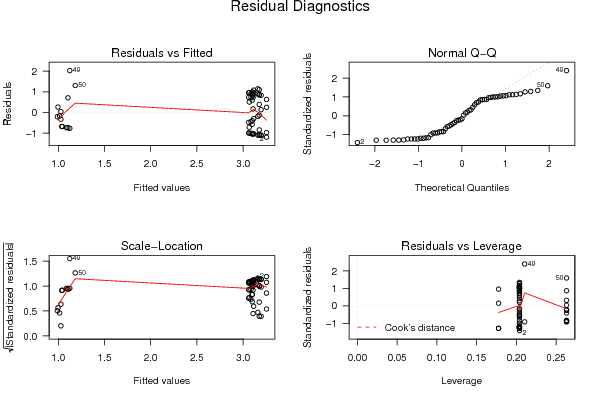
opar <- par(mfrow = c(2,2), oma = c(0, 0, 1.1, 0))
plot(mylm, las = 1, sub='Residual Diagnostics')
par(opar)
dev.off()
if (n > n25) {
bitmap(file='test9.png')
plot(kp3:nmkm3,gqarr[,2], main='Goldfeld-Quandt test',ylab='2-sided p-value',xlab='breakpoint')
grid()
dev.off()
}
load(file='createtable')
a<-table.start()
a<-table.row.start(a)
a<-table.element(a, 'Multiple Linear Regression - Estimated Regression Equation', 1, TRUE)
a<-table.row.end(a)
myeq <- colnames(x)[1]
myeq <- paste(myeq, '[t] = ', sep='')
for (i in 1:k){
if (mysum$coefficients[i,1] > 0) myeq <- paste(myeq, '+', '')
myeq <- paste(myeq, mysum$coefficients[i,1], sep=' ')
if (rownames(mysum$coefficients)[i] != '(Intercept)') {
myeq <- paste(myeq, rownames(mysum$coefficients)[i], sep='')
if (rownames(mysum$coefficients)[i] != 't') myeq <- paste(myeq, '[t]', sep='')
}
}
myeq <- paste(myeq, ' + e[t]')
a<-table.row.start(a)
a<-table.element(a, myeq)
a<-table.row.end(a)
a<-table.end(a)
table.save(a,file='mytable1.tab')
a<-table.start()
a<-table.row.start(a)
a<-table.element(a,hyperlink('ols1.htm','Multiple Linear Regression - Ordinary Least Squares',''), 6, TRUE)
a<-table.row.end(a)
a<-table.row.start(a)
a<-table.element(a,'Variable',header=TRUE)
a<-table.element(a,'Parameter',header=TRUE)
a<-table.element(a,'S.D.',header=TRUE)
a<-table.element(a,'T-STAT
H0: parameter = 0',header=TRUE)
a<-table.element(a,'2-tail p-value',header=TRUE)
a<-table.element(a,'1-tail p-value',header=TRUE)
a<-table.row.end(a)
for (i in 1:k){
a<-table.row.start(a)
a<-table.element(a,rownames(mysum$coefficients)[i],header=TRUE)
a<-table.element(a,mysum$coefficients[i,1])
a<-table.element(a, round(mysum$coefficients[i,2],6))
a<-table.element(a, round(mysum$coefficients[i,3],4))
a<-table.element(a, round(mysum$coefficients[i,4],6))
a<-table.element(a, round(mysum$coefficients[i,4]/2,6))
a<-table.row.end(a)
}
a<-table.end(a)
table.save(a,file='mytable2.tab')
a<-table.start()
a<-table.row.start(a)
a<-table.element(a, 'Multiple Linear Regression - Regression Statistics', 2, TRUE)
a<-table.row.end(a)
a<-table.row.start(a)
a<-table.element(a, 'Multiple R',1,TRUE)
a<-table.element(a, sqrt(mysum$r.squared))
a<-table.row.end(a)
a<-table.row.start(a)
a<-table.element(a, 'R-squared',1,TRUE)
a<-table.element(a, mysum$r.squared)
a<-table.row.end(a)
a<-table.row.start(a)
a<-table.element(a, 'Adjusted R-squared',1,TRUE)
a<-table.element(a, mysum$adj.r.squared)
a<-table.row.end(a)
a<-table.row.start(a)
a<-table.element(a, 'F-TEST (value)',1,TRUE)
a<-table.element(a, mysum$fstatistic[1])
a<-table.row.end(a)
a<-table.row.start(a)
a<-table.element(a, 'F-TEST (DF numerator)',1,TRUE)
a<-table.element(a, mysum$fstatistic[2])
a<-table.row.end(a)
a<-table.row.start(a)
a<-table.element(a, 'F-TEST (DF denominator)',1,TRUE)
a<-table.element(a, mysum$fstatistic[3])
a<-table.row.end(a)
a<-table.row.start(a)
a<-table.element(a, 'p-value',1,TRUE)
a<-table.element(a, 1-pf(mysum$fstatistic[1],mysum$fstatistic[2],mysum$fstatistic[3]))
a<-table.row.end(a)
a<-table.row.start(a)
a<-table.element(a, 'Multiple Linear Regression - Residual Statistics', 2, TRUE)
a<-table.row.end(a)
a<-table.row.start(a)
a<-table.element(a, 'Residual Standard Deviation',1,TRUE)
a<-table.element(a, mysum$sigma)
a<-table.row.end(a)
a<-table.row.start(a)
a<-table.element(a, 'Sum Squared Residuals',1,TRUE)
a<-table.element(a, sum(myerror*myerror))
a<-table.row.end(a)
a<-table.end(a)
table.save(a,file='mytable3.tab')
a<-table.start()
a<-table.row.start(a)
a<-table.element(a, 'Multiple Linear Regression - Actuals, Interpolation, and Residuals', 4, TRUE)
a<-table.row.end(a)
a<-table.row.start(a)
a<-table.element(a, 'Time or Index', 1, TRUE)
a<-table.element(a, 'Actuals', 1, TRUE)
a<-table.element(a, 'Interpolation
Forecast', 1, TRUE)
a<-table.element(a, 'Residuals
Prediction Error', 1, TRUE)
a<-table.row.end(a)
for (i in 1:n) {
a<-table.row.start(a)
a<-table.element(a,i, 1, TRUE)
a<-table.element(a,x[i])
a<-table.element(a,x[i]-mysum$resid[i])
a<-table.element(a,mysum$resid[i])
a<-table.row.end(a)
}
a<-table.end(a)
table.save(a,file='mytable4.tab')
if (n > n25) {
a<-table.start()
a<-table.row.start(a)
a<-table.element(a,'Goldfeld-Quandt test for Heteroskedasticity',4,TRUE)
a<-table.row.end(a)
a<-table.row.start(a)
a<-table.element(a,'p-values',header=TRUE)
a<-table.element(a,'Alternative Hypothesis',3,header=TRUE)
a<-table.row.end(a)
a<-table.row.start(a)
a<-table.element(a,'breakpoint index',header=TRUE)
a<-table.element(a,'greater',header=TRUE)
a<-table.element(a,'2-sided',header=TRUE)
a<-table.element(a,'less',header=TRUE)
a<-table.row.end(a)
for (mypoint in kp3:nmkm3) {
a<-table.row.start(a)
a<-table.element(a,mypoint,header=TRUE)
a<-table.element(a,gqarr[mypoint-kp3+1,1])
a<-table.element(a,gqarr[mypoint-kp3+1,2])
a<-table.element(a,gqarr[mypoint-kp3+1,3])
a<-table.row.end(a)
}
a<-table.end(a)
table.save(a,file='mytable5.tab')
a<-table.start()
a<-table.row.start(a)
a<-table.element(a,'Meta Analysis of Goldfeld-Quandt test for Heteroskedasticity',4,TRUE)
a<-table.row.end(a)
a<-table.row.start(a)
a<-table.element(a,'Description',header=TRUE)
a<-table.element(a,'# significant tests',header=TRUE)
a<-table.element(a,'% significant tests',header=TRUE)
a<-table.element(a,'OK/NOK',header=TRUE)
a<-table.row.end(a)
a<-table.row.start(a)
a<-table.element(a,'1% type I error level',header=TRUE)
a<-table.element(a,numsignificant1)
a<-table.element(a,numsignificant1/numgqtests)
if (numsignificant1/numgqtests < 0.01) dum <- 'OK' else dum <- 'NOK'
a<-table.element(a,dum)
a<-table.row.end(a)
a<-table.row.start(a)
a<-table.element(a,'5% type I error level',header=TRUE)
a<-table.element(a,numsignificant5)
a<-table.element(a,numsignificant5/numgqtests)
if (numsignificant5/numgqtests < 0.05) dum <- 'OK' else dum <- 'NOK'
a<-table.element(a,dum)
a<-table.row.end(a)
a<-table.row.start(a)
a<-table.element(a,'10% type I error level',header=TRUE)
a<-table.element(a,numsignificant10)
a<-table.element(a,numsignificant10/numgqtests)
if (numsignificant10/numgqtests < 0.1) dum <- 'OK' else dum <- 'NOK'
a<-table.element(a,dum)
a<-table.row.end(a)
a<-table.end(a)
table.save(a,file='mytable6.tab')
}