| Multiple Linear Regression - Estimated Regression Equation |
| intb[t] = + 3.10688684210527 -2.06943421052632x[t] + 0.0872578947368416M1[t] + 0.145799999999998M2[t] + 0.0669999999999987M3[t] -0.0408000000000015M4[t] -0.00900000000000142M5[t] -0.0226000000000013M6[t] -0.0472000000000012M7[t] -0.00880000000000143M8[t] + 0.00679999999999856M9[t] + 0.0513999999999987M10[t] + 0.0669999999999985M11[t] + e[t] |
| Multiple Linear Regression - Ordinary Least Squares | |||||
| Variable | Parameter | S.D. | T-STAT H0: parameter = 0 | 2-tail p-value | 1-tail p-value |
| (Intercept) | 3.10688684210527 | 0.429751 | 7.2295 | 0 | 0 |
| x | -2.06943421052632 | 0.298938 | -6.9226 | 0 | 0 |
| M1 | 0.0872578947368416 | 0.577603 | 0.1511 | 0.880554 | 0.440277 |
| M2 | 0.145799999999998 | 0.601849 | 0.2423 | 0.809616 | 0.404808 |
| M3 | 0.0669999999999987 | 0.601849 | 0.1113 | 0.911824 | 0.455912 |
| M4 | -0.0408000000000015 | 0.601849 | -0.0678 | 0.946234 | 0.473117 |
| M5 | -0.00900000000000142 | 0.601849 | -0.015 | 0.988131 | 0.494065 |
| M6 | -0.0226000000000013 | 0.601849 | -0.0376 | 0.970201 | 0.485101 |
| M7 | -0.0472000000000012 | 0.601849 | -0.0784 | 0.937816 | 0.468908 |
| M8 | -0.00880000000000143 | 0.601849 | -0.0146 | 0.988395 | 0.494197 |
| M9 | 0.00679999999999856 | 0.601849 | 0.0113 | 0.991032 | 0.495516 |
| M10 | 0.0513999999999987 | 0.601849 | 0.0854 | 0.932296 | 0.466148 |
| M11 | 0.0669999999999985 | 0.601849 | 0.1113 | 0.911824 | 0.455912 |
| Multiple Linear Regression - Regression Statistics | |
| Multiple R | 0.708445806051584 |
| R-squared | 0.501895460112078 |
| Adjusted R-squared | 0.377369325140098 |
| F-TEST (value) | 4.03044276789775 |
| F-TEST (DF numerator) | 12 |
| F-TEST (DF denominator) | 48 |
| p-value | 0.000253603796910418 |
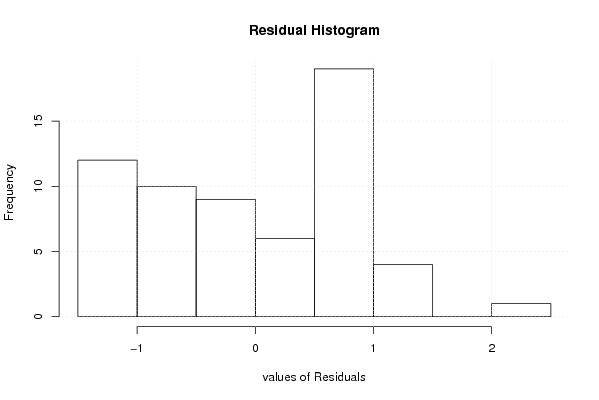
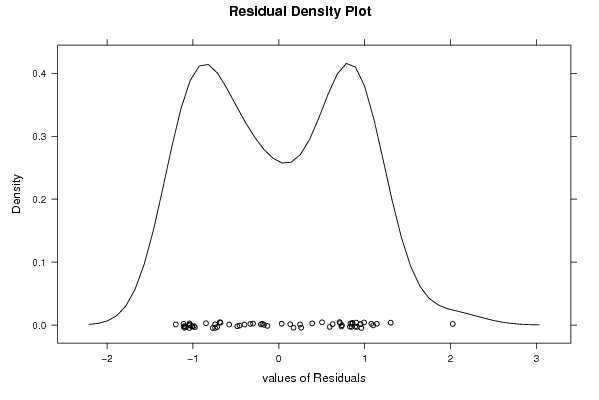
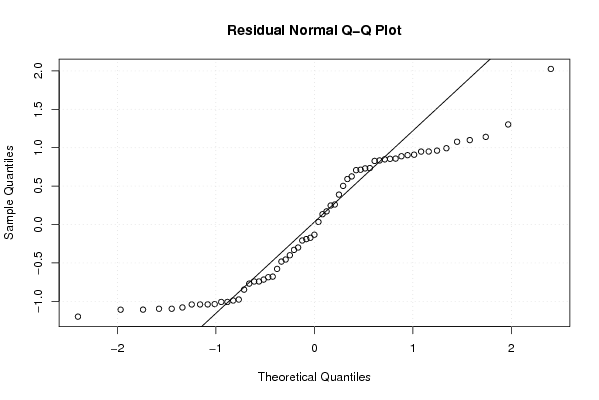
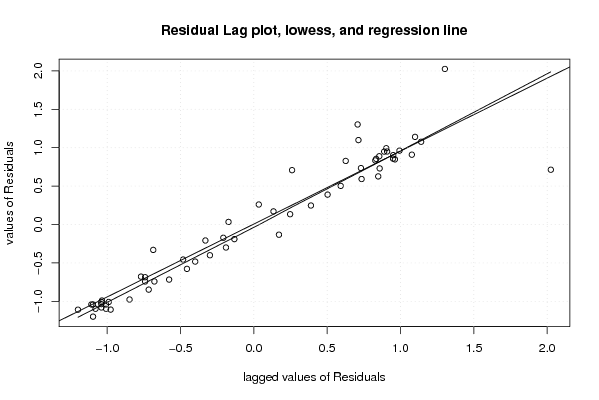
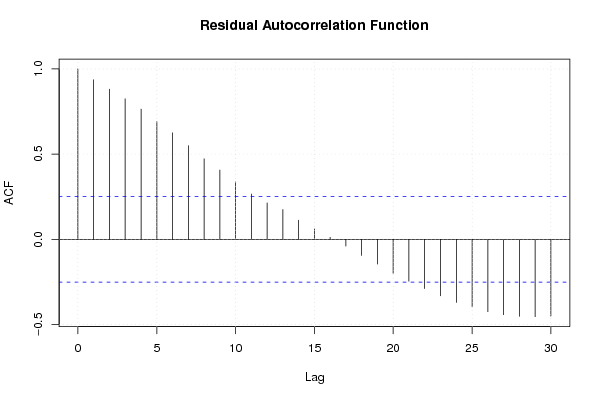
| Multiple Linear Regression - Residual Statistics | |
| Residual Standard Deviation | 0.951606738730537 |
| Sum Squared Residuals | 43.4666584894737 |
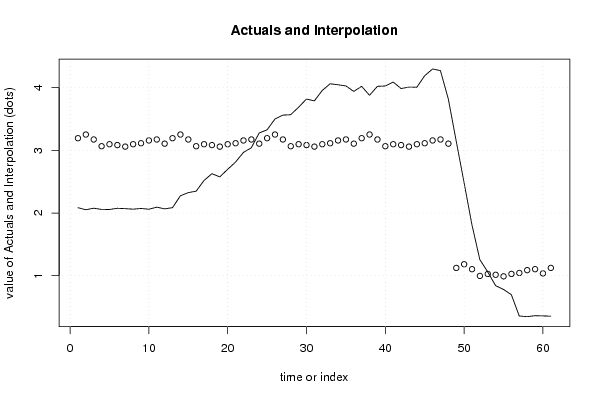
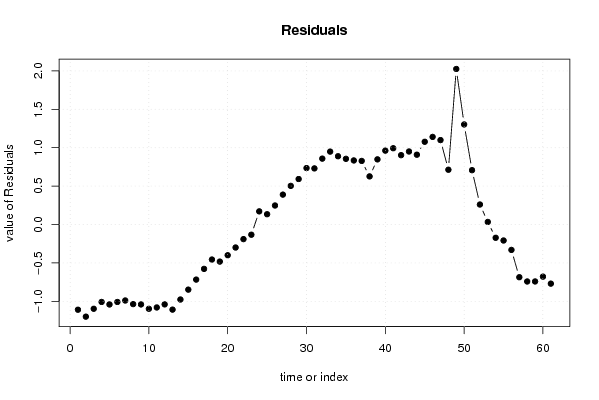
| Multiple Linear Regression - Actuals, Interpolation, and Residuals | |||
| Time or Index | Actuals | Interpolation Forecast | Residuals Prediction Error |
| 1 | 2.085 | 3.1941447368421 | -1.10914473684210 |
| 2 | 2.053 | 3.25268684210526 | -1.19968684210526 |
| 3 | 2.077 | 3.17388684210526 | -1.09688684210526 |
| 4 | 2.058 | 3.06608684210526 | -1.00808684210526 |
| 5 | 2.057 | 3.09788684210526 | -1.04088684210526 |
| 6 | 2.076 | 3.08428684210526 | -1.00828684210526 |
| 7 | 2.07 | 3.05968684210526 | -0.989686842105263 |
| 8 | 2.062 | 3.09808684210526 | -1.03608684210526 |
| 9 | 2.073 | 3.11368684210526 | -1.04068684210526 |
| 10 | 2.061 | 3.15828684210526 | -1.09728684210526 |
| 11 | 2.094 | 3.17388684210526 | -1.07988684210526 |
| 12 | 2.067 | 3.10688684210526 | -1.03988684210526 |
| 13 | 2.086 | 3.19414473684211 | -1.10814473684211 |
| 14 | 2.276 | 3.25268684210526 | -0.976686842105263 |
| 15 | 2.326 | 3.17388684210526 | -0.847886842105262 |
| 16 | 2.349 | 3.06608684210526 | -0.717086842105262 |
| 17 | 2.52 | 3.09788684210526 | -0.577886842105263 |
| 18 | 2.628 | 3.08428684210526 | -0.456286842105263 |
| 19 | 2.577 | 3.05968684210526 | -0.482686842105263 |
| 20 | 2.698 | 3.09808684210526 | -0.400086842105263 |
| 21 | 2.814 | 3.11368684210526 | -0.299686842105263 |
| 22 | 2.968 | 3.15828684210526 | -0.190286842105263 |
| 23 | 3.041 | 3.17388684210526 | -0.132886842105263 |
| 24 | 3.278 | 3.10688684210526 | 0.171113157894736 |
| 25 | 3.328 | 3.19414473684211 | 0.133855263157894 |
| 26 | 3.5 | 3.25268684210526 | 0.247313157894738 |
| 27 | 3.563 | 3.17388684210526 | 0.389113157894738 |
| 28 | 3.569 | 3.06608684210526 | 0.502913157894737 |
| 29 | 3.69 | 3.09788684210526 | 0.592113157894737 |
| 30 | 3.819 | 3.08428684210526 | 0.734713157894737 |
| 31 | 3.79 | 3.05968684210526 | 0.730313157894737 |
| 32 | 3.956 | 3.09808684210526 | 0.857913157894737 |
| 33 | 4.063 | 3.11368684210526 | 0.949313157894737 |
| 34 | 4.047 | 3.15828684210526 | 0.888713157894737 |
| 35 | 4.029 | 3.17388684210526 | 0.855113157894737 |
| 36 | 3.941 | 3.10688684210526 | 0.834113157894736 |
| 37 | 4.022 | 3.19414473684211 | 0.827855263157894 |
| 38 | 3.879 | 3.25268684210526 | 0.626313157894738 |
| 39 | 4.022 | 3.17388684210526 | 0.848113157894738 |
| 40 | 4.028 | 3.06608684210526 | 0.961913157894737 |
| 41 | 4.091 | 3.09788684210526 | 0.993113157894737 |
| 42 | 3.987 | 3.08428684210526 | 0.902713157894737 |
| 43 | 4.01 | 3.05968684210526 | 0.950313157894736 |
| 44 | 4.007 | 3.09808684210526 | 0.908913157894737 |
| 45 | 4.191 | 3.11368684210526 | 1.07731315789474 |
| 46 | 4.299 | 3.15828684210526 | 1.14071315789474 |
| 47 | 4.273 | 3.17388684210526 | 1.09911315789474 |
| 48 | 3.82 | 3.10688684210526 | 0.713113157894736 |
| 49 | 3.15 | 1.12471052631579 | 2.02528947368421 |
| 50 | 2.486 | 1.18325263157895 | 1.30274736842105 |
| 51 | 1.812 | 1.10445263157895 | 0.707547368421053 |
| 52 | 1.257 | 0.996652631578947 | 0.260347368421053 |
| 53 | 1.062 | 1.02845263157895 | 0.0335473684210529 |
| 54 | 0.842 | 1.01485263157895 | -0.172852631578947 |
| 55 | 0.782 | 0.990252631578947 | -0.208252631578947 |
| 56 | 0.698 | 1.02865263157895 | -0.330652631578947 |
| 57 | 0.358 | 1.04425263157895 | -0.686252631578947 |
| 58 | 0.347 | 1.08885263157895 | -0.741852631578948 |
| 59 | 0.363 | 1.10445263157895 | -0.741452631578947 |
| 60 | 0.359 | 1.03745263157895 | -0.678452631578949 |
| 61 | 0.355 | 1.12471052631579 | -0.76971052631579 |
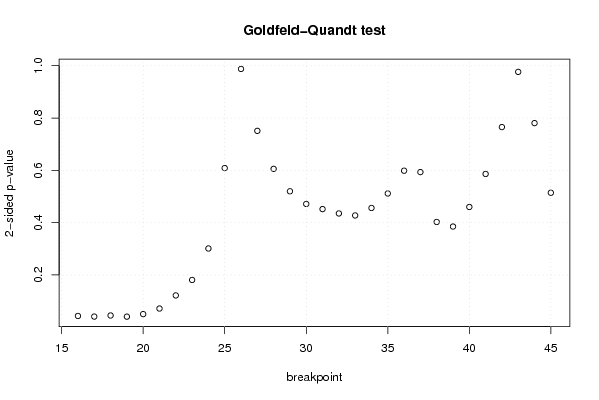
| Goldfeld-Quandt test for Heteroskedasticity | |||
| p-values | Alternative Hypothesis | ||
| breakpoint index | greater | 2-sided | less |
| 16 | 0.0216246604239485 | 0.0432493208478969 | 0.978375339576051 |
| 17 | 0.0204558964025943 | 0.0409117928051886 | 0.979544103597406 |
| 18 | 0.0225333673170088 | 0.0450667346340176 | 0.977466632682991 |
| 19 | 0.0203023852170628 | 0.0406047704341255 | 0.979697614782937 |
| 20 | 0.0251711940639224 | 0.0503423881278448 | 0.974828805936078 |
| 21 | 0.0357932192849327 | 0.0715864385698654 | 0.964206780715067 |
| 22 | 0.0608797794589089 | 0.121759558917818 | 0.939120220541091 |
| 23 | 0.0904247910905676 | 0.180849582181135 | 0.909575208909432 |
| 24 | 0.150593451833661 | 0.301186903667322 | 0.849406548166339 |
| 25 | 0.304292715138604 | 0.608585430277209 | 0.695707284861396 |
| 26 | 0.493747269709108 | 0.987494539418215 | 0.506252730290892 |
| 27 | 0.624589176944905 | 0.75082164611019 | 0.375410823055095 |
| 28 | 0.697180008447469 | 0.605639983105062 | 0.302819991552531 |
| 29 | 0.740056657500884 | 0.519886684998231 | 0.259943342499116 |
| 30 | 0.764293789907335 | 0.471412420185329 | 0.235706210092665 |
| 31 | 0.774120282256894 | 0.451759435486212 | 0.225879717743106 |
| 32 | 0.78243509093728 | 0.435129818125439 | 0.217564909062719 |
| 33 | 0.786274324472811 | 0.427451351054378 | 0.213725675527189 |
| 34 | 0.771994135905233 | 0.456011728189534 | 0.228005864094767 |
| 35 | 0.744266057159594 | 0.511467885680812 | 0.255733942840406 |
| 36 | 0.700740146812486 | 0.598519706375028 | 0.299259853187514 |
| 37 | 0.703409564891975 | 0.593180870216049 | 0.296590435108025 |
| 38 | 0.798693402358552 | 0.402613195282896 | 0.201306597641448 |
| 39 | 0.807460321269844 | 0.385079357460312 | 0.192539678730156 |
| 40 | 0.770075683238004 | 0.459848633523992 | 0.229924316761996 |
| 41 | 0.706955068428422 | 0.586089863143155 | 0.293044931571577 |
| 42 | 0.617321112942484 | 0.765357774115033 | 0.382678887057516 |
| 43 | 0.511872251031645 | 0.976255497936709 | 0.488127748968355 |
| 44 | 0.3901846910459 | 0.7803693820918 | 0.6098153089541 |
| 45 | 0.257122849880929 | 0.514245699761859 | 0.74287715011907 |
| Meta Analysis of Goldfeld-Quandt test for Heteroskedasticity | |||
| Description | # significant tests | % significant tests | OK/NOK |
| 1% type I error level | 0 | 0 | OK |
| 5% type I error level | 4 | 0.133333333333333 | NOK |
| 10% type I error level | 6 | 0.2 | NOK |