| Multiple Linear Regression - Estimated Regression Equation |
| Y[t] = + 4928.62068965517 -768.870689655172X[t] + e[t] |
| Multiple Linear Regression - Ordinary Least Squares | |||||
| Variable | Parameter | S.D. | T-STAT H0: parameter = 0 | 2-tail p-value | 1-tail p-value |
| (Intercept) | 4928.62068965517 | 108.116905 | 45.586 | 0 | 0 |
| X | -768.870689655172 | 149.273782 | -5.1507 | 3e-06 | 2e-06 |
| Multiple Linear Regression - Regression Statistics | |
| Multiple R | 0.556942268030847 |
| R-squared | 0.310184689919343 |
| Adjusted R-squared | 0.298492905002722 |
| F-TEST (value) | 26.5301399342694 |
| F-TEST (DF numerator) | 1 |
| F-TEST (DF denominator) | 59 |
| p-value | 3.13940417195901e-06 |
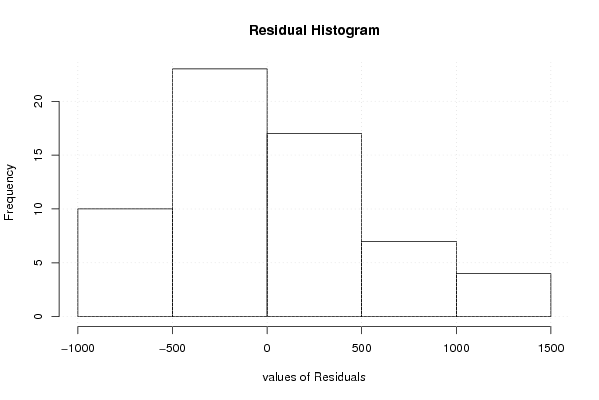
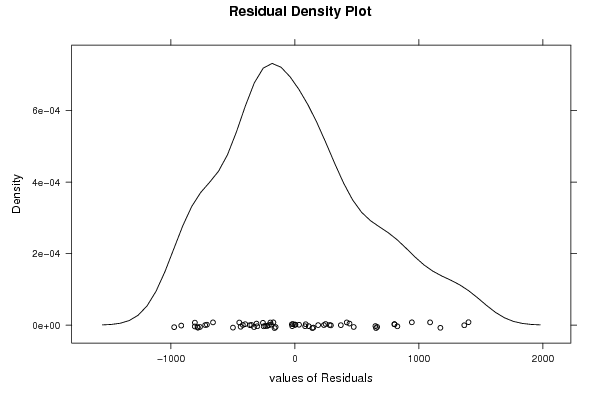
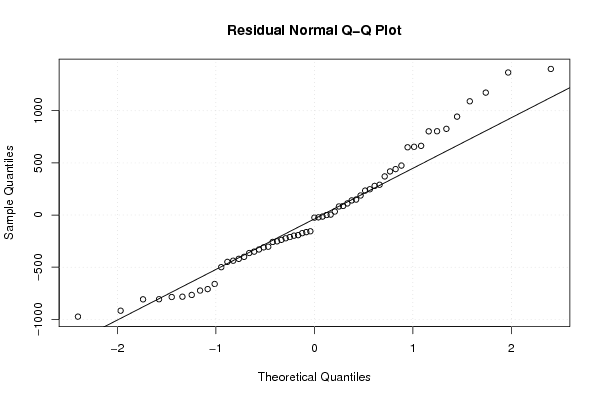
| Multiple Linear Regression - Residual Statistics | |
| Residual Standard Deviation | 582.227354212241 |
| Sum Squared Residuals | 20000332.8275862 |
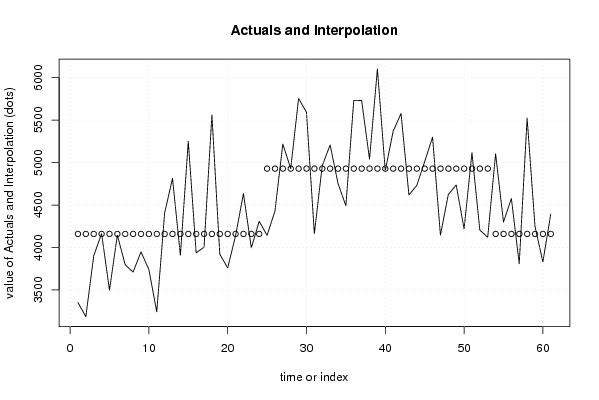
| Multiple Linear Regression - Actuals, Interpolation, and Residuals | |||
| Time or Index | Actuals | Interpolation Forecast | Residuals Prediction Error |
| 1 | 3353 | 4159.74999999999 | -806.74999999999 |
| 2 | 3186 | 4159.75 | -973.75 |
| 3 | 3902 | 4159.75 | -257.750000000000 |
| 4 | 4164 | 4159.75 | 4.24999999999969 |
| 5 | 3499 | 4159.75 | -660.75 |
| 6 | 4145 | 4159.75 | -14.7500000000003 |
| 7 | 3796 | 4159.75 | -363.750 |
| 8 | 3711 | 4159.75 | -448.75 |
| 9 | 3949 | 4159.75 | -210.750000000000 |
| 10 | 3740 | 4159.75 | -419.75 |
| 11 | 3243 | 4159.75 | -916.75 |
| 12 | 4407 | 4159.75 | 247.250000000000 |
| 13 | 4814 | 4159.75 | 654.25 |
| 14 | 3908 | 4159.75 | -251.750000000000 |
| 15 | 5250 | 4159.75 | 1090.25 |
| 16 | 3937 | 4159.75 | -222.750000000000 |
| 17 | 4004 | 4159.75 | -155.750000000000 |
| 18 | 5560 | 4159.75 | 1400.25 |
| 19 | 3922 | 4159.75 | -237.750000000000 |
| 20 | 3759 | 4159.75 | -400.750000000000 |
| 21 | 4138 | 4159.75 | -21.7500000000003 |
| 22 | 4634 | 4159.75 | 474.25 |
| 23 | 3996 | 4159.75 | -163.750000000000 |
| 24 | 4308 | 4159.75 | 148.250000000000 |
| 25 | 4143 | 4928.62068965517 | -785.620689655173 |
| 26 | 4429 | 4928.62068965517 | -499.620689655173 |
| 27 | 5219 | 4928.62068965517 | 290.379310344827 |
| 28 | 4929 | 4928.62068965517 | 0.379310344827474 |
| 29 | 5755 | 4928.62068965517 | 826.379310344827 |
| 30 | 5592 | 4928.62068965517 | 663.379310344827 |
| 31 | 4163 | 4928.62068965517 | -765.620689655173 |
| 32 | 4962 | 4928.62068965517 | 33.3793103448275 |
| 33 | 5208 | 4928.62068965517 | 279.379310344827 |
| 34 | 4755 | 4928.62068965517 | -173.620689655173 |
| 35 | 4491 | 4928.62068965517 | -437.620689655173 |
| 36 | 5732 | 4928.62068965517 | 803.379310344827 |
| 37 | 5731 | 4928.62068965517 | 802.379310344827 |
| 38 | 5040 | 4928.62068965517 | 111.379310344827 |
| 39 | 6102 | 4928.62068965517 | 1173.37931034483 |
| 40 | 4904 | 4928.62068965517 | -24.6206896551725 |
| 41 | 5369 | 4928.62068965517 | 440.379310344827 |
| 42 | 5578 | 4928.62068965517 | 649.379310344827 |
| 43 | 4619 | 4928.62068965517 | -309.620689655173 |
| 44 | 4731 | 4928.62068965517 | -197.620689655173 |
| 45 | 5011 | 4928.62068965517 | 82.3793103448275 |
| 46 | 5299 | 4928.62068965517 | 370.379310344827 |
| 47 | 4146 | 4928.62068965517 | -782.620689655173 |
| 48 | 4625 | 4928.62068965517 | -303.620689655173 |
| 49 | 4736 | 4928.62068965517 | -192.620689655173 |
| 50 | 4219 | 4928.62068965517 | -709.620689655173 |
| 51 | 5116 | 4928.62068965517 | 187.379310344827 |
| 52 | 4205 | 4928.62068965517 | -723.620689655173 |
| 53 | 4121 | 4928.62068965517 | -807.620689655173 |
| 54 | 5103 | 4159.75 | 943.25 |
| 55 | 4300 | 4159.75 | 140.250000000000 |
| 56 | 4578 | 4159.75 | 418.25 |
| 57 | 3809 | 4159.75 | -350.750 |
| 58 | 5526 | 4159.75 | 1366.25 |
| 59 | 4247 | 4159.75 | 87.2499999999997 |
| 60 | 3830 | 4159.75 | -329.750000000000 |
| 61 | 4394 | 4159.75 | 234.250000000000 |
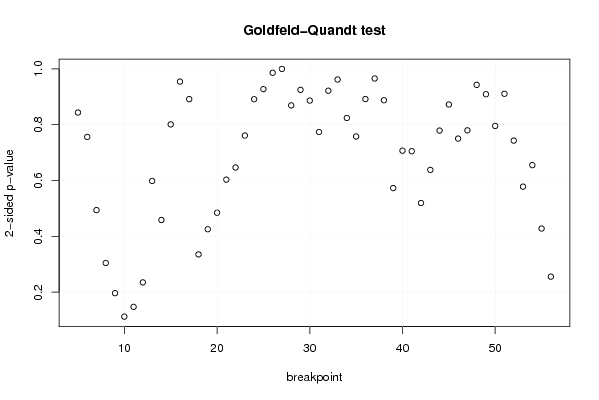
| Goldfeld-Quandt test for Heteroskedasticity | |||
| p-values | Alternative Hypothesis | ||
| breakpoint index | greater | 2-sided | less |
| 5 | 0.421828447741818 | 0.843656895483635 | 0.578171552258183 |
| 6 | 0.37813358148766 | 0.75626716297532 | 0.62186641851234 |
| 7 | 0.247139681482926 | 0.494279362965852 | 0.752860318517074 |
| 8 | 0.152425245059442 | 0.304850490118884 | 0.847574754940558 |
| 9 | 0.0983547024715162 | 0.196709404943032 | 0.901645297528484 |
| 10 | 0.0562718849000152 | 0.112543769800030 | 0.943728115099985 |
| 11 | 0.0738230108440166 | 0.147646021688033 | 0.926176989155983 |
| 12 | 0.117645058980574 | 0.235290117961148 | 0.882354941019426 |
| 13 | 0.299296052670174 | 0.598592105340347 | 0.700703947329826 |
| 14 | 0.22943053134549 | 0.45886106269098 | 0.77056946865451 |
| 15 | 0.599353150081758 | 0.801293699836484 | 0.400646849918242 |
| 16 | 0.522762032332511 | 0.954475935334978 | 0.477237967667489 |
| 17 | 0.445824412716702 | 0.891648825433405 | 0.554175587283298 |
| 18 | 0.832193657426404 | 0.335612685147191 | 0.167806342573595 |
| 19 | 0.787162031927546 | 0.425675936144908 | 0.212837968072454 |
| 20 | 0.757594853959264 | 0.484810292081471 | 0.242405146040736 |
| 21 | 0.698371866118307 | 0.603256267763387 | 0.301628133881693 |
| 22 | 0.676541589399226 | 0.646916821201549 | 0.323458410600774 |
| 23 | 0.619353665090258 | 0.761292669819484 | 0.380646334909742 |
| 24 | 0.554288052245527 | 0.891423895508946 | 0.445711947754473 |
| 25 | 0.53625750045066 | 0.92748499909868 | 0.46374249954934 |
| 26 | 0.493034001465934 | 0.986068002931868 | 0.506965998534066 |
| 27 | 0.499902876935601 | 0.999805753871202 | 0.500097123064399 |
| 28 | 0.434634734755262 | 0.869269469510524 | 0.565365265244738 |
| 29 | 0.537510447643594 | 0.924979104712812 | 0.462489552356406 |
| 30 | 0.556767381129516 | 0.886465237740967 | 0.443232618870484 |
| 31 | 0.612982356985027 | 0.774035286029947 | 0.387017643014973 |
| 32 | 0.539074779256421 | 0.921850441487158 | 0.460925220743579 |
| 33 | 0.480943901957897 | 0.961887803915794 | 0.519056098042103 |
| 34 | 0.412120088013933 | 0.824240176027865 | 0.587879911986067 |
| 35 | 0.378969957582511 | 0.757939915165021 | 0.62103004241749 |
| 36 | 0.445967976130153 | 0.891935952260306 | 0.554032023869847 |
| 37 | 0.517111744070765 | 0.96577651185847 | 0.482888255929235 |
| 38 | 0.443838866542169 | 0.887677733084339 | 0.556161133457831 |
| 39 | 0.713472830632957 | 0.573054338734085 | 0.286527169367043 |
| 40 | 0.646513937079051 | 0.706972125841897 | 0.353486062920949 |
| 41 | 0.647374595233811 | 0.705250809532378 | 0.352625404766189 |
| 42 | 0.74019508014795 | 0.5196098397041 | 0.25980491985205 |
| 43 | 0.680903793953448 | 0.638192412093103 | 0.319096206046552 |
| 44 | 0.61048152273178 | 0.779036954536439 | 0.389518477268219 |
| 45 | 0.563790518840561 | 0.872418962318877 | 0.436209481159439 |
| 46 | 0.624835140441168 | 0.750329719117664 | 0.375164859558832 |
| 47 | 0.610064478898808 | 0.779871042202385 | 0.389935521101192 |
| 48 | 0.528614140740483 | 0.942771718519033 | 0.471385859259517 |
| 49 | 0.4546494880671 | 0.9092989761342 | 0.5453505119329 |
| 50 | 0.397835388384377 | 0.795670776768754 | 0.602164611615623 |
| 51 | 0.455385576688414 | 0.910771153376827 | 0.544614423311586 |
| 52 | 0.371569821029175 | 0.743139642058349 | 0.628430178970825 |
| 53 | 0.289084582819584 | 0.578169165639168 | 0.710915417180416 |
| 54 | 0.327605504484744 | 0.655211008969488 | 0.672394495515256 |
| 55 | 0.214073034495084 | 0.428146068990168 | 0.785926965504916 |
| 56 | 0.12792019280355 | 0.2558403856071 | 0.87207980719645 |
| Meta Analysis of Goldfeld-Quandt test for Heteroskedasticity | |||
| Description | # significant tests | % significant tests | OK/NOK |
| 1% type I error level | 0 | 0 | OK |
| 5% type I error level | 0 | 0 | OK |
| 10% type I error level | 0 | 0 | OK |