| Multiple Linear Regression - Estimated Regression Equation |
| Consvertr[t] = + 3.55671726525572 + 0.00638085941225368Aand[t] -0.338286051714473M1[t] -2.24724893355562M2[t] + 0.00822180782049912M3[t] -0.964857073231493M4[t] + 0.0778597387859022M5[t] -0.493834744584925M6[t] -0.0836314772970198M7[t] -2.52054447590919M8[t] -3.12456273564482M9[t] -0.332805124311363M10[t] + 0.34971383130199M11[t] -0.191708221875839t + e[t] |
| Multiple Linear Regression - Ordinary Least Squares | |||||
| Variable | Parameter | S.D. | T-STAT H0: parameter = 0 | 2-tail p-value | 1-tail p-value |
| (Intercept) | 3.55671726525572 | 2.470807 | 1.4395 | 0.156638 | 0.078319 |
| Aand | 0.00638085941225368 | 0.000536 | 11.9096 | 0 | 0 |
| M1 | -0.338286051714473 | 2.045623 | -0.1654 | 0.869362 | 0.434681 |
| M2 | -2.24724893355562 | 2.150727 | -1.0449 | 0.301423 | 0.150712 |
| M3 | 0.00822180782049912 | 2.145392 | 0.0038 | 0.996958 | 0.498479 |
| M4 | -0.964857073231493 | 2.142051 | -0.4504 | 0.654467 | 0.327234 |
| M5 | 0.0778597387859022 | 2.139806 | 0.0364 | 0.971128 | 0.485564 |
| M6 | -0.493834744584925 | 2.138465 | -0.2309 | 0.818372 | 0.409186 |
| M7 | -0.0836314772970198 | 2.136255 | -0.0391 | 0.968938 | 0.484469 |
| M8 | -2.52054447590919 | 2.134929 | -1.1806 | 0.243693 | 0.121847 |
| M9 | -3.12456273564482 | 2.133861 | -1.4643 | 0.149776 | 0.074888 |
| M10 | -0.332805124311363 | 2.133192 | -0.156 | 0.876691 | 0.438346 |
| M11 | 0.34971383130199 | 2.132826 | 0.164 | 0.87046 | 0.43523 |
| t | -0.191708221875839 | 0.024927 | -7.6909 | 0 | 0 |
| Multiple Linear Regression - Regression Statistics | |
| Multiple R | 0.900153925921666 |
| R-squared | 0.810277090352189 |
| Adjusted R-squared | 0.757800540875134 |
| F-TEST (value) | 15.4407463605527 |
| F-TEST (DF numerator) | 13 |
| F-TEST (DF denominator) | 47 |
| p-value | 8.77964367873574e-13 |
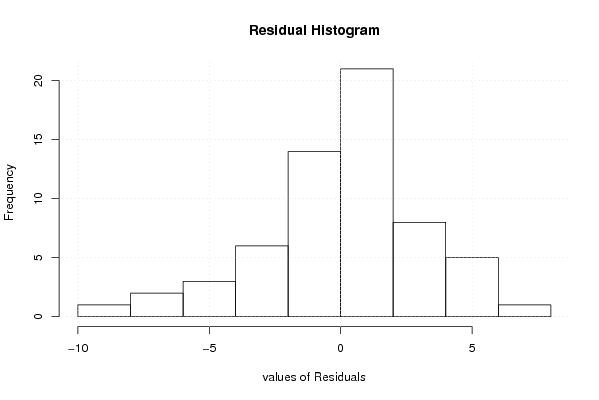
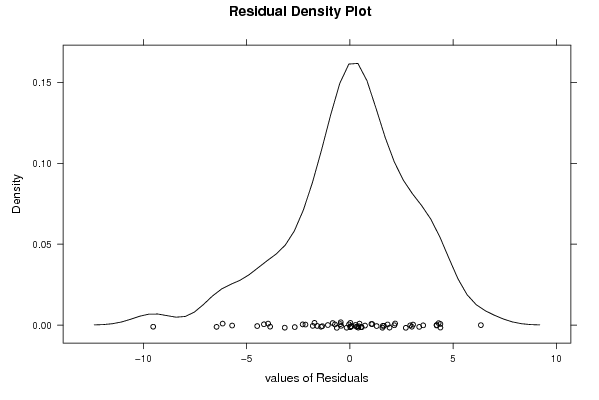
| Multiple Linear Regression - Residual Statistics | |
| Residual Standard Deviation | 3.3718656391664 |
| Sum Squared Residuals | 534.365460763779 |
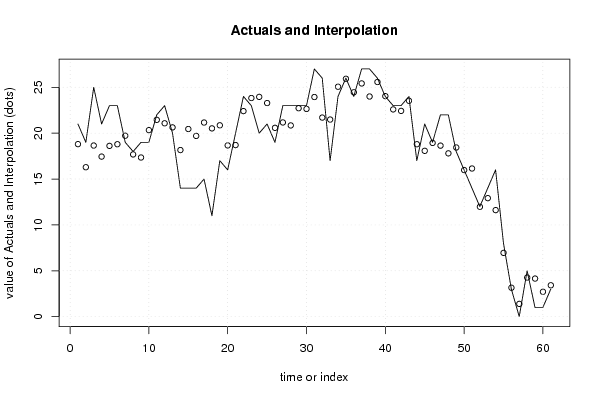
| Multiple Linear Regression - Actuals, Interpolation, and Residuals | |||
| Time or Index | Actuals | Interpolation Forecast | Residuals Prediction Error |
| 1 | 21 | 18.8053759548805 | 2.19462404511954 |
| 2 | 19 | 16.2886090088904 | 2.71139099110961 |
| 3 | 25 | 18.6523995379548 | 6.34760046204518 |
| 4 | 21 | 17.4456901886885 | 3.55430981131151 |
| 5 | 23 | 18.6144017689662 | 4.38559823103384 |
| 6 | 23 | 18.7940900848506 | 4.20590991514943 |
| 7 | 19 | 19.7216262281523 | -0.721626228152276 |
| 8 | 18 | 17.6832983118919 | 0.316701688108146 |
| 9 | 19 | 17.3480784540627 | 1.65192154593727 |
| 10 | 19 | 20.3335955606146 | -1.33359556061459 |
| 11 | 22 | 21.4543885441239 | 0.545611455876085 |
| 12 | 23 | 21.0765717262763 | 1.92342827372373 |
| 13 | 20 | 20.6301029023924 | -0.630102902392358 |
| 14 | 14 | 18.1590229097940 | -4.15902290979404 |
| 15 | 14 | 20.4528154111061 | -6.45281541110607 |
| 16 | 14 | 19.6988280371391 | -5.69882803713913 |
| 17 | 15 | 21.1590172753685 | -6.15901727536854 |
| 18 | 11 | 20.5222746294551 | -9.52227462945511 |
| 19 | 17 | 20.8576032107055 | -3.85760321070554 |
| 20 | 16 | 18.667155606057 | -2.66715560605699 |
| 21 | 20 | 18.7020894027327 | 1.29791059726730 |
| 22 | 24 | 22.4051341501925 | 1.59486584980751 |
| 23 | 23 | 23.8277417839014 | -0.827741783901411 |
| 24 | 20 | 23.955671883069 | -3.95567188306899 |
| 25 | 21 | 23.2824273156736 | -2.28242731567359 |
| 26 | 19 | 20.5790840404692 | -1.57908404046924 |
| 27 | 23 | 21.1692508873037 | 1.83074911269635 |
| 28 | 23 | 20.8434829884931 | 2.15651701150694 |
| 29 | 23 | 22.7196404518073 | 0.280359548192708 |
| 30 | 23 | 22.6442858169839 | 0.355714183016064 |
| 31 | 27 | 23.9374452046078 | 3.06255479539223 |
| 32 | 26 | 21.6995240059320 | 4.30047599406795 |
| 33 | 17 | 21.4853490511534 | -4.48534905115338 |
| 34 | 24 | 25.0617975478741 | -1.06179754787406 |
| 35 | 26 | 25.9273561548932 | 0.0726438451067698 |
| 36 | 24 | 24.4564981197265 | -0.456498119726525 |
| 37 | 27 | 25.4214753978331 | 1.57852460216687 |
| 38 | 27 | 23.9951973253972 | 3.00480267460277 |
| 39 | 26 | 25.5768221077076 | 0.423177892292376 |
| 40 | 24 | 24.0383718775982 | -0.0383718775982237 |
| 41 | 23 | 22.5902292043165 | 0.409770795683464 |
| 42 | 23 | 22.4264358580393 | 0.573564141960659 |
| 43 | 24 | 23.5302113383075 | 0.469788661692517 |
| 44 | 17 | 18.7955874688052 | -1.79558746880515 |
| 45 | 21 | 18.0732408704346 | 2.9267591295654 |
| 46 | 19 | 18.9364841364709 | 0.0635158635291115 |
| 47 | 22 | 18.6391949242010 | 3.36080507579905 |
| 48 | 22 | 17.8005524396003 | 4.19944756039965 |
| 49 | 18 | 18.4396592275232 | -0.439659227523154 |
| 50 | 16 | 15.9780867154491 | 0.0219132845509014 |
| 51 | 14 | 16.1487120559278 | -2.14871205592783 |
| 52 | 12 | 11.9736269080811 | 0.0263730919189082 |
| 53 | 14 | 12.9167112995415 | 1.08328870045853 |
| 54 | 16 | 11.6129136106710 | 4.38708638932896 |
| 55 | 8 | 6.95311401822693 | 1.04688598177307 |
| 56 | 3 | 3.15443460731396 | -0.154434607313957 |
| 57 | 0 | 1.39124222161659 | -1.39124222161659 |
| 58 | 5 | 4.26298860484797 | 0.737011395152033 |
| 59 | 1 | 4.15131859288049 | -3.15131859288049 |
| 60 | 1 | 2.71070583132787 | -1.71070583132787 |
| 61 | 3 | 3.42095920169731 | -0.420959201697308 |
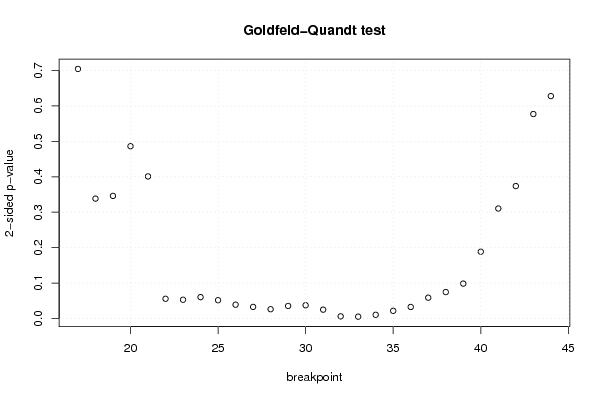
| Goldfeld-Quandt test for Heteroskedasticity | |||
| p-values | Alternative Hypothesis | ||
| breakpoint index | greater | 2-sided | less |
| 17 | 0.647755524161479 | 0.704488951677043 | 0.352244475838521 |
| 18 | 0.830795578812094 | 0.338408842375812 | 0.169204421187906 |
| 19 | 0.826986180301022 | 0.346027639397956 | 0.173013819698978 |
| 20 | 0.756837232235447 | 0.486325535529106 | 0.243162767764553 |
| 21 | 0.799472477190551 | 0.401055045618897 | 0.200527522809449 |
| 22 | 0.97219971065377 | 0.0556005786924605 | 0.0278002893462303 |
| 23 | 0.973584764978743 | 0.0528304700425139 | 0.0264152350212570 |
| 24 | 0.96991011601501 | 0.06017976796998 | 0.03008988398499 |
| 25 | 0.974194328669559 | 0.0516113426608827 | 0.0258056713304413 |
| 26 | 0.9805711393198 | 0.0388577213604003 | 0.0194288606802002 |
| 27 | 0.98372079373444 | 0.0325584125311222 | 0.0162792062655611 |
| 28 | 0.986951654214638 | 0.0260966915707243 | 0.0130483457853622 |
| 29 | 0.98235589807625 | 0.0352882038475021 | 0.0176441019237511 |
| 30 | 0.981367489741675 | 0.037265020516651 | 0.0186325102583255 |
| 31 | 0.987590511981154 | 0.0248189760376923 | 0.0124094880188461 |
| 32 | 0.99701846712486 | 0.00596306575027921 | 0.00298153287513961 |
| 33 | 0.997454965692443 | 0.00509006861511411 | 0.00254503430755705 |
| 34 | 0.99483988223823 | 0.0103202355235398 | 0.00516011776176991 |
| 35 | 0.989203787346101 | 0.0215924253077974 | 0.0107962126538987 |
| 36 | 0.983756121432018 | 0.0324877571359634 | 0.0162438785679817 |
| 37 | 0.970678904327817 | 0.0586421913443661 | 0.0293210956721831 |
| 38 | 0.96276336176941 | 0.0744732764611793 | 0.0372366382305896 |
| 39 | 0.950798534567316 | 0.0984029308653678 | 0.0492014654326839 |
| 40 | 0.905782373694776 | 0.188435252610447 | 0.0942176263052237 |
| 41 | 0.844776359345753 | 0.310447281308495 | 0.155223640654247 |
| 42 | 0.81308761571761 | 0.373824768564781 | 0.186912384282390 |
| 43 | 0.711392567503433 | 0.577214864993133 | 0.288607432496567 |
| 44 | 0.686073945463068 | 0.627852109073864 | 0.313926054536932 |
| Meta Analysis of Goldfeld-Quandt test for Heteroskedasticity | |||
| Description | # significant tests | % significant tests | OK/NOK |
| 1% type I error level | 2 | 0.0714285714285714 | NOK |
| 5% type I error level | 11 | 0.392857142857143 | NOK |
| 10% type I error level | 18 | 0.642857142857143 | NOK |