| Multiple Linear Regression - Estimated Regression Equation |
| Promet[t] = + 124.4 -11.4241379310345Dummy[t] + e[t] |
| Multiple Linear Regression - Ordinary Least Squares | |||||
| Variable | Parameter | S.D. | T-STAT H0: parameter = 0 | 2-tail p-value | 1-tail p-value |
| (Intercept) | 124.4 | 3.015906 | 41.248 | 0 | 0 |
| Dummy | -11.4241379310345 | 4.338049 | -2.6335 | 0.010817 | 0.005408 |
| Multiple Linear Regression - Regression Statistics | |
| Multiple R | 0.32680517137013 |
| R-squared | 0.106801620034260 |
| Adjusted R-squared | 0.0914016479658856 |
| F-TEST (value) | 6.93518271072625 |
| F-TEST (DF numerator) | 1 |
| F-TEST (DF denominator) | 58 |
| p-value | 0.0108165836382075 |
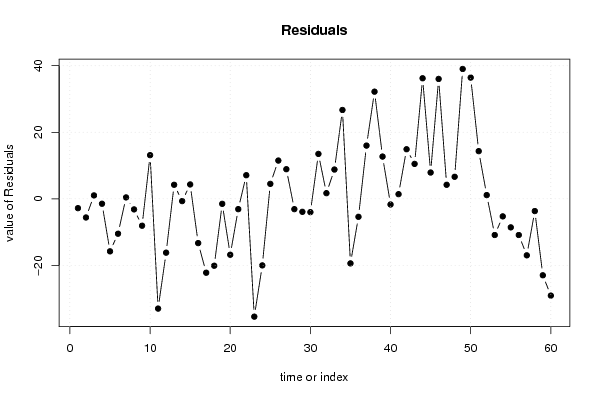
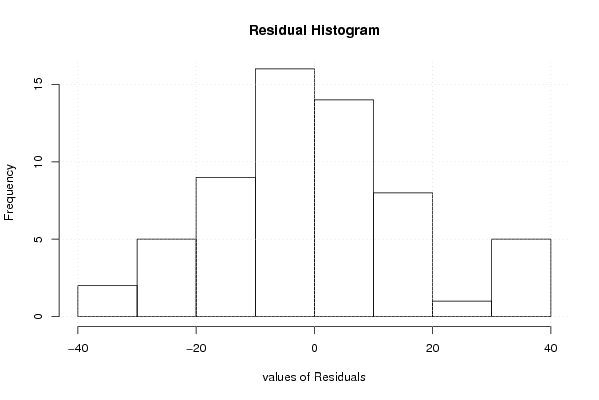
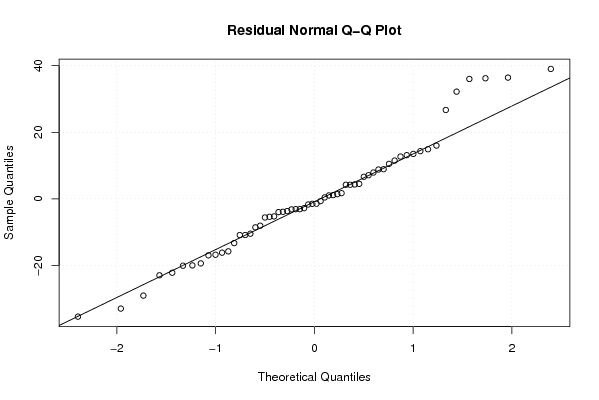
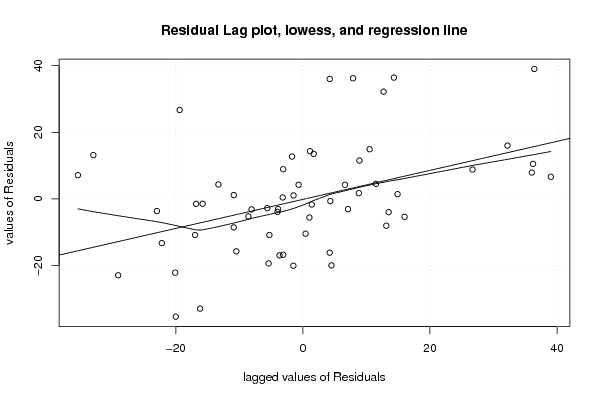
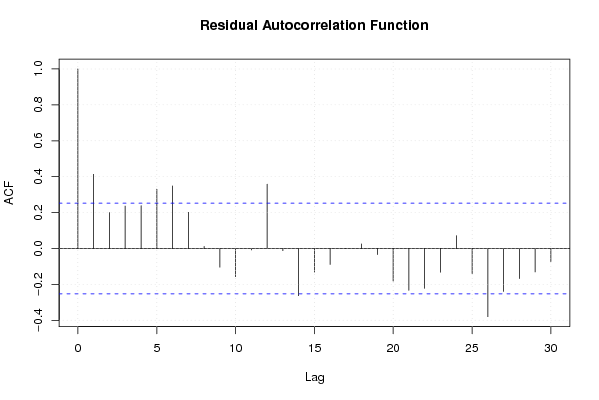
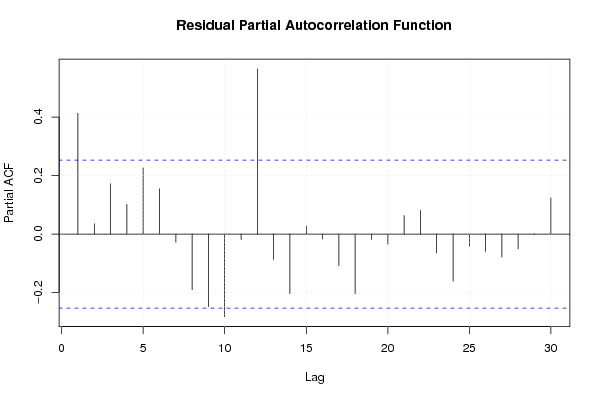
| Multiple Linear Regression - Residual Statistics | |
| Residual Standard Deviation | 16.7918561457057 |
| Sum Squared Residuals | 16354.0531034483 |
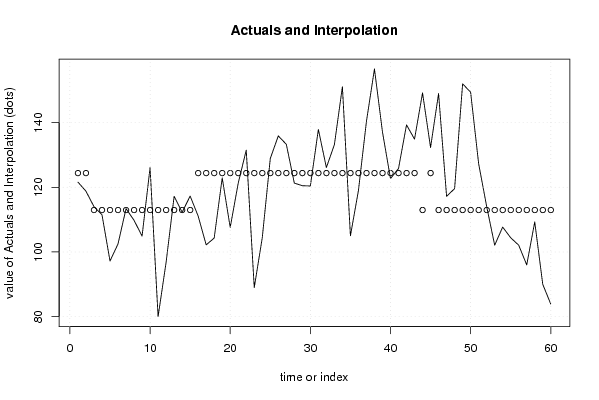
| Multiple Linear Regression - Actuals, Interpolation, and Residuals | |||
| Time or Index | Actuals | Interpolation Forecast | Residuals Prediction Error |
| 1 | 121.6 | 124.4 | -2.7999999999999 |
| 2 | 118.8 | 124.4 | -5.59999999999997 |
| 3 | 114 | 112.975862068966 | 1.02413793103448 |
| 4 | 111.5 | 112.975862068966 | -1.47586206896552 |
| 5 | 97.2 | 112.975862068966 | -15.7758620689655 |
| 6 | 102.5 | 112.975862068966 | -10.4758620689655 |
| 7 | 113.4 | 112.975862068966 | 0.42413793103449 |
| 8 | 109.8 | 112.975862068966 | -3.17586206896552 |
| 9 | 104.9 | 112.975862068966 | -8.0758620689655 |
| 10 | 126.1 | 112.975862068966 | 13.1241379310345 |
| 11 | 80 | 112.975862068966 | -32.9758620689655 |
| 12 | 96.8 | 112.975862068966 | -16.1758620689655 |
| 13 | 117.2 | 112.975862068966 | 4.22413793103449 |
| 14 | 112.3 | 112.975862068966 | -0.675862068965519 |
| 15 | 117.3 | 112.975862068966 | 4.32413793103448 |
| 16 | 111.1 | 124.4 | -13.3 |
| 17 | 102.2 | 124.4 | -22.2 |
| 18 | 104.3 | 124.4 | -20.1 |
| 19 | 122.9 | 124.4 | -1.5 |
| 20 | 107.6 | 124.4 | -16.8 |
| 21 | 121.3 | 124.4 | -3.10000000000001 |
| 22 | 131.5 | 124.4 | 7.1 |
| 23 | 89 | 124.4 | -35.4 |
| 24 | 104.4 | 124.4 | -20 |
| 25 | 128.9 | 124.4 | 4.5 |
| 26 | 135.9 | 124.4 | 11.5 |
| 27 | 133.3 | 124.4 | 8.9 |
| 28 | 121.3 | 124.4 | -3.10000000000001 |
| 29 | 120.5 | 124.4 | -3.90000000000001 |
| 30 | 120.4 | 124.4 | -4 |
| 31 | 137.9 | 124.4 | 13.5 |
| 32 | 126.1 | 124.4 | 1.69999999999999 |
| 33 | 133.2 | 124.4 | 8.79999999999998 |
| 34 | 151.1 | 124.4 | 26.7 |
| 35 | 105 | 124.4 | -19.4 |
| 36 | 119 | 124.4 | -5.40000000000001 |
| 37 | 140.4 | 124.4 | 16 |
| 38 | 156.6 | 124.4 | 32.2 |
| 39 | 137.1 | 124.4 | 12.7 |
| 40 | 122.7 | 124.4 | -1.70000000000000 |
| 41 | 125.8 | 124.4 | 1.39999999999999 |
| 42 | 139.3 | 124.4 | 14.9 |
| 43 | 134.9 | 124.4 | 10.5 |
| 44 | 149.2 | 112.975862068966 | 36.2241379310345 |
| 45 | 132.3 | 124.4 | 7.9 |
| 46 | 149 | 112.975862068966 | 36.0241379310345 |
| 47 | 117.2 | 112.975862068966 | 4.22413793103449 |
| 48 | 119.6 | 112.975862068966 | 6.62413793103448 |
| 49 | 152 | 112.975862068966 | 39.0241379310345 |
| 50 | 149.4 | 112.975862068966 | 36.4241379310345 |
| 51 | 127.3 | 112.975862068966 | 14.3241379310345 |
| 52 | 114.1 | 112.975862068966 | 1.12413793103448 |
| 53 | 102.1 | 112.975862068966 | -10.8758620689655 |
| 54 | 107.7 | 112.975862068966 | -5.27586206896551 |
| 55 | 104.4 | 112.975862068966 | -8.5758620689655 |
| 56 | 102.1 | 112.975862068966 | -10.8758620689655 |
| 57 | 96 | 112.975862068966 | -16.9758620689655 |
| 58 | 109.3 | 112.975862068966 | -3.67586206896552 |
| 59 | 90 | 112.975862068966 | -22.9758620689655 |
| 60 | 83.9 | 112.975862068966 | -29.0758620689655 |
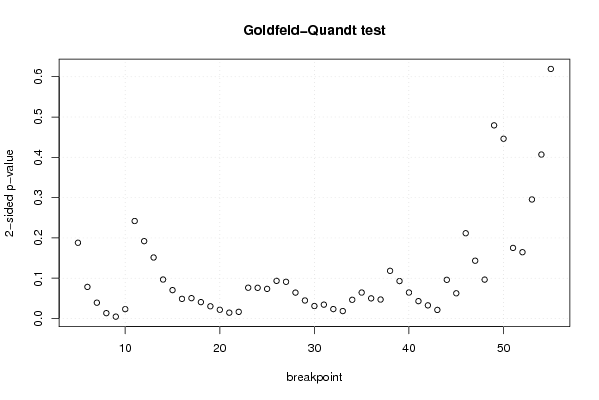
| Goldfeld-Quandt test for Heteroskedasticity | |||
| p-values | Alternative Hypothesis | ||
| breakpoint index | greater | 2-sided | less |
| 5 | 0.0939902350407477 | 0.187980470081495 | 0.906009764959252 |
| 6 | 0.039226137632197 | 0.078452275264394 | 0.960773862367803 |
| 7 | 0.0196305945093801 | 0.0392611890187603 | 0.98036940549062 |
| 8 | 0.00667414288489343 | 0.0133482857697869 | 0.993325857115107 |
| 9 | 0.00231257681564677 | 0.00462515363129354 | 0.997687423184353 |
| 10 | 0.0116286147191797 | 0.0232572294383593 | 0.98837138528082 |
| 11 | 0.120958204106533 | 0.241916408213066 | 0.879041795893467 |
| 12 | 0.095980125353469 | 0.191960250706938 | 0.904019874646531 |
| 13 | 0.0757102056385647 | 0.151420411277129 | 0.924289794361435 |
| 14 | 0.0483690034528477 | 0.0967380069056953 | 0.951630996547152 |
| 15 | 0.0352310275067262 | 0.0704620550134524 | 0.964768972493274 |
| 16 | 0.024391017609826 | 0.048782035219652 | 0.975608982390174 |
| 17 | 0.0252511568283339 | 0.0505023136566677 | 0.974748843171666 |
| 18 | 0.0203398035027947 | 0.0406796070055895 | 0.979660196497205 |
| 19 | 0.015166849075496 | 0.030333698150992 | 0.984833150924504 |
| 20 | 0.0108320007467589 | 0.0216640014935178 | 0.98916799925324 |
| 21 | 0.00725367810343577 | 0.0145073562068715 | 0.992746321896564 |
| 22 | 0.00826849796271445 | 0.0165369959254289 | 0.991731502037286 |
| 23 | 0.0381984537522667 | 0.0763969075045335 | 0.961801546247733 |
| 24 | 0.0380777494208406 | 0.0761554988416811 | 0.96192225057916 |
| 25 | 0.0367641710719259 | 0.0735283421438517 | 0.963235828928074 |
| 26 | 0.0467182238031297 | 0.0934364476062594 | 0.95328177619687 |
| 27 | 0.0455435735306809 | 0.0910871470613618 | 0.95445642646932 |
| 28 | 0.0321449776512332 | 0.0642899553024664 | 0.967855022348767 |
| 29 | 0.0223929576451614 | 0.0447859152903227 | 0.977607042354839 |
| 30 | 0.0154752036853188 | 0.0309504073706376 | 0.984524796314681 |
| 31 | 0.017191535844247 | 0.034383071688494 | 0.982808464155753 |
| 32 | 0.0117012339220897 | 0.0234024678441793 | 0.98829876607791 |
| 33 | 0.00925259510631792 | 0.0185051902126358 | 0.990747404893682 |
| 34 | 0.0232151234027526 | 0.0464302468055051 | 0.976784876597247 |
| 35 | 0.0322136910459226 | 0.0644273820918451 | 0.967786308954077 |
| 36 | 0.0249951142329334 | 0.0499902284658669 | 0.975004885767067 |
| 37 | 0.023544676644929 | 0.047089353289858 | 0.976455323355071 |
| 38 | 0.0591536349816425 | 0.118307269963285 | 0.940846365018357 |
| 39 | 0.0464669571657812 | 0.0929339143315623 | 0.953533042834219 |
| 40 | 0.0322210981439874 | 0.0644421962879748 | 0.967778901856013 |
| 41 | 0.0215553633977488 | 0.0431107267954975 | 0.978444636602251 |
| 42 | 0.0163199943813772 | 0.0326399887627544 | 0.983680005618623 |
| 43 | 0.0106675301307135 | 0.0213350602614269 | 0.989332469869286 |
| 44 | 0.0480117725883037 | 0.0960235451766075 | 0.951988227411696 |
| 45 | 0.0312996057356753 | 0.0625992114713506 | 0.968700394264325 |
| 46 | 0.105796586506138 | 0.211593173012276 | 0.894203413493862 |
| 47 | 0.0716986003852237 | 0.143397200770447 | 0.928301399614776 |
| 48 | 0.0482531454457816 | 0.0965062908915633 | 0.951746854554218 |
| 49 | 0.239642722424996 | 0.479285444849992 | 0.760357277575004 |
| 50 | 0.776972366306014 | 0.446055267387971 | 0.223027633693986 |
| 51 | 0.912437622040365 | 0.175124755919270 | 0.0875623779596351 |
| 52 | 0.917728271410407 | 0.164543457179185 | 0.0822717285895927 |
| 53 | 0.852323028364514 | 0.295353943270972 | 0.147676971635486 |
| 54 | 0.796587032969806 | 0.406825934060388 | 0.203412967030194 |
| 55 | 0.690384406450747 | 0.619231187098506 | 0.309615593549253 |
| Meta Analysis of Goldfeld-Quandt test for Heteroskedasticity | |||
| Description | # significant tests | % significant tests | OK/NOK |
| 1% type I error level | 1 | 0.0196078431372549 | NOK |
| 5% type I error level | 21 | 0.411764705882353 | NOK |
| 10% type I error level | 37 | 0.725490196078431 | NOK |