| Multiple Linear Regression - Estimated Regression Equation |
| Consvertr[t] = -2.30802815173133 + 0.0038777162416759Aand[t] + 0.405105033674106Y1[t] + 0.0408529815879891Y2[t] + 0.108240589410743Y3[t] -0.0693297363740693Y4[t] + 2.15292212174366M1[t] + 1.04935628306701M2[t] + 1.59721168826427M3[t] -1.18333001580422M4[t] -0.48610405600735M5[t] + 2.64584732173502M6[t] + 2.47449066262075M7[t] + 1.4250603170624M8[t] + 0.806606050478028M9[t] -1.59756470173195M10[t] + 0.569132549626265M11[t] -0.0939253055905727t + e[t] |
| Multiple Linear Regression - Ordinary Least Squares | |||||
| Variable | Parameter | S.D. | T-STAT H0: parameter = 0 | 2-tail p-value | 1-tail p-value |
| (Intercept) | -2.30802815173133 | 2.604447 | -0.8862 | 0.380948 | 0.190474 |
| Aand | 0.0038777162416759 | 0.000973 | 3.985 | 0.000286 | 0.000143 |
| Y1 | 0.405105033674106 | 0.155759 | 2.6008 | 0.013071 | 0.006536 |
| Y2 | 0.0408529815879891 | 0.161486 | 0.253 | 0.801611 | 0.400805 |
| Y3 | 0.108240589410743 | 0.16471 | 0.6572 | 0.514938 | 0.257469 |
| Y4 | -0.0693297363740693 | 0.144338 | -0.4803 | 0.633677 | 0.316839 |
| M1 | 2.15292212174366 | 1.978955 | 1.0879 | 0.283313 | 0.141657 |
| M2 | 1.04935628306701 | 1.951773 | 0.5376 | 0.593879 | 0.296939 |
| M3 | 1.59721168826427 | 1.959735 | 0.815 | 0.420014 | 0.210007 |
| M4 | -1.18333001580422 | 1.964064 | -0.6025 | 0.550335 | 0.275167 |
| M5 | -0.48610405600735 | 1.968148 | -0.247 | 0.806215 | 0.403108 |
| M6 | 2.64584732173502 | 1.931276 | 1.37 | 0.178523 | 0.089262 |
| M7 | 2.47449066262075 | 1.995588 | 1.24 | 0.222392 | 0.111196 |
| M8 | 1.4250603170624 | 2.102686 | 0.6777 | 0.501942 | 0.250971 |
| M9 | 0.806606050478028 | 2.077054 | 0.3883 | 0.699875 | 0.349938 |
| M10 | -1.59756470173195 | 2.050219 | -0.7792 | 0.440555 | 0.220278 |
| M11 | 0.569132549626265 | 2.044053 | 0.2784 | 0.782151 | 0.391075 |
| t | -0.0939253055905727 | 0.028977 | -3.2413 | 0.002438 | 0.001219 |
| Multiple Linear Regression - Regression Statistics | |
| Multiple R | 0.94131041838606 |
| R-squared | 0.886065303762138 |
| Adjusted R-squared | 0.8364014618123 |
| F-TEST (value) | 17.8412557098805 |
| F-TEST (DF numerator) | 17 |
| F-TEST (DF denominator) | 39 |
| p-value | 2.44582132324922e-13 |
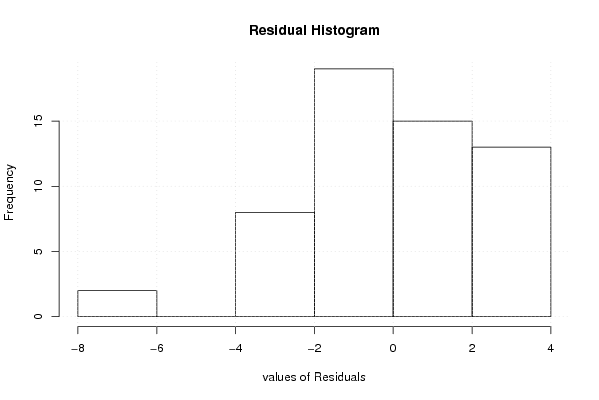
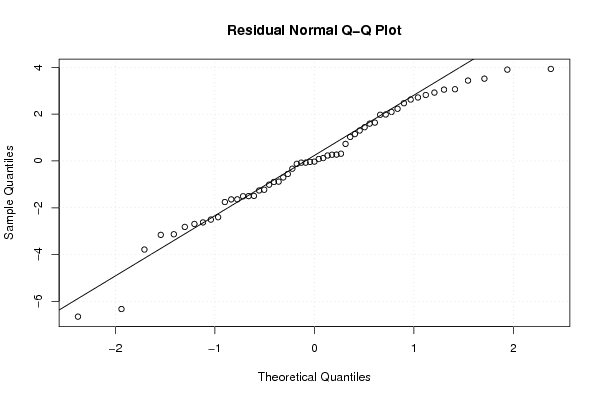
| Multiple Linear Regression - Residual Statistics | |
| Residual Standard Deviation | 2.83762272655424 |
| Sum Squared Residuals | 314.032006792028 |
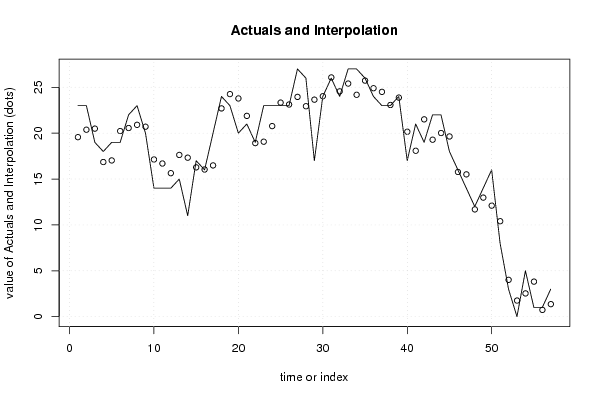
| Multiple Linear Regression - Actuals, Interpolation, and Residuals | |||
| Time or Index | Actuals | Interpolation Forecast | Residuals Prediction Error |
| 1 | 23 | 19.5660603833341 | 3.43393961666588 |
| 2 | 23 | 20.3765968497954 | 2.62340315020458 |
| 3 | 19 | 20.4941839654657 | -1.49418396546573 |
| 4 | 18 | 16.8518244749454 | 1.14817552505456 |
| 5 | 19 | 17.0278034775393 | 1.97219652246071 |
| 6 | 19 | 20.2313720822939 | -1.23137208229387 |
| 7 | 22 | 20.5588683798032 | 1.44113162019679 |
| 8 | 23 | 20.907822799898 | 2.09217720010201 |
| 9 | 20 | 20.7045367753906 | -0.704536775390588 |
| 10 | 14 | 17.1315989385587 | -3.13159893855866 |
| 11 | 14 | 16.6912247883186 | -2.69122478831864 |
| 12 | 14 | 15.6386449106067 | -1.63864491060667 |
| 13 | 15 | 17.6263929690103 | -2.62639296901030 |
| 14 | 11 | 17.3269579440589 | -6.32695794405887 |
| 15 | 17 | 16.2723218749422 | 0.727678125057794 |
| 16 | 16 | 16.0395965047024 | -0.0395965047024457 |
| 17 | 20 | 16.4854190210869 | 3.5145809789131 |
| 18 | 24 | 22.7000767578440 | 1.29992324215603 |
| 19 | 23 | 24.2606707493043 | -1.26067074930427 |
| 20 | 20 | 23.7846865186020 | -3.78468651860205 |
| 21 | 21 | 21.8847275463379 | -0.884727546337865 |
| 22 | 19 | 18.9173677435141 | 0.0826322564858539 |
| 23 | 23 | 19.0698707828108 | 3.93012921718923 |
| 24 | 23 | 20.7716378062653 | 2.22836219373470 |
| 25 | 23 | 23.3312295249624 | -0.331229524962437 |
| 26 | 23 | 23.1234943534262 | -0.123494353426229 |
| 27 | 27 | 23.9531904769597 | 3.0468095230403 |
| 28 | 26 | 22.9365761674749 | 3.06342383252513 |
| 29 | 17 | 23.6515987726254 | -6.65159877262536 |
| 30 | 24 | 24.0291570570664 | -0.0291570570664328 |
| 31 | 26 | 26.0741122337550 | -0.0741122337550348 |
| 32 | 24 | 24.5572738049851 | -0.557273804985117 |
| 33 | 27 | 25.406552020142 | 1.59344797985799 |
| 34 | 27 | 24.1830739539735 | 2.81692604602647 |
| 35 | 26 | 25.7302639537145 | 0.269736046285519 |
| 36 | 24 | 24.8984032426914 | -0.898403242691367 |
| 37 | 23 | 24.5011290845854 | -1.50112908458539 |
| 38 | 23 | 23.0729753492876 | -0.0729753492876153 |
| 39 | 24 | 23.876895376229 | 0.123104623770986 |
| 40 | 17 | 20.1581120380163 | -3.15811203801632 |
| 41 | 21 | 18.0804539112452 | 2.91954608875479 |
| 42 | 19 | 21.5056942525665 | -2.50569425256649 |
| 43 | 22 | 19.2876635516067 | 2.71233644839328 |
| 44 | 22 | 20.0155635280283 | 1.98443647197166 |
| 45 | 18 | 19.6424179460995 | -1.64241794609946 |
| 46 | 16 | 15.7679593639537 | 0.232040636046336 |
| 47 | 14 | 15.5086404751561 | -1.50864047515611 |
| 48 | 12 | 11.6913140404367 | 0.308685959563333 |
| 49 | 14 | 12.9751880381077 | 1.02481196189226 |
| 50 | 16 | 12.0999755034319 | 3.90002449656813 |
| 51 | 8 | 10.4034083064033 | -2.40340830640335 |
| 52 | 3 | 4.01389081486092 | -1.01389081486092 |
| 53 | 0 | 1.75472481750323 | -1.75472481750323 |
| 54 | 5 | 2.53369985022924 | 2.46630014977076 |
| 55 | 1 | 3.81868508553076 | -2.81868508553076 |
| 56 | 1 | 0.734653348486506 | 0.265346651513494 |
| 57 | 3 | 1.36176571203008 | 1.63823428796992 |
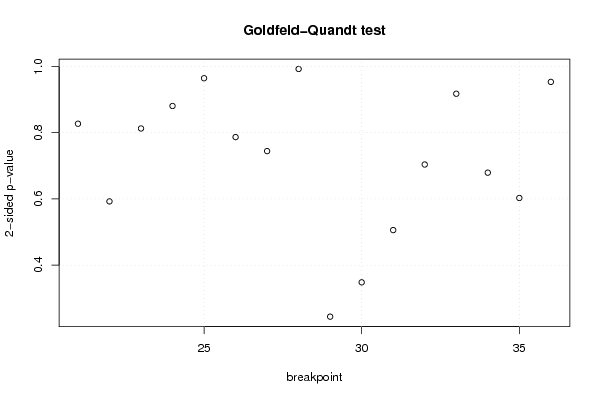
| Goldfeld-Quandt test for Heteroskedasticity | |||
| p-values | Alternative Hypothesis | ||
| breakpoint index | greater | 2-sided | less |
| 21 | 0.586479818640423 | 0.827040362719154 | 0.413520181359577 |
| 22 | 0.703731528375987 | 0.592536943248025 | 0.296268471624013 |
| 23 | 0.593612722588303 | 0.812774554823394 | 0.406387277411697 |
| 24 | 0.559645768604505 | 0.88070846279099 | 0.440354231395495 |
| 25 | 0.517766723361345 | 0.96446655327731 | 0.482233276638655 |
| 26 | 0.393347283208745 | 0.786694566417489 | 0.606652716791255 |
| 27 | 0.372219529502066 | 0.744439059004133 | 0.627780470497934 |
| 28 | 0.496264574356949 | 0.992529148713898 | 0.503735425643051 |
| 29 | 0.877805356451622 | 0.244389287096755 | 0.122194643548378 |
| 30 | 0.825960538041127 | 0.348078923917747 | 0.174039461958873 |
| 31 | 0.74708934423722 | 0.505821311525561 | 0.252910655762780 |
| 32 | 0.648054907354857 | 0.703890185290287 | 0.351945092645143 |
| 33 | 0.541170215455234 | 0.917659569089533 | 0.458829784544766 |
| 34 | 0.660372912826028 | 0.679254174347945 | 0.339627087173972 |
| 35 | 0.698573397286325 | 0.602853205427349 | 0.301426602713675 |
| 36 | 0.52329116059955 | 0.9534176788009 | 0.47670883940045 |
| Meta Analysis of Goldfeld-Quandt test for Heteroskedasticity | |||
| Description | # significant tests | % significant tests | OK/NOK |
| 1% type I error level | 0 | 0 | OK |
| 5% type I error level | 0 | 0 | OK |
| 10% type I error level | 0 | 0 | OK |