| Multiple Linear Regression - Estimated Regression Equation |
| intb[t] = + 0.210659035938168 -0.25603237044698X[t] + 1.39418813246313`Yt-1`[t] -0.279777174124115`Yt-2`[t] -0.344875777009029`Yt-3`[t] + 0.169566453810560`Yt-4`[t] + e[t] |
| Multiple Linear Regression - Ordinary Least Squares | |||||
| Variable | Parameter | S.D. | T-STAT H0: parameter = 0 | 2-tail p-value | 1-tail p-value |
| (Intercept) | 0.210659035938168 | 0.069803 | 3.0179 | 0.003966 | 0.001983 |
| X | -0.25603237044698 | 0.080161 | -3.194 | 0.002407 | 0.001203 |
| `Yt-1` | 1.39418813246313 | 0.150028 | 9.2929 | 0 | 0 |
| `Yt-2` | -0.279777174124115 | 0.244782 | -1.143 | 0.25839 | 0.129195 |
| `Yt-3` | -0.344875777009029 | 0.242766 | -1.4206 | 0.161516 | 0.080758 |
| `Yt-4` | 0.169566453810560 | 0.134184 | 1.2637 | 0.212087 | 0.106044 |
| Multiple Linear Regression - Regression Statistics | |
| Multiple R | 0.995246444713004 |
| R-squared | 0.990515485713875 |
| Adjusted R-squared | 0.989585631372098 |
| F-TEST (value) | 1065.23725406385 |
| F-TEST (DF numerator) | 5 |
| F-TEST (DF denominator) | 51 |
| p-value | 0 |
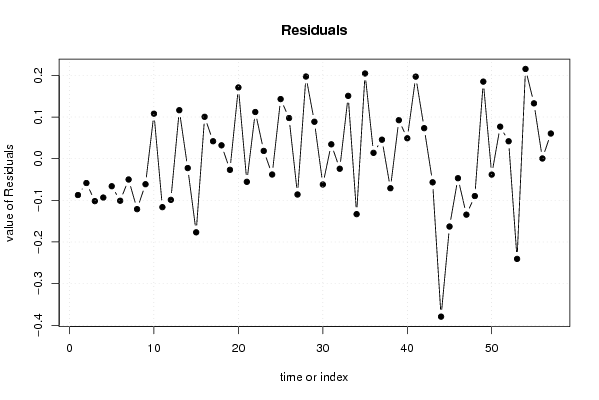
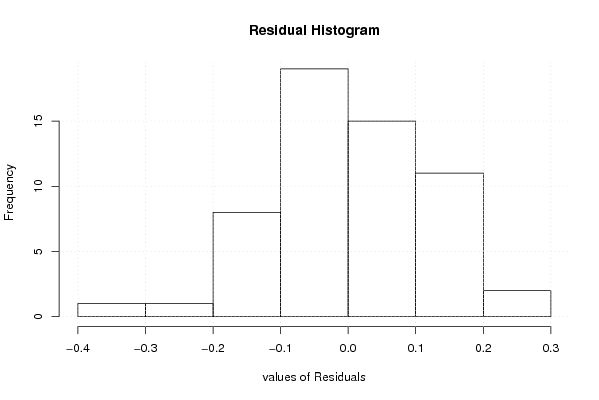
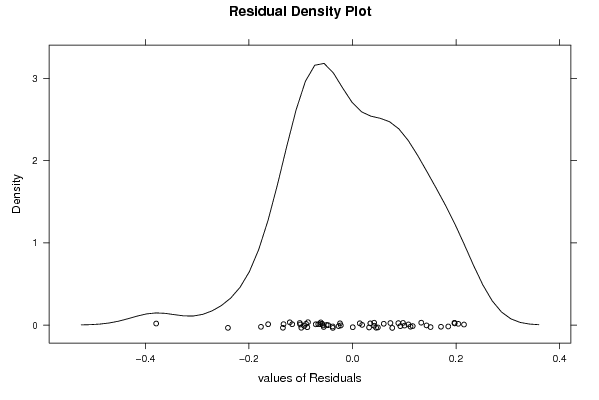
| Multiple Linear Regression - Residual Statistics | |
| Residual Standard Deviation | 0.126170925631754 |
| Sum Squared Residuals | 0.811874226213457 |
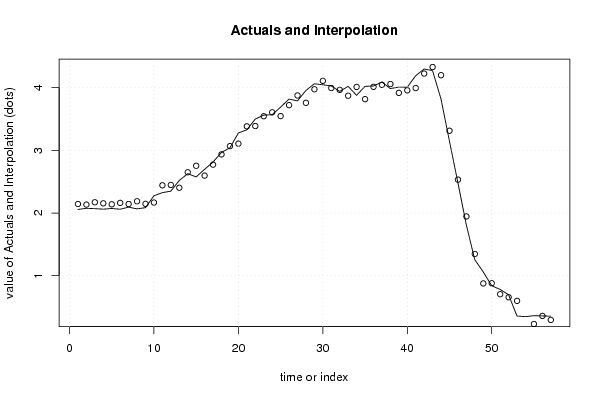
| Multiple Linear Regression - Actuals, Interpolation, and Residuals | |||
| Time or Index | Actuals | Interpolation Forecast | Residuals Prediction Error |
| 1 | 2.057 | 2.14431710788699 | -0.0873171078869878 |
| 2 | 2.076 | 2.13453554089273 | -0.0585355408927277 |
| 3 | 2.07 | 2.17192712723827 | -0.101927127238274 |
| 4 | 2.062 | 2.15536934528975 | -0.0933693452897483 |
| 5 | 2.073 | 2.13917229705781 | -0.0661722970578056 |
| 6 | 2.061 | 2.16203760119235 | -0.101037601192348 |
| 7 | 2.094 | 2.14397140218063 | -0.049971402180634 |
| 8 | 2.067 | 2.18818677146382 | -0.121186771463823 |
| 9 | 2.086 | 2.14731478545725 | -0.0613147854572474 |
| 10 | 2.276 | 2.16794264558837 | 0.108057354411627 |
| 11 | 2.326 | 2.442429963403 | -0.116429963403002 |
| 12 | 2.349 | 2.44785077292652 | -0.0988507729265203 |
| 13 | 2.52 | 2.40362360625765 | 0.116376393742348 |
| 14 | 2.628 | 2.65056873927755 | -0.0225687392775473 |
| 15 | 2.577 | 2.75384534062766 | -0.176845340627663 |
| 16 | 2.698 | 2.59745208163574 | 0.100547918364263 |
| 17 | 2.814 | 2.77216676122874 | 0.0418332387712635 |
| 18 | 2.968 | 2.93594138816444 | 0.0320586118355568 |
| 19 | 3.041 | 3.06781435020294 | -0.0268143502029370 |
| 20 | 3.278 | 3.10701634983566 | 0.170983650164338 |
| 21 | 3.328 | 3.383574042501 | -0.055574042500999 |
| 22 | 3.5 | 3.38791356102191 | 0.112086438978093 |
| 23 | 3.563 | 3.54436785307639 | 0.0186321469236089 |
| 24 | 3.569 | 3.60702349217487 | -0.0380234921748724 |
| 25 | 3.69 | 3.54692234804481 | 0.143077651955193 |
| 26 | 3.819 | 3.72137870513195 | 0.0976212948680517 |
| 27 | 3.79 | 3.87598936807869 | -0.0859893680786856 |
| 28 | 3.956 | 3.75875408648001 | 0.197245913519985 |
| 29 | 4.063 | 3.97433142019541 | 0.0886685798045928 |
| 30 | 4.047 | 4.10894200953918 | -0.0619420095391831 |
| 31 | 4.029 | 3.99453203564449 | 0.0344679643555126 |
| 32 | 3.941 | 3.96515940723872 | -0.0241594072387241 |
| 33 | 4.022 | 3.87116846370608 | 0.150831536293924 |
| 34 | 3.879 | 4.01221279448371 | -0.133212794483706 |
| 35 | 4.022 | 3.81747881264563 | 0.204521187354371 |
| 36 | 4.028 | 4.01399906561455 | 0.0140009343854544 |
| 37 | 4.091 | 4.04540817738052 | 0.0455918226194789 |
| 38 | 3.987 | 4.05799812767375 | -0.0709981276737537 |
| 39 | 4.01 | 3.91755534816062 | 0.092444651839375 |
| 40 | 4.007 | 3.95800872608748 | 0.0489912739125212 |
| 41 | 4.191 | 3.99394105408424 | 0.197058945915761 |
| 42 | 4.299 | 4.22574394791232 | 0.0732560520876786 |
| 43 | 4.273 | 4.32977192194817 | -0.0567719219481741 |
| 44 | 3.82 | 4.19934125336763 | -0.379341253367634 |
| 45 | 3.15 | 3.31296950902625 | -0.162969509026250 |
| 46 | 2.486 | 2.53288246736795 | -0.0468824673679502 |
| 47 | 1.812 | 1.94641225326160 | -0.134412253261603 |
| 48 | 1.257 | 1.34675466261973 | -0.0897546626197302 |
| 49 | 1.062 | 0.876938056343265 | 0.185061943656735 |
| 50 | 0.842 | 0.880201850525712 | -0.0382018505257123 |
| 51 | 0.782 | 0.70515527670972 | 0.0768447232902804 |
| 52 | 0.698 | 0.656196361721137 | 0.041803638278863 |
| 53 | 0.358 | 0.598678401490608 | -0.240678401490608 |
| 54 | 0.347 | 0.131543645861787 | 0.215456354138213 |
| 55 | 0.363 | 0.230127393647017 | 0.132872606352983 |
| 56 | 0.359 | 0.358526134744775 | 0.000473865255225039 |
| 57 | 0.355 | 0.294613986680445 | 0.0603860133195546 |
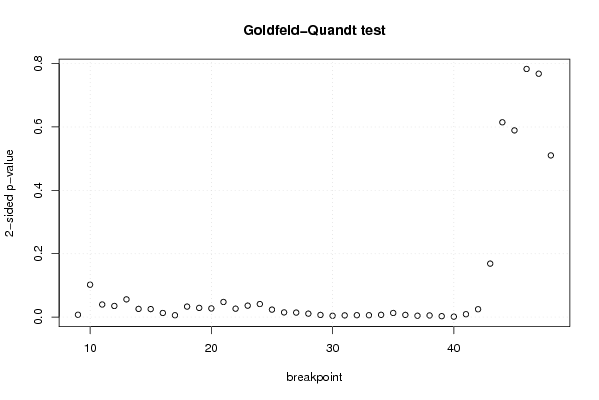
| Goldfeld-Quandt test for Heteroskedasticity | |||
| p-values | Alternative Hypothesis | ||
| breakpoint index | greater | 2-sided | less |
| 9 | 0.00366016674867997 | 0.00732033349735993 | 0.99633983325132 |
| 10 | 0.0510923140925298 | 0.102184628185060 | 0.94890768590747 |
| 11 | 0.0198462823884211 | 0.0396925647768421 | 0.980153717611579 |
| 12 | 0.0175675602788059 | 0.0351351205576118 | 0.982432439721194 |
| 13 | 0.0279969910171315 | 0.0559939820342631 | 0.972003008982868 |
| 14 | 0.0129068312229832 | 0.0258136624459664 | 0.987093168777017 |
| 15 | 0.0126125215001469 | 0.0252250430002939 | 0.987387478499853 |
| 16 | 0.00650987375425439 | 0.0130197475085088 | 0.993490126245746 |
| 17 | 0.00291846839116363 | 0.00583693678232726 | 0.997081531608836 |
| 18 | 0.0165622873597578 | 0.0331245747195156 | 0.983437712640242 |
| 19 | 0.0144926298144739 | 0.0289852596289478 | 0.985507370185526 |
| 20 | 0.0136885094468115 | 0.0273770188936230 | 0.986311490553188 |
| 21 | 0.0238407911262578 | 0.0476815822525156 | 0.976159208873742 |
| 22 | 0.0132665591540514 | 0.0265331183081028 | 0.986733440845949 |
| 23 | 0.0180411556931174 | 0.0360823113862348 | 0.981958844306883 |
| 24 | 0.0205701601131259 | 0.0411403202262519 | 0.979429839886874 |
| 25 | 0.0117667718274274 | 0.0235335436548548 | 0.988233228172573 |
| 26 | 0.00741577782012623 | 0.0148315556402525 | 0.992584222179874 |
| 27 | 0.00709729408764504 | 0.0141945881752901 | 0.992902705912355 |
| 28 | 0.0054273677164535 | 0.010854735432907 | 0.994572632283546 |
| 29 | 0.00339484425447425 | 0.0067896885089485 | 0.996605155745526 |
| 30 | 0.00210612792907717 | 0.00421225585815433 | 0.997893872070923 |
| 31 | 0.00269263984923867 | 0.00538527969847733 | 0.997307360150761 |
| 32 | 0.00297526266567714 | 0.00595052533135429 | 0.997024737334323 |
| 33 | 0.00291742985049857 | 0.00583485970099714 | 0.997082570149501 |
| 34 | 0.00357278721355358 | 0.00714557442710717 | 0.996427212786446 |
| 35 | 0.0064827257794275 | 0.012965451558855 | 0.993517274220572 |
| 36 | 0.00345721638470501 | 0.00691443276941003 | 0.996542783615295 |
| 37 | 0.00213826578085027 | 0.00427653156170054 | 0.99786173421915 |
| 38 | 0.00260215046107167 | 0.00520430092214334 | 0.997397849538928 |
| 39 | 0.00145575507167300 | 0.00291151014334600 | 0.998544244928327 |
| 40 | 0.000693364567499667 | 0.00138672913499933 | 0.9993066354325 |
| 41 | 0.00454864556076925 | 0.0090972911215385 | 0.99545135443923 |
| 42 | 0.0123871497835120 | 0.0247742995670240 | 0.987612850216488 |
| 43 | 0.0843416646619357 | 0.168683329323871 | 0.915658335338064 |
| 44 | 0.307355613954084 | 0.614711227908168 | 0.692644386045916 |
| 45 | 0.29464130399277 | 0.58928260798554 | 0.70535869600723 |
| 46 | 0.391546989468856 | 0.783093978937712 | 0.608453010531144 |
| 47 | 0.384012123163679 | 0.768024246327358 | 0.615987876836321 |
| 48 | 0.255133798431794 | 0.510267596863587 | 0.744866201568206 |
| Meta Analysis of Goldfeld-Quandt test for Heteroskedasticity | |||
| Description | # significant tests | % significant tests | OK/NOK |
| 1% type I error level | 14 | 0.35 | NOK |
| 5% type I error level | 32 | 0.8 | NOK |
| 10% type I error level | 33 | 0.825 | NOK |