| Multiple Linear Regression - Estimated Regression Equation |
| WLH[t] = + 28.0537721653424 + 4.5783344490655X[t] + 0.89389373351237`Y(t-1)`[t] + 0.269258267201097`Y(t-2)`[t] -0.239285433868153`Y(t-3)`[t] -0.102477680079240`Y(t-4)`[t] -4.41387550198146M1[t] -7.48459972952515M2[t] -5.74169225100387M3[t] -9.06607666309207M4[t] -2.46464716599568M5[t] + 28.2278520152218M6[t] + 4.32563125183533M7[t] -12.8925239435589M8[t] -15.4919697862306M9[t] -9.03535197334436M10[t] -1.16080135981364M11[t] -0.182589577259004t + e[t] |
| Multiple Linear Regression - Ordinary Least Squares | |||||
| Variable | Parameter | S.D. | T-STAT H0: parameter = 0 | 2-tail p-value | 1-tail p-value |
| (Intercept) | 28.0537721653424 | 8.902464 | 3.1512 | 0.003166 | 0.001583 |
| X | 4.5783344490655 | 1.277807 | 3.583 | 0.000952 | 0.000476 |
| `Y(t-1)` | 0.89389373351237 | 0.149715 | 5.9706 | 1e-06 | 0 |
| `Y(t-2)` | 0.269258267201097 | 0.202592 | 1.3291 | 0.191751 | 0.095876 |
| `Y(t-3)` | -0.239285433868153 | 0.206193 | -1.1605 | 0.253087 | 0.126543 |
| `Y(t-4)` | -0.102477680079240 | 0.15661 | -0.6544 | 0.516827 | 0.258413 |
| M1 | -4.41387550198146 | 1.710078 | -2.5811 | 0.013833 | 0.006917 |
| M2 | -7.48459972952515 | 2.199846 | -3.4023 | 0.001586 | 0.000793 |
| M3 | -5.74169225100387 | 2.412995 | -2.3795 | 0.022461 | 0.011231 |
| M4 | -9.06607666309207 | 2.203365 | -4.1147 | 0.000201 | 1e-04 |
| M5 | -2.46464716599568 | 2.424432 | -1.0166 | 0.315779 | 0.157889 |
| M6 | 28.2278520152218 | 2.263018 | 12.4735 | 0 | 0 |
| M7 | 4.32563125183533 | 4.875251 | 0.8873 | 0.380519 | 0.190259 |
| M8 | -12.8925239435589 | 5.422589 | -2.3776 | 0.022564 | 0.011282 |
| M9 | -15.4919697862306 | 6.683822 | -2.3178 | 0.02594 | 0.01297 |
| M10 | -9.03535197334436 | 3.373712 | -2.6782 | 0.010875 | 0.005437 |
| M11 | -1.16080135981364 | 2.258899 | -0.5139 | 0.610312 | 0.305156 |
| t | -0.182589577259004 | 0.053886 | -3.3884 | 0.001649 | 0.000825 |
| Multiple Linear Regression - Regression Statistics | |
| Multiple R | 0.99431080101004 |
| R-squared | 0.988653969005226 |
| Adjusted R-squared | 0.98357811303388 |
| F-TEST (value) | 194.775812116472 |
| F-TEST (DF numerator) | 17 |
| F-TEST (DF denominator) | 38 |
| p-value | 0 |
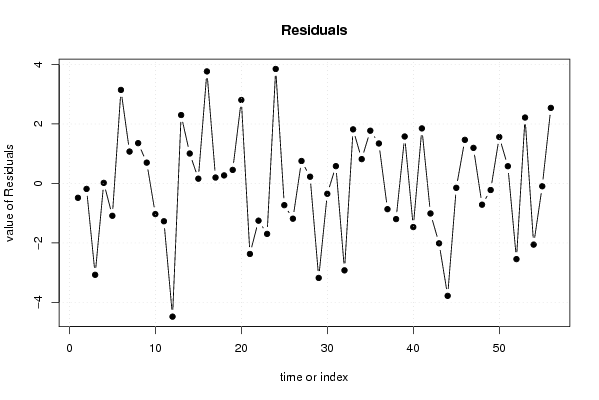
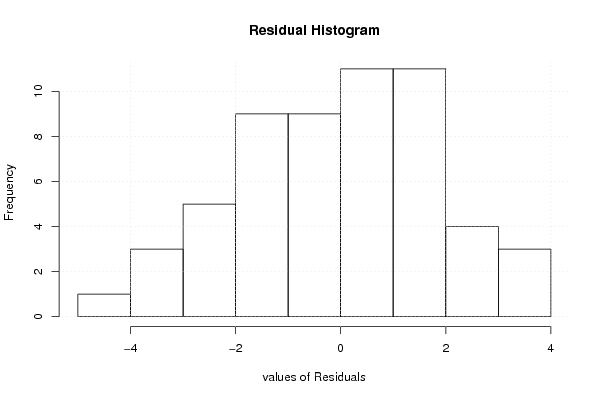
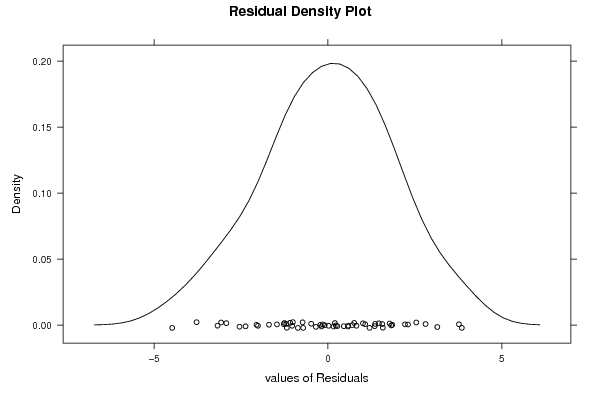
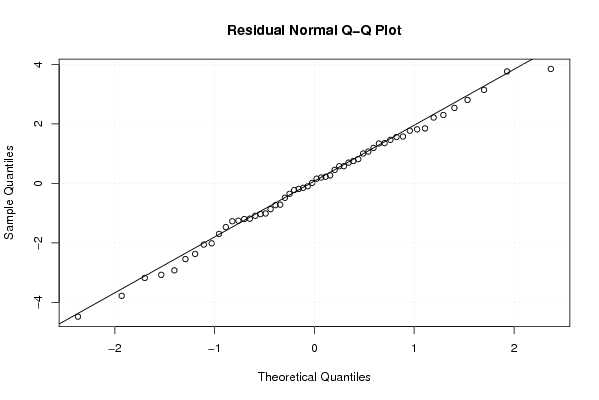
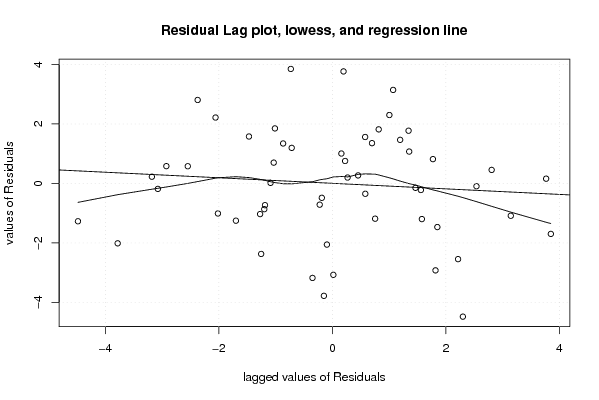
| Multiple Linear Regression - Residual Statistics | |
| Residual Standard Deviation | 2.23576648500679 |
| Sum Squared Residuals | 189.948767468226 |
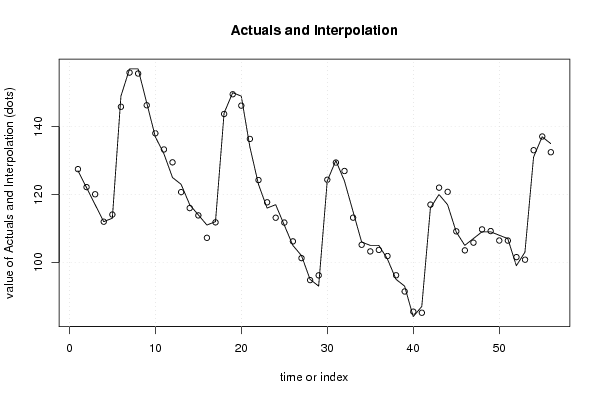
| Multiple Linear Regression - Actuals, Interpolation, and Residuals | |||
| Time or Index | Actuals | Interpolation Forecast | Residuals Prediction Error |
| 1 | 127 | 127.483508875378 | -0.483508875378087 |
| 2 | 122 | 122.184141070298 | -0.184141070297849 |
| 3 | 117 | 120.073553392053 | -3.07355339205266 |
| 4 | 112 | 111.981064101139 | 0.0189358988611628 |
| 5 | 113 | 114.088004226987 | -1.08800422698736 |
| 6 | 149 | 145.854331798190 | 3.14566820181027 |
| 7 | 157 | 155.927769700928 | 1.07223029907242 |
| 8 | 157 | 155.644575382141 | 1.35542461785918 |
| 9 | 147 | 146.299852800486 | 0.70014719951383 |
| 10 | 137 | 138.031463747192 | -1.03146374719181 |
| 11 | 132 | 133.272083335695 | -1.27208333569496 |
| 12 | 125 | 129.481098117358 | -4.4810981173583 |
| 13 | 123 | 120.698716707000 | 2.30128329300029 |
| 14 | 117 | 115.994011534898 | 1.00598846510224 |
| 15 | 114 | 113.839836938157 | 0.160163061843093 |
| 16 | 111 | 107.231546773357 | 3.768453226643 |
| 17 | 112 | 111.801598654421 | 0.198401345578616 |
| 18 | 144 | 143.730349572369 | 0.269650427631110 |
| 19 | 150 | 149.544686313162 | 0.455313686837538 |
| 20 | 149 | 146.191716098388 | 2.80828390161191 |
| 21 | 134 | 136.371724984291 | -2.37172498429149 |
| 22 | 123 | 124.253090584287 | -1.25309058428748 |
| 23 | 116 | 117.697765897299 | -1.69776589729938 |
| 24 | 117 | 113.148639794157 | 3.85136020584309 |
| 25 | 111 | 111.730565551759 | -0.730565551759419 |
| 26 | 105 | 106.185400131032 | -1.18540013103232 |
| 27 | 102 | 101.244864354700 | 0.755135645299677 |
| 28 | 95 | 94.7738944847391 | 0.226105515260888 |
| 29 | 93 | 96.178282152071 | -3.17828215207097 |
| 30 | 124 | 124.348318800677 | -0.348318800676983 |
| 31 | 130 | 129.418128741828 | 0.581871258172482 |
| 32 | 124 | 126.923667281773 | -2.92366728177347 |
| 33 | 115 | 113.180925974221 | 1.81907402577911 |
| 34 | 106 | 105.181840319365 | 0.818159680635145 |
| 35 | 105 | 103.226279871949 | 1.77372012805115 |
| 36 | 105 | 103.65570850147 | 1.34429149852994 |
| 37 | 101 | 101.865853180555 | -0.865853180555036 |
| 38 | 95 | 96.1985489962842 | -1.19854899628418 |
| 39 | 93 | 91.420949107747 | 1.57905089225291 |
| 40 | 84 | 85.4677797836412 | -1.46777978364118 |
| 41 | 87 | 85.148682890991 | 1.85131710900907 |
| 42 | 116 | 117.010386238888 | -1.01038623888843 |
| 43 | 120 | 122.014793236677 | -2.01479323667678 |
| 44 | 117 | 120.780890415079 | -3.780890415079 |
| 45 | 109 | 109.147496241001 | -0.147496241001446 |
| 46 | 105 | 103.533605349156 | 1.46639465084415 |
| 47 | 107 | 105.803870895057 | 1.19612910494319 |
| 48 | 109 | 109.714553587015 | -0.714553587014742 |
| 49 | 109 | 109.221355685308 | -0.221355685307748 |
| 50 | 108 | 106.437898267488 | 1.5621017325121 |
| 51 | 107 | 106.420796207343 | 0.579203792656976 |
| 52 | 99 | 101.545714857124 | -2.54571485712387 |
| 53 | 103 | 100.783432075529 | 2.21656792447064 |
| 54 | 131 | 133.056613589876 | -2.05661358987597 |
| 55 | 137 | 137.094622007406 | -0.0946220074056544 |
| 56 | 135 | 132.459150822619 | 2.54084917738138 |
| Goldfeld-Quandt test for Heteroskedasticity | |||
| p-values | Alternative Hypothesis | ||
| breakpoint index | greater | 2-sided | less |
| 21 | 0.858978567074072 | 0.282042865851856 | 0.141021432925928 |
| 22 | 0.748910600734388 | 0.502178798531224 | 0.251089399265612 |
| 23 | 0.795026493359863 | 0.409947013280273 | 0.204973506640137 |
| 24 | 0.905465966812411 | 0.189068066375178 | 0.094534033187589 |
| 25 | 0.90324433443906 | 0.193511331121879 | 0.0967556655609394 |
| 26 | 0.872399980906038 | 0.255200038187924 | 0.127600019093962 |
| 27 | 0.834075310273311 | 0.331849379453378 | 0.165924689726689 |
| 28 | 0.855784004972193 | 0.288431990055613 | 0.144215995027807 |
| 29 | 0.910307441243277 | 0.179385117513447 | 0.0896925587567233 |
| 30 | 0.946557047745036 | 0.106885904509928 | 0.0534429522549638 |
| 31 | 0.954534962440294 | 0.0909300751194115 | 0.0454650375597057 |
| 32 | 0.94161311948581 | 0.116773761028379 | 0.0583868805141893 |
| 33 | 0.948020736681656 | 0.103958526636688 | 0.0519792633183439 |
| 34 | 0.896484029189595 | 0.20703194162081 | 0.103515970810405 |
| 35 | 0.854737349677325 | 0.290525300645350 | 0.145262650322675 |
| Meta Analysis of Goldfeld-Quandt test for Heteroskedasticity | |||
| Description | # significant tests | % significant tests | OK/NOK |
| 1% type I error level | 0 | 0 | OK |
| 5% type I error level | 0 | 0 | OK |
| 10% type I error level | 1 | 0.0666666666666667 | OK |