| Multiple Linear Regression - Estimated Regression Equation |
| Y[t] = + 5051.60408163265 -785.340136054422X[t] -130.434013605440M1[t] -581.068027210885M2[t] + 380.331972789115M3[t] -309.668027210883M4[t] -187.868027210884M5[t] + 615.199999999999M6[t] -420.4M7[t] -232.2M8[t] -157.400000000000M9[t] + 210.4M10[t] -555.8M11[t] + e[t] |
| Multiple Linear Regression - Ordinary Least Squares | |||||
| Variable | Parameter | S.D. | T-STAT H0: parameter = 0 | 2-tail p-value | 1-tail p-value |
| (Intercept) | 5051.60408163265 | 243.685798 | 20.73 | 0 | 0 |
| X | -785.340136054422 | 134.144617 | -5.8544 | 0 | 0 |
| M1 | -130.434013605440 | 311.72392 | -0.4184 | 0.6775 | 0.33875 |
| M2 | -581.068027210885 | 326.387939 | -1.7803 | 0.081357 | 0.040679 |
| M3 | 380.331972789115 | 326.387939 | 1.1653 | 0.249666 | 0.124833 |
| M4 | -309.668027210883 | 326.387939 | -0.9488 | 0.347489 | 0.173744 |
| M5 | -187.868027210884 | 326.387939 | -0.5756 | 0.567576 | 0.283788 |
| M6 | 615.199999999999 | 325.283408 | 1.8913 | 0.064631 | 0.032315 |
| M7 | -420.4 | 325.283408 | -1.2924 | 0.202402 | 0.101201 |
| M8 | -232.2 | 325.283408 | -0.7138 | 0.478784 | 0.239392 |
| M9 | -157.400000000000 | 325.283408 | -0.4839 | 0.630667 | 0.315334 |
| M10 | 210.4 | 325.283408 | 0.6468 | 0.520829 | 0.260415 |
| M11 | -555.8 | 325.283408 | -1.7087 | 0.093973 | 0.046986 |
| Multiple Linear Regression - Regression Statistics | |
| Multiple R | 0.749715982507451 |
| R-squared | 0.562074054427113 |
| Adjusted R-squared | 0.452592568033891 |
| F-TEST (value) | 5.1339644075376 |
| F-TEST (DF numerator) | 12 |
| F-TEST (DF denominator) | 48 |
| p-value | 1.93964197101604e-05 |
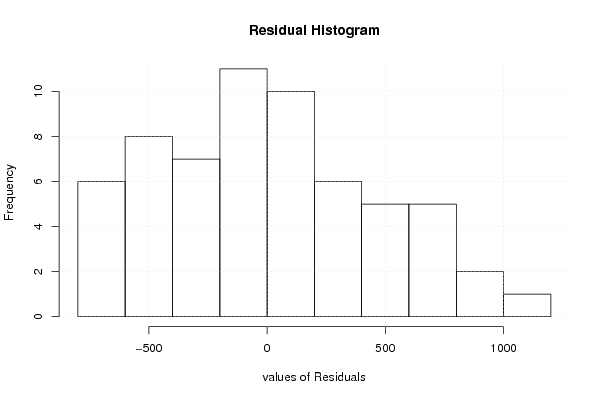
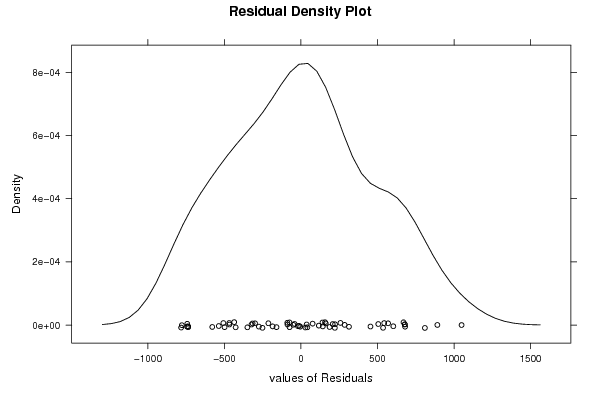
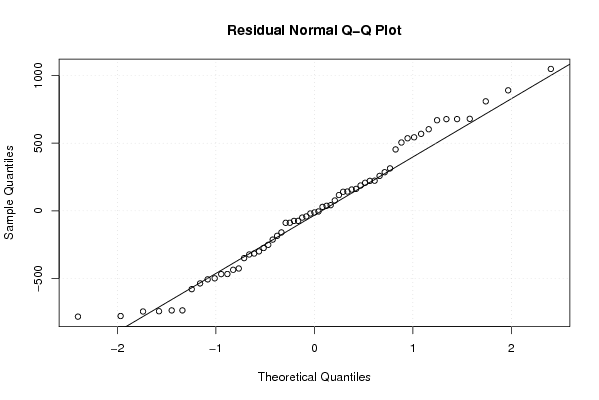
| Multiple Linear Regression - Residual Statistics | |
| Residual Standard Deviation | 514.318227918436 |
| Sum Squared Residuals | 12697115.4993197 |
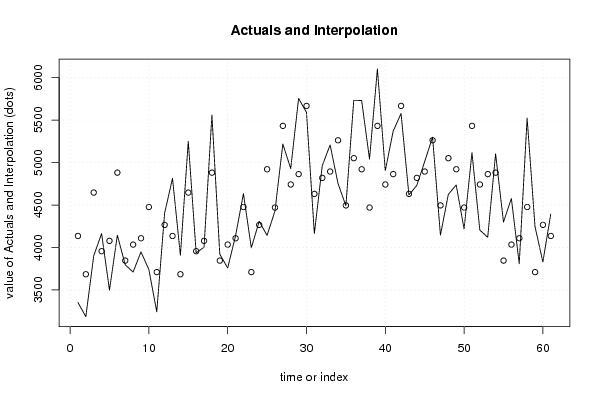
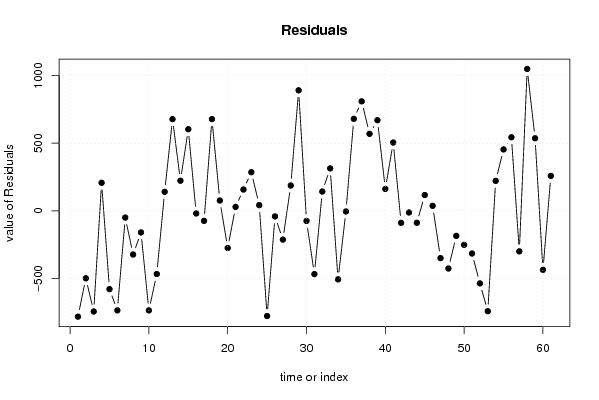
| Multiple Linear Regression - Actuals, Interpolation, and Residuals | |||
| Time or Index | Actuals | Interpolation Forecast | Residuals Prediction Error |
| 1 | 3353 | 4135.82993197278 | -782.82993197278 |
| 2 | 3186 | 3685.19591836735 | -499.195918367347 |
| 3 | 3902 | 4646.59591836735 | -744.595918367348 |
| 4 | 4164 | 3956.59591836735 | 207.404081632653 |
| 5 | 3499 | 4078.39591836735 | -579.395918367346 |
| 6 | 4145 | 4881.46394557823 | -736.463945578232 |
| 7 | 3796 | 3845.86394557823 | -49.8639455782308 |
| 8 | 3711 | 4034.06394557823 | -323.063945578231 |
| 9 | 3949 | 4108.86394557823 | -159.863945578231 |
| 10 | 3740 | 4476.66394557823 | -736.663945578231 |
| 11 | 3243 | 3710.46394557823 | -467.463945578232 |
| 12 | 4407 | 4266.26394557823 | 140.736054421769 |
| 13 | 4814 | 4135.82993197279 | 678.170068027209 |
| 14 | 3908 | 3685.19591836735 | 222.804081632653 |
| 15 | 5250 | 4646.59591836735 | 603.404081632653 |
| 16 | 3937 | 3956.59591836735 | -19.5959183673476 |
| 17 | 4004 | 4078.39591836735 | -74.3959183673475 |
| 18 | 5560 | 4881.46394557823 | 678.536054421769 |
| 19 | 3922 | 3845.86394557823 | 76.1360544217683 |
| 20 | 3759 | 4034.06394557823 | -275.063945578232 |
| 21 | 4138 | 4108.86394557823 | 29.1360544217685 |
| 22 | 4634 | 4476.66394557823 | 157.336054421768 |
| 23 | 3996 | 3710.46394557823 | 285.536054421769 |
| 24 | 4308 | 4266.26394557823 | 41.7360544217684 |
| 25 | 4143 | 4921.17006802721 | -778.170068027212 |
| 26 | 4429 | 4470.53605442177 | -41.5360544217689 |
| 27 | 5219 | 5431.93605442177 | -212.936054421769 |
| 28 | 4929 | 4741.93605442177 | 187.063945578231 |
| 29 | 5755 | 4863.73605442177 | 891.263945578231 |
| 30 | 5592 | 5666.80408163265 | -74.8040816326526 |
| 31 | 4163 | 4631.20408163265 | -468.204081632653 |
| 32 | 4962 | 4819.40408163265 | 142.595918367347 |
| 33 | 5208 | 4894.20408163265 | 313.795918367347 |
| 34 | 4755 | 5262.00408163265 | -507.004081632653 |
| 35 | 4491 | 4495.80408163265 | -4.80408163265294 |
| 36 | 5732 | 5051.60408163265 | 680.395918367347 |
| 37 | 5731 | 4921.17006802721 | 809.829931972788 |
| 38 | 5040 | 4470.53605442177 | 569.463945578231 |
| 39 | 6102 | 5431.93605442177 | 670.063945578231 |
| 40 | 4904 | 4741.93605442177 | 162.063945578231 |
| 41 | 5369 | 4863.73605442177 | 505.263945578231 |
| 42 | 5578 | 5666.80408163265 | -88.8040816326526 |
| 43 | 4619 | 4631.20408163265 | -12.2040816326532 |
| 44 | 4731 | 4819.40408163265 | -88.404081632653 |
| 45 | 5011 | 4894.20408163265 | 116.795918367347 |
| 46 | 5299 | 5262.00408163265 | 36.9959183673471 |
| 47 | 4146 | 4495.80408163265 | -349.804081632653 |
| 48 | 4625 | 5051.60408163265 | -426.604081632653 |
| 49 | 4736 | 4921.17006802721 | -185.170068027213 |
| 50 | 4219 | 4470.53605442177 | -251.536054421769 |
| 51 | 5116 | 5431.93605442177 | -315.936054421769 |
| 52 | 4205 | 4741.93605442177 | -536.936054421769 |
| 53 | 4121 | 4863.73605442177 | -742.73605442177 |
| 54 | 5103 | 4881.46394557823 | 221.536054421769 |
| 55 | 4300 | 3845.86394557823 | 454.136054421768 |
| 56 | 4578 | 4034.06394557823 | 543.936054421769 |
| 57 | 3809 | 4108.86394557823 | -299.863945578231 |
| 58 | 5526 | 4476.66394557823 | 1049.33605442177 |
| 59 | 4247 | 3710.46394557823 | 536.536054421769 |
| 60 | 3830 | 4266.26394557823 | -436.263945578231 |
| 61 | 4394 | 4135.82993197279 | 258.170068027209 |
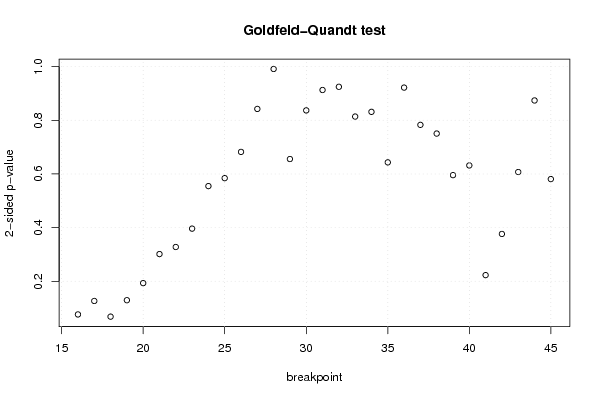
| Goldfeld-Quandt test for Heteroskedasticity | |||
| p-values | Alternative Hypothesis | ||
| breakpoint index | greater | 2-sided | less |
| 16 | 0.961850591808232 | 0.0762988163835368 | 0.0381494081917684 |
| 17 | 0.9367134211605 | 0.126573157678999 | 0.0632865788394996 |
| 18 | 0.96596612213837 | 0.0680677557232602 | 0.0340338778616301 |
| 19 | 0.935324904119 | 0.129350191762 | 0.064675095881 |
| 20 | 0.903484191656526 | 0.193031616686947 | 0.0965158083434737 |
| 21 | 0.849313679554635 | 0.301372640890730 | 0.150686320445365 |
| 22 | 0.836166917088347 | 0.327666165823306 | 0.163833082911653 |
| 23 | 0.801925311410642 | 0.396149377178716 | 0.198074688589358 |
| 24 | 0.722675186903864 | 0.554649626192272 | 0.277324813096136 |
| 25 | 0.70785900541675 | 0.584281989166502 | 0.292140994583251 |
| 26 | 0.658954644121423 | 0.682090711757154 | 0.341045355878577 |
| 27 | 0.578833042515344 | 0.842333914969311 | 0.421166957484656 |
| 28 | 0.504341770075477 | 0.991316459849045 | 0.495658229924523 |
| 29 | 0.672199020651598 | 0.655601958696804 | 0.327800979348402 |
| 30 | 0.58158609193225 | 0.836827816135501 | 0.418413908067750 |
| 31 | 0.543566989127349 | 0.912866021745303 | 0.456433010872651 |
| 32 | 0.462388452269735 | 0.924776904539469 | 0.537611547730265 |
| 33 | 0.406901493255821 | 0.813802986511642 | 0.593098506744179 |
| 34 | 0.415719549571325 | 0.83143909914265 | 0.584280450428675 |
| 35 | 0.321602085420696 | 0.643204170841392 | 0.678397914579304 |
| 36 | 0.46089066273325 | 0.9217813254665 | 0.53910933726675 |
| 37 | 0.608540808498613 | 0.782918383002773 | 0.391459191501387 |
| 38 | 0.624752665877781 | 0.750494668244437 | 0.375247334122219 |
| 39 | 0.702229520213994 | 0.595540959572011 | 0.297770479786006 |
| 40 | 0.68414882939501 | 0.631702341209981 | 0.315851170604991 |
| 41 | 0.888564076574528 | 0.222871846850944 | 0.111435923425472 |
| 42 | 0.81184976203163 | 0.37630047593674 | 0.18815023796837 |
| 43 | 0.696443289347153 | 0.607113421305694 | 0.303556710652847 |
| 44 | 0.563047290967419 | 0.873905418065162 | 0.436952709032581 |
| 45 | 0.709567711052726 | 0.580864577894548 | 0.290432288947274 |
| Meta Analysis of Goldfeld-Quandt test for Heteroskedasticity | |||
| Description | # significant tests | % significant tests | OK/NOK |
| 1% type I error level | 0 | 0 | OK |
| 5% type I error level | 0 | 0 | OK |
| 10% type I error level | 2 | 0.0666666666666667 | OK |