| Multiple Linear Regression - Estimated Regression Equation |
| Consvertr[t] = + 0.74343004601014 + 0.00334799485690966Aand[t] + 0.512904370369499Y1[t] -1.99293616351209M1[t] + 1.09126781260913M2[t] -0.893483298458545M3[t] + 0.858889235258036M4[t] -0.0371475938890308M5[t] + 0.292557415183294M6[t] -2.3050400438417M7[t] -1.36406165673480M8[t] + 1.74372986889002M9[t] + 0.955268414103237M10[t] + 0.0881616057021931M11[t] -0.104961670239249t + e[t] |
| Multiple Linear Regression - Ordinary Least Squares | |||||
| Variable | Parameter | S.D. | T-STAT H0: parameter = 0 | 2-tail p-value | 1-tail p-value |
| (Intercept) | 0.74343004601014 | 2.197679 | 0.3383 | 0.736726 | 0.368363 |
| Aand | 0.00334799485690966 | 0.000835 | 4.0097 | 0.000226 | 0.000113 |
| Y1 | 0.512904370369499 | 0.115951 | 4.4234 | 6.1e-05 | 3e-05 |
| M1 | -1.99293616351209 | 1.829644 | -1.0892 | 0.281844 | 0.140922 |
| M2 | 1.09126781260913 | 1.822776 | 0.5987 | 0.552385 | 0.276193 |
| M3 | -0.893483298458545 | 1.827577 | -0.4889 | 0.627294 | 0.313647 |
| M4 | 0.858889235258036 | 1.817565 | 0.4725 | 0.638819 | 0.319409 |
| M5 | -0.0371475938890308 | 1.816997 | -0.0204 | 0.983779 | 0.49189 |
| M6 | 0.292557415183294 | 1.816653 | 0.161 | 0.872781 | 0.436391 |
| M7 | -2.3050400438417 | 1.818369 | -1.2676 | 0.211446 | 0.105723 |
| M8 | -1.36406165673480 | 1.824681 | -0.7476 | 0.458613 | 0.229307 |
| M9 | 1.74372986889002 | 1.833477 | 0.9511 | 0.346659 | 0.173329 |
| M10 | 0.955268414103237 | 1.810148 | 0.5277 | 0.60028 | 0.30014 |
| M11 | 0.0881616057021931 | 1.816656 | 0.0485 | 0.961509 | 0.480754 |
| t | -0.104961670239249 | 0.028622 | -3.6671 | 0.000646 | 0.000323 |
| Multiple Linear Regression - Regression Statistics | |
| Multiple R | 0.932200781887413 |
| R-squared | 0.868998297751504 |
| Adjusted R-squared | 0.828242212607527 |
| F-TEST (value) | 21.3219276258170 |
| F-TEST (DF numerator) | 14 |
| F-TEST (DF denominator) | 45 |
| p-value | 2.66453525910038e-15 |
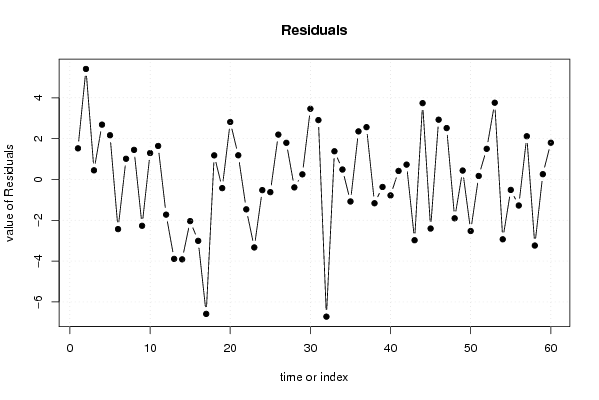
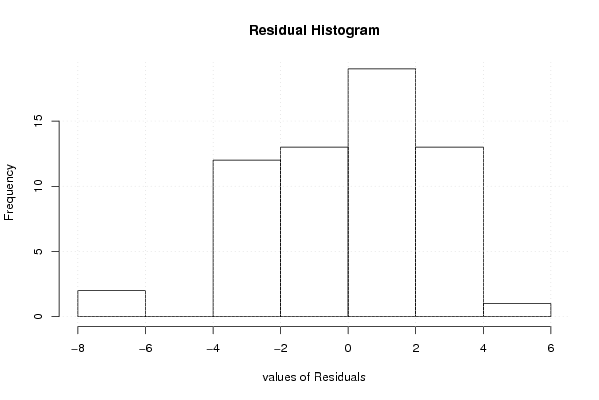
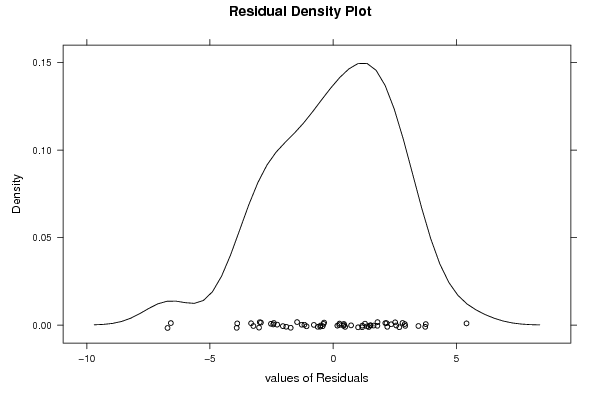
| Multiple Linear Regression - Residual Statistics | |
| Residual Standard Deviation | 2.85994923312552 |
| Sum Squared Residuals | 368.068932722487 |
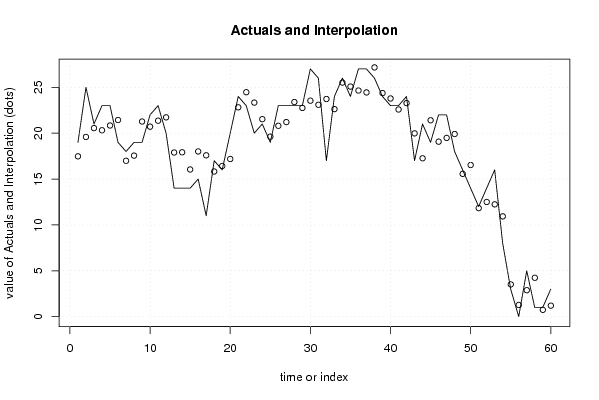
| Multiple Linear Regression - Actuals, Interpolation, and Residuals | |||
| Time or Index | Actuals | Interpolation Forecast | Residuals Prediction Error |
| 1 | 19 | 17.4771564075140 | 1.52284359248602 |
| 2 | 25 | 19.5880126908288 | 5.41198730917116 |
| 3 | 21 | 20.5537298055290 | 0.446270194470978 |
| 4 | 23 | 20.3162198514539 | 2.68378014854611 |
| 5 | 23 | 20.8358637326578 | 2.16413626734218 |
| 6 | 19 | 21.4326362599907 | -2.43263625999069 |
| 7 | 18 | 16.9881826534612 | 1.01181734653883 |
| 8 | 19 | 17.5529197887825 | 1.44708021121751 |
| 9 | 19 | 21.2709063838435 | -2.27090638384348 |
| 10 | 22 | 20.7080307910401 | 1.29196920895987 |
| 11 | 23 | 21.3605180116395 | 1.6394819883605 |
| 12 | 20 | 21.7241243587445 | -1.72412435874450 |
| 13 | 14 | 17.8931623124411 | -3.89316231244106 |
| 14 | 14 | 17.9156736106976 | -3.91567361069763 |
| 15 | 14 | 16.0415047382786 | -2.04150473827856 |
| 16 | 15 | 18.0085486707451 | -3.00854867074506 |
| 17 | 11 | 17.5869122396379 | -6.5869122396379 |
| 18 | 17 | 15.821339882823 | 1.17866011717701 |
| 19 | 16 | 16.4261137825997 | -0.426113782599727 |
| 20 | 20 | 17.1850680995704 | 2.81493190042962 |
| 21 | 24 | 22.8182498273994 | 1.18175017260064 |
| 22 | 23 | 24.4653518728058 | -1.46535187280583 |
| 23 | 20 | 23.3315836842859 | -3.33158368428587 |
| 24 | 21 | 21.5245848126983 | -0.524584812698307 |
| 25 | 19 | 19.6233732350813 | -0.623373235081348 |
| 26 | 23 | 20.8036208679696 | 2.19637913203040 |
| 27 | 23 | 21.2057534118757 | 1.79424658812427 |
| 28 | 23 | 23.3910531290642 | -0.391053129064169 |
| 29 | 23 | 22.7510689150984 | 0.248931084901579 |
| 30 | 27 | 23.5396815477322 | 3.46031845226778 |
| 31 | 26 | 23.0937376250345 | 2.90626237496545 |
| 32 | 17 | 23.7219862227915 | -6.72198622279145 |
| 33 | 24 | 22.6209869178559 | 1.37901308214414 |
| 34 | 26 | 25.5145221233626 | 0.485477876637384 |
| 35 | 24 | 25.0805934546039 | -1.08059345460386 |
| 36 | 27 | 24.6460631529488 | 2.35393684705121 |
| 37 | 27 | 24.4407280067327 | 2.55927199326728 |
| 38 | 26 | 27.1669958212266 | -1.16699582122660 |
| 39 | 24 | 24.3683200907296 | -0.368320090729552 |
| 40 | 23 | 23.7835727066262 | -0.7835727066262 |
| 41 | 23 | 22.5842809135742 | 0.415719086425817 |
| 42 | 24 | 23.2735250588549 | 0.726474941145096 |
| 43 | 17 | 19.9788645974371 | -2.97886459743713 |
| 44 | 21 | 17.2630526625727 | 3.73694733742725 |
| 45 | 19 | 21.4062092793341 | -2.40620927933408 |
| 46 | 22 | 19.0734665687921 | 2.92653343120787 |
| 47 | 22 | 19.4841616008255 | 2.51583839917451 |
| 48 | 18 | 19.9044579425670 | -1.90445794256703 |
| 49 | 16 | 15.5655800382309 | 0.434419961769114 |
| 50 | 14 | 16.5256970092773 | -2.52569700927733 |
| 51 | 12 | 11.8306919535871 | 0.169308046412859 |
| 52 | 14 | 12.5006056421107 | 1.49939435788932 |
| 53 | 16 | 12.2418741990317 | 3.75812580096831 |
| 54 | 8 | 10.9328172505992 | -2.93281725059918 |
| 55 | 3 | 3.51310134146743 | -0.513101341467427 |
| 56 | 0 | 1.27697322628293 | -1.27697322628293 |
| 57 | 5 | 2.88364759156723 | 2.11635240843277 |
| 58 | 1 | 4.23862864399928 | -3.23862864399928 |
| 59 | 1 | 0.743143248645286 | 0.256856751354713 |
| 60 | 3 | 1.20076973304137 | 1.79923026695863 |
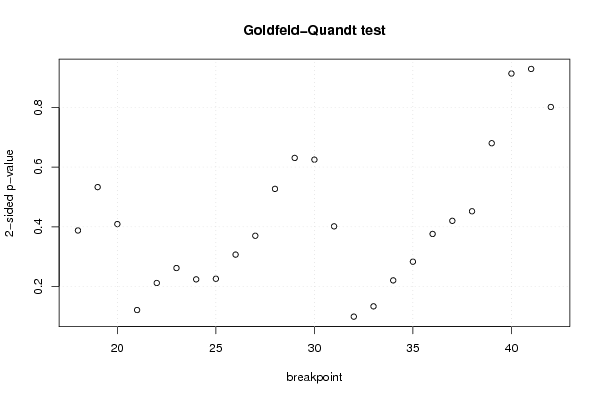
| Goldfeld-Quandt test for Heteroskedasticity | |||
| p-values | Alternative Hypothesis | ||
| breakpoint index | greater | 2-sided | less |
| 18 | 0.806060903722517 | 0.387878192554965 | 0.193939096277483 |
| 19 | 0.733478827327265 | 0.53304234534547 | 0.266521172672735 |
| 20 | 0.795385170250875 | 0.40922965949825 | 0.204614829749125 |
| 21 | 0.939254270373974 | 0.121491459252053 | 0.0607457296260263 |
| 22 | 0.893961770932382 | 0.212076458135237 | 0.106038229067618 |
| 23 | 0.868980373480185 | 0.26203925303963 | 0.131019626519815 |
| 24 | 0.88788235261768 | 0.224235294764640 | 0.112117647382320 |
| 25 | 0.886912317931032 | 0.226175364137936 | 0.113087682068968 |
| 26 | 0.84648036153397 | 0.307039276932061 | 0.153519638466030 |
| 27 | 0.814930160321393 | 0.370139679357213 | 0.185069839678607 |
| 28 | 0.736457059458561 | 0.527085881082879 | 0.263542940541439 |
| 29 | 0.68461556154148 | 0.630768876917041 | 0.315384438458520 |
| 30 | 0.6875000501445 | 0.624999899711 | 0.3124999498555 |
| 31 | 0.79916503271968 | 0.401669934560642 | 0.200834967280321 |
| 32 | 0.950352979539844 | 0.099294040920313 | 0.0496470204601565 |
| 33 | 0.933091330681804 | 0.133817338636391 | 0.0669086693181956 |
| 34 | 0.889617868289393 | 0.220764263421213 | 0.110382131710607 |
| 35 | 0.858342149251178 | 0.283315701497645 | 0.141657850748822 |
| 36 | 0.811877752448137 | 0.376244495103726 | 0.188122247551863 |
| 37 | 0.789911672212669 | 0.420176655574662 | 0.210088327787331 |
| 38 | 0.773915352445743 | 0.452169295108514 | 0.226084647554257 |
| 39 | 0.660007582736888 | 0.679984834526224 | 0.339992417263112 |
| 40 | 0.543328418602098 | 0.913343162795803 | 0.456671581397902 |
| 41 | 0.464357132355874 | 0.928714264711749 | 0.535642867644126 |
| 42 | 0.400662763401171 | 0.801325526802343 | 0.599337236598829 |
| Meta Analysis of Goldfeld-Quandt test for Heteroskedasticity | |||
| Description | # significant tests | % significant tests | OK/NOK |
| 1% type I error level | 0 | 0 | OK |
| 5% type I error level | 0 | 0 | OK |
| 10% type I error level | 1 | 0.04 | OK |