| Multiple Linear Regression - Estimated Regression Equation |
| X[t] = -14.5866928548540 + 3.81450091388516Y[t] -0.0614895038985489`y(t)`[t] + 0.298353875860903`y(t-1)`[t] + 0.443207090249879`y(t-2)`[t] + 0.182742933153958`y(t-3)`[t] + 32.2967210061925M1[t] + 42.8733727282386M2[t] + 36.7193713043985M3[t] + 23.9288546766903M4[t] + 13.7481929951856M5[t] + 20.4676144284120M6[t] + 22.442884965267M7[t] + 22.5990064410627M8[t] + 38.328605594057M9[t] + 48.7954535622456M10[t] -7.94034379372219M11[t] + 0.180699665271588t + e[t] |
| Multiple Linear Regression - Ordinary Least Squares | |||||
| Variable | Parameter | S.D. | T-STAT H0: parameter = 0 | 2-tail p-value | 1-tail p-value |
| (Intercept) | -14.5866928548540 | 14.154942 | -1.0305 | 0.309289 | 0.154645 |
| Y | 3.81450091388516 | 2.597743 | 1.4684 | 0.150228 | 0.075114 |
| `y(t)` | -0.0614895038985489 | 0.141793 | -0.4337 | 0.66699 | 0.333495 |
| `y(t-1)` | 0.298353875860903 | 0.136986 | 2.178 | 0.035682 | 0.017841 |
| `y(t-2)` | 0.443207090249879 | 0.142821 | 3.1032 | 0.003604 | 0.001802 |
| `y(t-3)` | 0.182742933153958 | 0.150411 | 1.215 | 0.231876 | 0.115938 |
| M1 | 32.2967210061925 | 4.906805 | 6.582 | 0 | 0 |
| M2 | 42.8733727282386 | 5.300258 | 8.0889 | 0 | 0 |
| M3 | 36.7193713043985 | 6.063467 | 6.0558 | 0 | 0 |
| M4 | 23.9288546766903 | 5.853191 | 4.0882 | 0.000217 | 0.000109 |
| M5 | 13.7481929951856 | 5.137656 | 2.676 | 0.010934 | 0.005467 |
| M6 | 20.4676144284120 | 6.186255 | 3.3086 | 0.002059 | 0.001029 |
| M7 | 22.442884965267 | 5.628103 | 3.9876 | 0.000293 | 0.000146 |
| M8 | 22.5990064410627 | 5.641269 | 4.006 | 0.000277 | 0.000139 |
| M9 | 38.328605594057 | 8.767507 | 4.3717 | 9.2e-05 | 4.6e-05 |
| M10 | 48.7954535622456 | 9.177321 | 5.317 | 5e-06 | 2e-06 |
| M11 | -7.94034379372219 | 6.759368 | -1.1747 | 0.247417 | 0.123708 |
| t | 0.180699665271588 | 0.065854 | 2.7439 | 0.009215 | 0.004607 |
| Multiple Linear Regression - Regression Statistics | |
| Multiple R | 0.945747076096644 |
| R-squared | 0.894437531945352 |
| Adjusted R-squared | 0.847212217289326 |
| F-TEST (value) | 18.9397897813945 |
| F-TEST (DF numerator) | 17 |
| F-TEST (DF denominator) | 38 |
| p-value | 1.54765089632747e-13 |
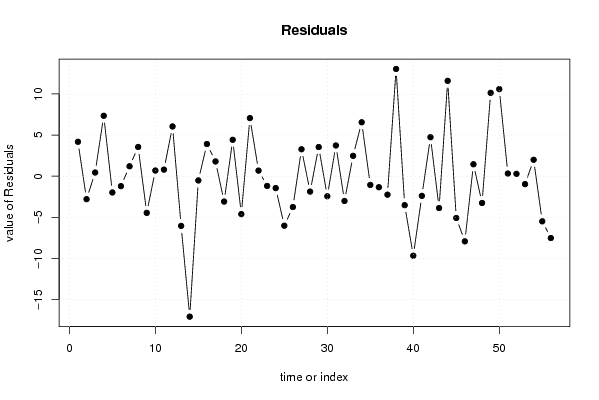
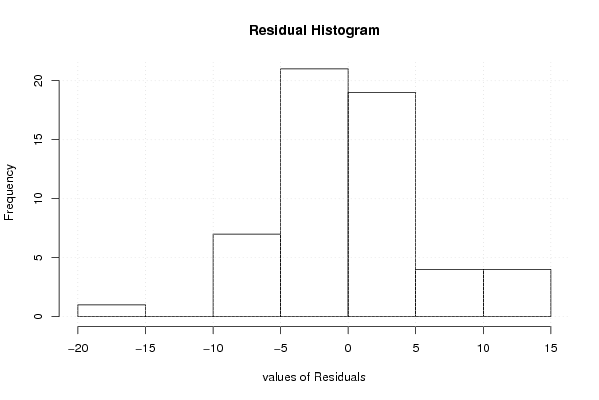
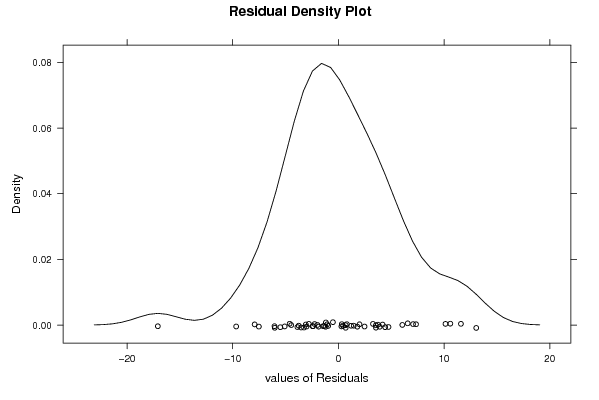
| Multiple Linear Regression - Residual Statistics | |
| Residual Standard Deviation | 6.55580806681484 |
| Sum Squared Residuals | 1633.18753753875 |
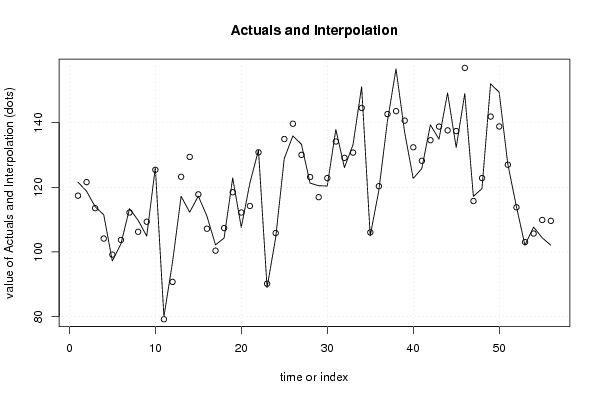
| Multiple Linear Regression - Actuals, Interpolation, and Residuals | |||
| Time or Index | Actuals | Interpolation Forecast | Residuals Prediction Error |
| 1 | 121.6 | 117.415873943338 | 4.18412605666175 |
| 2 | 118.8 | 121.595686730419 | -2.79568673041905 |
| 3 | 114 | 113.553207111846 | 0.446792888153958 |
| 4 | 111.5 | 104.152583244551 | 7.34741675544911 |
| 5 | 97.2 | 99.179340673761 | -1.97934067376104 |
| 6 | 102.5 | 103.710302744370 | -1.21030274436988 |
| 7 | 113.4 | 112.196451942892 | 1.20354805710789 |
| 8 | 109.8 | 106.246685682119 | 3.55331431788076 |
| 9 | 104.9 | 109.357247057662 | -4.45724705766225 |
| 10 | 126.1 | 125.413942225588 | 0.686057774411688 |
| 11 | 80 | 79.200968941765 | 0.799031058234997 |
| 12 | 96.8 | 90.7512577983506 | 6.04874220164938 |
| 13 | 117.2 | 123.246736102969 | -6.04673610296916 |
| 14 | 112.3 | 129.385440743158 | -17.0854407431585 |
| 15 | 117.3 | 117.817428062606 | -0.517428062606313 |
| 16 | 111.1 | 107.187604471400 | 3.9123955286003 |
| 17 | 102.2 | 100.407833989356 | 1.79216601064425 |
| 18 | 104.3 | 107.386160323223 | -3.0861603232233 |
| 19 | 122.9 | 118.474614233987 | 4.42538576601275 |
| 20 | 107.6 | 112.208747795687 | -4.60874779568654 |
| 21 | 121.3 | 114.234880039246 | 7.06511996075367 |
| 22 | 131.5 | 130.820485634814 | 0.679514365186276 |
| 23 | 89 | 90.1865526669731 | -1.18655266697309 |
| 24 | 104.4 | 105.849401589532 | -1.44940158953221 |
| 25 | 128.9 | 134.922629451212 | -6.02262945121231 |
| 26 | 135.9 | 139.653829979032 | -3.75382997903233 |
| 27 | 133.3 | 130.027145644606 | 3.27285435539431 |
| 28 | 121.3 | 123.173582600190 | -1.87358260018965 |
| 29 | 120.5 | 116.954319157176 | 3.54568084282432 |
| 30 | 120.4 | 122.840248319748 | -2.44024831974766 |
| 31 | 137.9 | 134.161822759065 | 3.73817724093501 |
| 32 | 126.1 | 129.114558909231 | -3.01455890923095 |
| 33 | 133.2 | 130.725188249057 | 2.47481175094310 |
| 34 | 151.1 | 144.541828907885 | 6.55817109211522 |
| 35 | 105 | 106.062142127660 | -1.06214212765973 |
| 36 | 119 | 120.341387495048 | -1.34138749504774 |
| 37 | 140.4 | 142.649792149251 | -2.24979214925078 |
| 38 | 156.6 | 143.556262953006 | 13.0437370469935 |
| 39 | 137.1 | 140.623736078071 | -3.52373607807136 |
| 40 | 122.7 | 132.371660967248 | -9.67166096724821 |
| 41 | 125.8 | 128.194250392190 | -2.39425039219045 |
| 42 | 139.3 | 134.559108758229 | 4.74089124177082 |
| 43 | 134.9 | 138.775979030085 | -3.87597903008539 |
| 44 | 149.2 | 137.605275860176 | 11.5947241398243 |
| 45 | 132.3 | 137.382684654035 | -5.08268465403452 |
| 46 | 149 | 156.923743231713 | -7.92374323171319 |
| 47 | 117.2 | 115.750336263602 | 1.44966373639782 |
| 48 | 119.6 | 122.857953117069 | -3.25795311706941 |
| 49 | 152 | 141.864968353230 | 10.1350316467705 |
| 50 | 149.4 | 138.808779594384 | 10.5912204056163 |
| 51 | 127.3 | 126.978483102871 | 0.321516897129407 |
| 52 | 114.1 | 113.814568716612 | 0.285431283388453 |
| 53 | 102.1 | 103.064255787517 | -0.964255787517077 |
| 54 | 107.7 | 105.70417985443 | 1.99582014557002 |
| 55 | 104.4 | 109.891132033970 | -5.49113203397025 |
| 56 | 102.1 | 109.624731752788 | -7.52473175278754 |
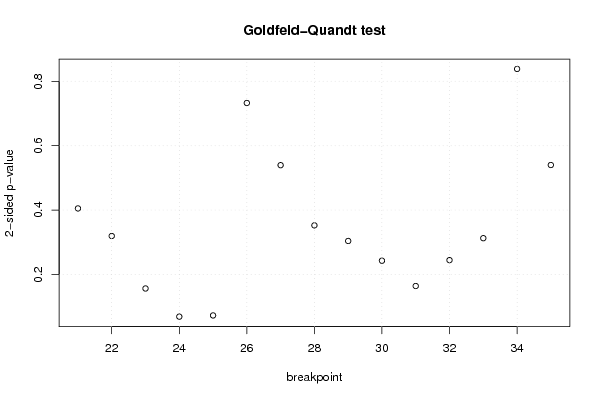
| Goldfeld-Quandt test for Heteroskedasticity | |||
| p-values | Alternative Hypothesis | ||
| breakpoint index | greater | 2-sided | less |
| 21 | 0.202620487538644 | 0.405240975077288 | 0.797379512461356 |
| 22 | 0.15980078098405 | 0.3196015619681 | 0.84019921901595 |
| 23 | 0.0783236120741228 | 0.156647224148246 | 0.921676387925877 |
| 24 | 0.0345918655051737 | 0.0691837310103475 | 0.965408134494826 |
| 25 | 0.0364899466248148 | 0.0729798932496296 | 0.963510053375185 |
| 26 | 0.366320329033942 | 0.732640658067885 | 0.633679670966058 |
| 27 | 0.269772251075367 | 0.539544502150734 | 0.730227748924633 |
| 28 | 0.176329536206567 | 0.352659072413134 | 0.823670463793433 |
| 29 | 0.152075696227899 | 0.304151392455798 | 0.8479243037721 |
| 30 | 0.121445856615829 | 0.242891713231658 | 0.87855414338417 |
| 31 | 0.0821513498158866 | 0.164302699631773 | 0.917848650184113 |
| 32 | 0.122347327374468 | 0.244694654748936 | 0.877652672625532 |
| 33 | 0.156405537238638 | 0.312811074477277 | 0.843594462761362 |
| 34 | 0.41917317944019 | 0.83834635888038 | 0.58082682055981 |
| 35 | 0.270029898777281 | 0.540059797554561 | 0.729970101222719 |
| Meta Analysis of Goldfeld-Quandt test for Heteroskedasticity | |||
| Description | # significant tests | % significant tests | OK/NOK |
| 1% type I error level | 0 | 0 | OK |
| 5% type I error level | 0 | 0 | OK |
| 10% type I error level | 2 | 0.133333333333333 | NOK |