| Multiple Linear Regression - Estimated Regression Equation |
| Y[t] = + 1.82388126251341 + 0.892280450799985X[t] -2.05379470810230M1[t] -1.87816490349226M2[t] -4.25269657265825M3[t] -4.24507385084022M4[t] -0.926679174102201M5[t] + 0.0132594124758251M6[t] -0.357573955866153M7[t] -0.199789760272128M8[t] -1.4204616548381M9[t] -1.07312646661207M10[t] -1.77932810543403M11[t] -0.0187176242900313t + e[t] |
| Multiple Linear Regression - Ordinary Least Squares | |||||
| Variable | Parameter | S.D. | T-STAT H0: parameter = 0 | 2-tail p-value | 1-tail p-value |
| (Intercept) | 1.82388126251341 | 3.788473 | 0.4814 | 0.632494 | 0.316247 |
| X | 0.892280450799985 | 0.111612 | 7.9945 | 0 | 0 |
| M1 | -2.05379470810230 | 2.848418 | -0.721 | 0.47454 | 0.23727 |
| M2 | -1.87816490349226 | 2.843325 | -0.6606 | 0.512194 | 0.256097 |
| M3 | -4.25269657265825 | 2.837918 | -1.4985 | 0.140828 | 0.070414 |
| M4 | -4.24507385084022 | 2.833833 | -1.498 | 0.140965 | 0.070483 |
| M5 | -0.926679174102201 | 2.830867 | -0.3273 | 0.74489 | 0.372445 |
| M6 | 0.0132594124758251 | 2.828398 | 0.0047 | 0.99628 | 0.49814 |
| M7 | -0.357573955866153 | 2.826658 | -0.1265 | 0.899887 | 0.449943 |
| M8 | -0.199789760272128 | 2.825291 | -0.0707 | 0.943931 | 0.471966 |
| M9 | -1.4204616548381 | 2.823724 | -0.503 | 0.617333 | 0.308666 |
| M10 | -1.07312646661207 | 2.821957 | -0.3803 | 0.70549 | 0.352745 |
| M11 | -1.77932810543403 | 2.820984 | -0.6307 | 0.531327 | 0.265664 |
| t | -0.0187176242900313 | 0.042106 | -0.4445 | 0.658736 | 0.329368 |
| Multiple Linear Regression - Regression Statistics | |
| Multiple R | 0.839367041031213 |
| R-squared | 0.704537029569493 |
| Adjusted R-squared | 0.621036624882611 |
| F-TEST (value) | 8.43752832350253 |
| F-TEST (DF numerator) | 13 |
| F-TEST (DF denominator) | 46 |
| p-value | 2.34250538966307e-08 |
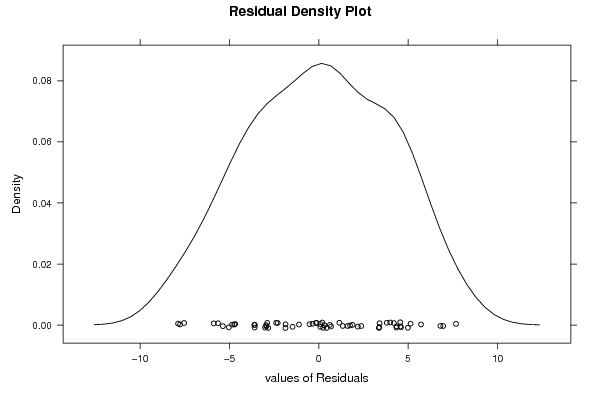
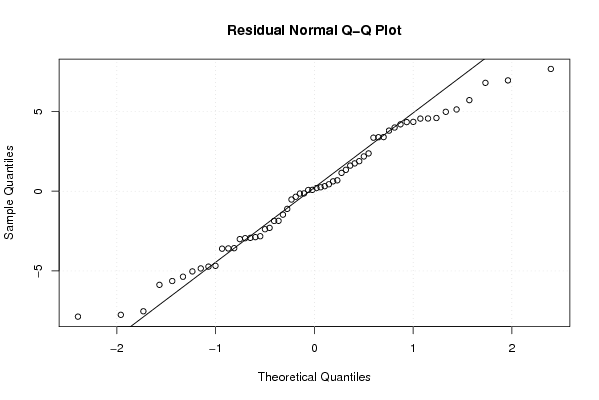
| Multiple Linear Regression - Residual Statistics | |
| Residual Standard Deviation | 4.46003782858767 |
| Sum Squared Residuals | 915.029121891917 |
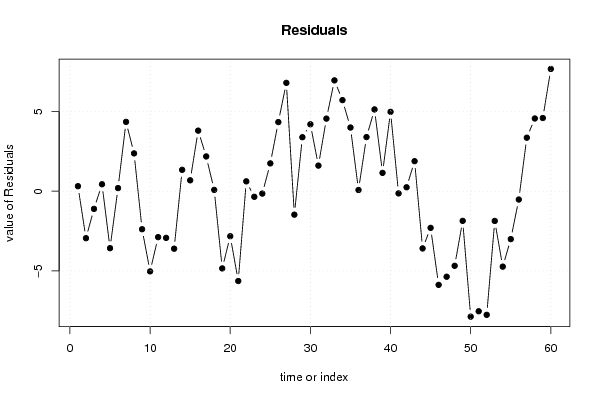
| Multiple Linear Regression - Actuals, Interpolation, and Residuals | |||
| Time or Index | Actuals | Interpolation Forecast | Residuals Prediction Error |
| 1 | 23 | 22.6829765156807 | 0.31702348431929 |
| 2 | 19 | 21.9476082452007 | -2.94760824520069 |
| 3 | 18 | 19.1082187263447 | -1.10821872634470 |
| 4 | 19 | 18.5617555533927 | 0.438244446607296 |
| 5 | 19 | 22.5752569664807 | -3.57525696648068 |
| 6 | 22 | 21.8011450722487 | 0.198854927751297 |
| 7 | 23 | 18.6455246821367 | 4.35447531786325 |
| 8 | 20 | 17.6246266674008 | 2.37537333259924 |
| 9 | 14 | 16.3852371485448 | -2.38523714854476 |
| 10 | 14 | 19.0337838845607 | -5.03378388456072 |
| 11 | 14 | 16.8812159001687 | -2.88121590016875 |
| 12 | 15 | 17.9280020206728 | -2.92800202067276 |
| 13 | 11 | 14.6062970571605 | -3.60629705716045 |
| 14 | 17 | 15.6554896882804 | 1.34451031171956 |
| 15 | 16 | 15.3144854316644 | 0.68551456833561 |
| 16 | 20 | 16.1956709799924 | 3.80432902000764 |
| 17 | 24 | 21.8152772045203 | 2.18472279547968 |
| 18 | 23 | 22.9149542569683 | 0.0850457430316920 |
| 19 | 20 | 24.8453324364163 | -4.84533243641626 |
| 20 | 21 | 23.8244344216803 | -2.82443442168027 |
| 21 | 19 | 24.6372899396642 | -5.63728993966424 |
| 22 | 23 | 22.3782941962803 | 0.621705803719719 |
| 23 | 23 | 23.3487077896883 | -0.348707789688255 |
| 24 | 23 | 23.1463012790723 | -0.146301279072288 |
| 25 | 23 | 21.2522450368400 | 1.74775496316004 |
| 26 | 27 | 22.6583498482799 | 4.34165015172006 |
| 27 | 26 | 19.1943640138639 | 6.80563598613606 |
| 28 | 17 | 18.4694447507519 | -1.46944475075195 |
| 29 | 24 | 20.6091572171600 | 3.39084278284004 |
| 30 | 26 | 21.7980623146880 | 4.20193768531205 |
| 31 | 24 | 22.3900198179359 | 1.60998018206408 |
| 32 | 27 | 22.4398583441599 | 4.56014165584008 |
| 33 | 27 | 20.0405042392639 | 6.95949576073606 |
| 34 | 26 | 20.2798937581199 | 5.72010624188006 |
| 35 | 24 | 20.0011147204079 | 3.99888527959207 |
| 36 | 23 | 22.9216897875919 | 0.0783102124080875 |
| 37 | 23 | 19.5999848240796 | 3.40001517592039 |
| 38 | 24 | 18.8646165535996 | 5.13538344640037 |
| 39 | 17 | 15.8467709445836 | 1.15322905541638 |
| 40 | 21 | 16.0141321322716 | 4.98586786772839 |
| 41 | 19 | 19.1353530945596 | -0.135353094559606 |
| 42 | 22 | 21.7519069133676 | 0.24809308663243 |
| 43 | 22 | 20.1131632896156 | 1.88683671038442 |
| 44 | 18 | 21.5906505371196 | -3.59065053711955 |
| 45 | 16 | 18.2990159814236 | -2.29901598142359 |
| 46 | 14 | 19.8768261764796 | -5.87682617647957 |
| 47 | 12 | 17.3673460117676 | -5.3673460117676 |
| 48 | 14 | 18.6818162675116 | -4.68181626751161 |
| 49 | 16 | 17.8584965662393 | -1.85849656623926 |
| 50 | 8 | 15.8739356646393 | -7.8739356646393 |
| 51 | 3 | 10.5361608835433 | -7.53616088354334 |
| 52 | 0 | 7.75899658359138 | -7.75899658359138 |
| 53 | 5 | 6.86495551727944 | -1.86495551727944 |
| 54 | 1 | 5.73393144272747 | -4.73393144272747 |
| 55 | 1 | 4.00595977389549 | -3.00595977389549 |
| 56 | 3 | 3.52043002963949 | -0.520430029639488 |
| 57 | 6 | 2.63795269110348 | 3.36204730889652 |
| 58 | 7 | 2.43120198455949 | 4.56879801544051 |
| 59 | 8 | 3.40161557796746 | 4.59838442203254 |
| 60 | 14 | 6.32219064515144 | 7.67780935484856 |
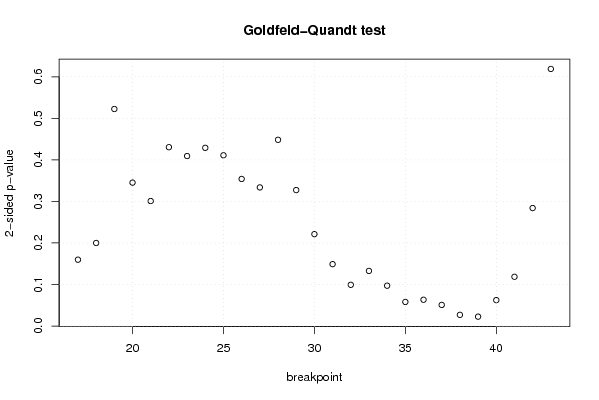
| Goldfeld-Quandt test for Heteroskedasticity | |||
| p-values | Alternative Hypothesis | ||
| breakpoint index | greater | 2-sided | less |
| 17 | 0.0798421207445119 | 0.159684241489024 | 0.920157879255488 |
| 18 | 0.099958930395833 | 0.199917860791666 | 0.900041069604167 |
| 19 | 0.261249254251796 | 0.522498508503593 | 0.738750745748204 |
| 20 | 0.172604074043467 | 0.345208148086935 | 0.827395925956533 |
| 21 | 0.150444591373305 | 0.30088918274661 | 0.849555408626695 |
| 22 | 0.215258235147274 | 0.430516470294548 | 0.784741764852726 |
| 23 | 0.204617021896514 | 0.409234043793027 | 0.795382978103486 |
| 24 | 0.214509950666125 | 0.429019901332251 | 0.785490049333875 |
| 25 | 0.205525511035727 | 0.411051022071454 | 0.794474488964273 |
| 26 | 0.177051310424645 | 0.354102620849291 | 0.822948689575354 |
| 27 | 0.166853411411175 | 0.333706822822350 | 0.833146588588825 |
| 28 | 0.224143107794457 | 0.448286215588914 | 0.775856892205543 |
| 29 | 0.163665909016553 | 0.327331818033105 | 0.836334090983447 |
| 30 | 0.110603329835750 | 0.221206659671500 | 0.88939667016425 |
| 31 | 0.0744694702273713 | 0.148938940454743 | 0.925530529772629 |
| 32 | 0.0495831824118534 | 0.0991663648237067 | 0.950416817588147 |
| 33 | 0.066296177920931 | 0.132592355841862 | 0.933703822079069 |
| 34 | 0.0485431624895558 | 0.0970863249791116 | 0.951456837510444 |
| 35 | 0.0289864048615584 | 0.0579728097231168 | 0.971013595138442 |
| 36 | 0.031621688380418 | 0.063243376760836 | 0.968378311619582 |
| 37 | 0.0253843336806100 | 0.0507686673612199 | 0.97461566631939 |
| 38 | 0.0134352880792363 | 0.0268705761584725 | 0.986564711920764 |
| 39 | 0.0112652547702724 | 0.0225305095405448 | 0.988734745229728 |
| 40 | 0.0311887472986602 | 0.0623774945973204 | 0.96881125270134 |
| 41 | 0.0592724764757049 | 0.11854495295141 | 0.940727523524295 |
| 42 | 0.141990429827741 | 0.283980859655481 | 0.85800957017226 |
| 43 | 0.690535984204343 | 0.618928031591314 | 0.309464015795657 |
| Meta Analysis of Goldfeld-Quandt test for Heteroskedasticity | |||
| Description | # significant tests | % significant tests | OK/NOK |
| 1% type I error level | 0 | 0 | OK |
| 5% type I error level | 2 | 0.0740740740740741 | NOK |
| 10% type I error level | 8 | 0.296296296296296 | NOK |