| Multiple Linear Regression - Estimated Regression Equation |
| prod[t] = + 91.162508541583 + 0.0856714386324468`inv `[t] + e[t] |
| Multiple Linear Regression - Ordinary Least Squares | |||||
| Variable | Parameter | S.D. | T-STAT H0: parameter = 0 | 2-tail p-value | 1-tail p-value |
| (Intercept) | 91.162508541583 | 7.276378 | 12.5286 | 0 | 0 |
| `inv ` | 0.0856714386324468 | 0.092924 | 0.9219 | 0.360374 | 0.180187 |
| Multiple Linear Regression - Regression Statistics | |
| Multiple R | 0.120180468187982 |
| R-squared | 0.0144433449338825 |
| Adjusted R-squared | -0.00254901118794715 |
| F-TEST (value) | 0.849990715256226 |
| F-TEST (DF numerator) | 1 |
| F-TEST (DF denominator) | 58 |
| p-value | 0.360374230373602 |
| Multiple Linear Regression - Residual Statistics | |
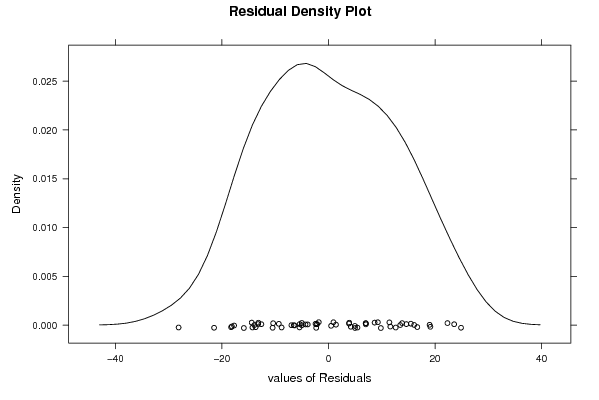
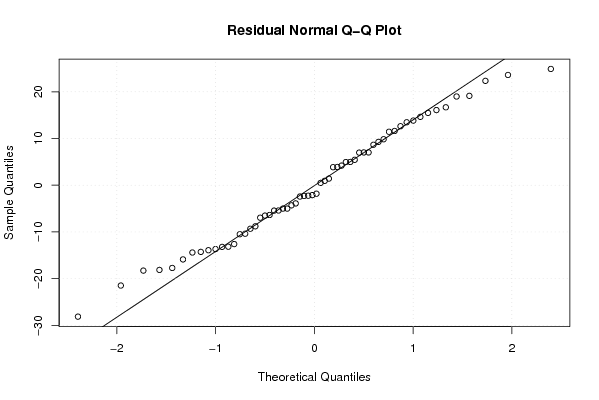
| Residual Standard Deviation | 12.5822570001917 |
| Sum Squared Residuals | 9182.16509069469 |
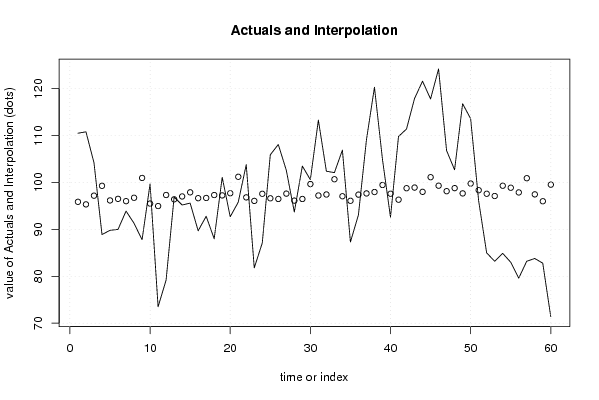
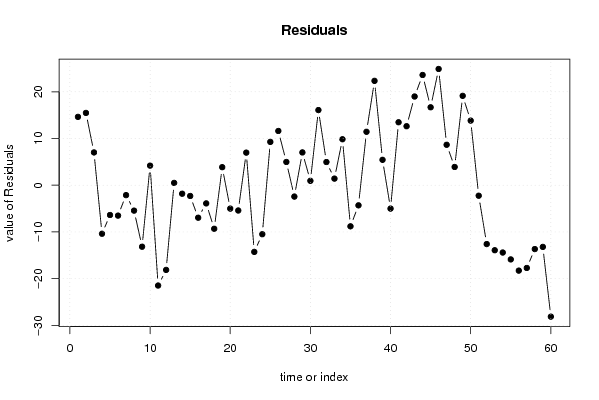
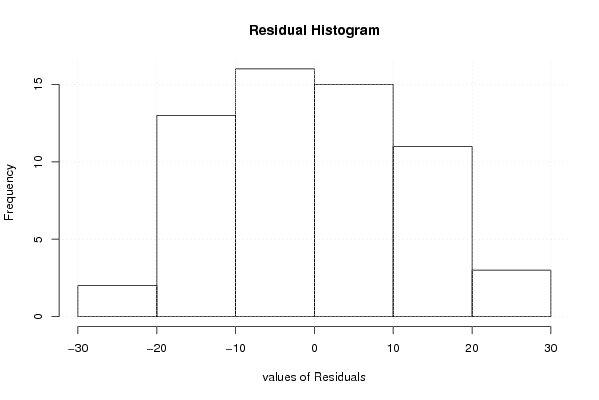
| Multiple Linear Regression - Actuals, Interpolation, and Residuals | |||
| Time or Index | Actuals | Interpolation Forecast | Residuals Prediction Error |
| 1 | 110.5 | 95.8744376663681 | 14.6255623336319 |
| 2 | 110.8 | 95.3347076029832 | 15.4652923970168 |
| 3 | 104.2 | 97.185210677444 | 7.01478932255595 |
| 4 | 88.9 | 99.284160923939 | -10.384160923939 |
| 5 | 89.8 | 96.1742877015812 | -6.37428770158119 |
| 6 | 90 | 96.5084063122477 | -6.50840631224773 |
| 7 | 93.9 | 96.0200791120428 | -2.12007911204278 |
| 8 | 91.3 | 96.7397191965553 | -5.43971919655534 |
| 9 | 87.8 | 100.963321121135 | -13.1633211211350 |
| 10 | 99.7 | 95.506050480248 | 4.1939495197519 |
| 11 | 73.5 | 94.974887560727 | -21.4748875607269 |
| 12 | 79.2 | 97.3308521231192 | -18.1308521231192 |
| 13 | 96.9 | 96.4056005858888 | 0.494399414111213 |
| 14 | 95.2 | 97.0224349440424 | -1.82243494404241 |
| 15 | 95.6 | 97.9048507619566 | -2.30485076195662 |
| 16 | 89.7 | 96.6540477579229 | -6.95404775792288 |
| 17 | 92.8 | 96.696883477239 | -3.89688347723911 |
| 18 | 88 | 97.322284979256 | -9.32228497925597 |
| 19 | 101.1 | 97.2451806844868 | 3.85481931551322 |
| 20 | 92.7 | 97.707806453102 | -5.00780645310198 |
| 21 | 95.8 | 101.211768293169 | -5.41176829316906 |
| 22 | 103.8 | 96.8253906351878 | 6.97460936481222 |
| 23 | 81.8 | 96.0714819752223 | -14.2714819752223 |
| 24 | 87.1 | 97.5878664390166 | -10.4878664390166 |
| 25 | 105.9 | 96.6283463263332 | 9.27165367366685 |
| 26 | 108.1 | 96.4912720245212 | 11.6087279754788 |
| 27 | 102.6 | 97.6221350144695 | 4.97786498553046 |
| 28 | 93.7 | 96.131451982265 | -2.43145198226496 |
| 29 | 103.5 | 96.482704880658 | 7.017295119342 |
| 30 | 100.6 | 99.6611152539218 | 0.938884746078225 |
| 31 | 113.3 | 97.219479252897 | 16.0805207471030 |
| 32 | 102.4 | 97.4422249933414 | 4.95777500665861 |
| 33 | 102.1 | 100.689172517511 | 1.41082748248886 |
| 34 | 106.9 | 97.0652706633586 | 9.83472933664137 |
| 35 | 87.3 | 96.097183406812 | -8.79718340681199 |
| 36 | 93.1 | 97.4079564178884 | -4.30795641788843 |
| 37 | 109.1 | 97.6649707337858 | 11.4350292662142 |
| 38 | 120.3 | 97.9648207689993 | 22.3351792310007 |
| 39 | 104.9 | 99.4640709450671 | 5.43592905493286 |
| 40 | 92.6 | 97.605000726743 | -5.00500072674305 |
| 41 | 109.8 | 96.3284962911196 | 13.4715037088804 |
| 42 | 111.4 | 98.7786994360076 | 12.6213005639924 |
| 43 | 117.9 | 98.9157737378195 | 18.9842262621805 |
| 44 | 121.6 | 98.0076564883155 | 23.5923435116844 |
| 45 | 117.8 | 101.126096854537 | 16.6739031454634 |
| 46 | 124.2 | 99.318429499392 | 24.8815705006080 |
| 47 | 106.8 | 98.1447307901275 | 8.65526920987254 |
| 48 | 102.7 | 98.795833723734 | 3.90416627626595 |
| 49 | 116.8 | 97.673537877649 | 19.126462122351 |
| 50 | 113.6 | 99.772488124144 | 13.8275118758560 |
| 51 | 96.1 | 98.3503422428453 | -2.25034224284534 |
| 52 | 85 | 97.5964335828798 | -12.5964335828798 |
| 53 | 83.2 | 97.116673526538 | -13.9166735265381 |
| 54 | 84.9 | 99.3098623555287 | -14.4098623555287 |
| 55 | 83 | 98.8815051623665 | -15.8815051623665 |
| 56 | 79.6 | 97.8791493303669 | -18.2791493303669 |
| 57 | 83.2 | 100.911918257955 | -17.7119182579555 |
| 58 | 83.8 | 97.4679264249311 | -13.6679264249311 |
| 59 | 82.8 | 96.0029448243163 | -13.2029448243163 |
| 60 | 71.4 | 99.5326080959731 | -28.1326080959731 |
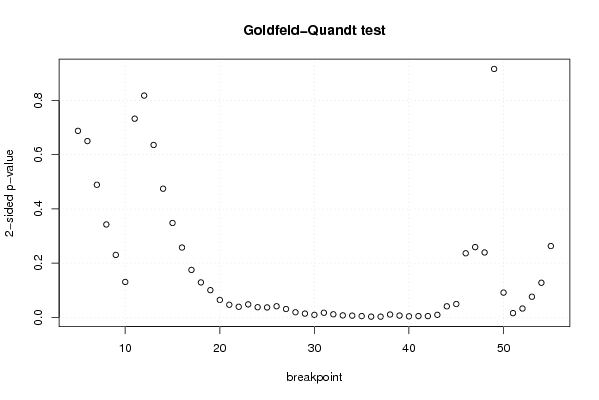
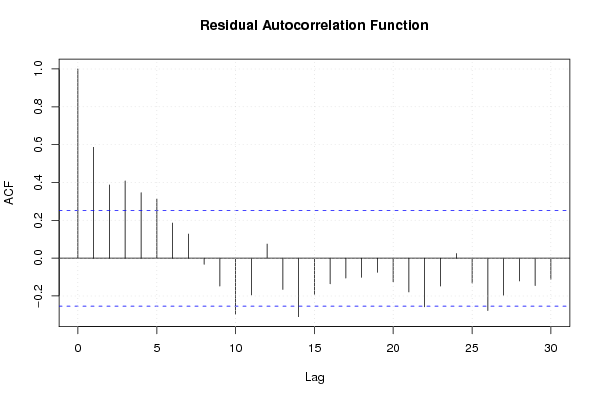
| Goldfeld-Quandt test for Heteroskedasticity | |||
| p-values | Alternative Hypothesis | ||
| breakpoint index | greater | 2-sided | less |
| 5 | 0.343950064271286 | 0.687900128542573 | 0.656049935728714 |
| 6 | 0.325143402108828 | 0.650286804217656 | 0.674856597891172 |
| 7 | 0.244557097135922 | 0.489114194271844 | 0.755442902864078 |
| 8 | 0.171337981386879 | 0.342675962773757 | 0.828662018613121 |
| 9 | 0.115145102371700 | 0.230290204743399 | 0.8848548976283 |
| 10 | 0.0653108479527721 | 0.130621695905544 | 0.934689152047228 |
| 11 | 0.36641172322532 | 0.73282344645064 | 0.63358827677468 |
| 12 | 0.409031414845979 | 0.818062829691959 | 0.590968585154021 |
| 13 | 0.317980564412423 | 0.635961128824845 | 0.682019435587577 |
| 14 | 0.237307446809065 | 0.47461489361813 | 0.762692553190935 |
| 15 | 0.174070878204942 | 0.348141756409883 | 0.825929121795058 |
| 16 | 0.128783508910556 | 0.257567017821111 | 0.871216491089444 |
| 17 | 0.0875046429618686 | 0.175009285923737 | 0.912495357038131 |
| 18 | 0.0644886409403305 | 0.128977281880661 | 0.93551135905967 |
| 19 | 0.0501710066522409 | 0.100342013304482 | 0.949828993347759 |
| 20 | 0.0321506825667225 | 0.064301365133445 | 0.967849317433278 |
| 21 | 0.0232235997403318 | 0.0464471994806636 | 0.976776400259668 |
| 22 | 0.0195088626184594 | 0.0390177252369188 | 0.98049113738154 |
| 23 | 0.0239659661827471 | 0.0479319323654943 | 0.976034033817253 |
| 24 | 0.0187408539111485 | 0.0374817078222971 | 0.981259146088851 |
| 25 | 0.0183381303639463 | 0.0366762607278926 | 0.981661869636054 |
| 26 | 0.0205072795917085 | 0.041014559183417 | 0.979492720408291 |
| 27 | 0.0154082408703558 | 0.0308164817407115 | 0.984591759129644 |
| 28 | 0.00940584826740083 | 0.0188116965348017 | 0.9905941517326 |
| 29 | 0.00693897506959461 | 0.0138779501391892 | 0.993061024930405 |
| 30 | 0.00465125409339284 | 0.00930250818678569 | 0.995348745906607 |
| 31 | 0.00849110213067076 | 0.0169822042613415 | 0.99150889786933 |
| 32 | 0.00567886913873672 | 0.0113577382774734 | 0.994321130861263 |
| 33 | 0.0036898456681214 | 0.0073796913362428 | 0.996310154331879 |
| 34 | 0.00317073463508974 | 0.00634146927017949 | 0.99682926536491 |
| 35 | 0.00235287870963842 | 0.00470575741927684 | 0.997647121290362 |
| 36 | 0.00134537132991366 | 0.00269074265982732 | 0.998654628670086 |
| 37 | 0.00131564742759180 | 0.00263129485518359 | 0.998684352572408 |
| 38 | 0.00523514989734997 | 0.0104702997946999 | 0.99476485010265 |
| 39 | 0.00331580227772813 | 0.00663160455545626 | 0.996684197722272 |
| 40 | 0.00194538947633111 | 0.00389077895266223 | 0.998054610523669 |
| 41 | 0.00235597995869436 | 0.00471195991738871 | 0.997644020041306 |
| 42 | 0.00234621218616514 | 0.00469242437233028 | 0.997653787813835 |
| 43 | 0.00467910113719957 | 0.00935820227439914 | 0.9953208988628 |
| 44 | 0.0204103447550928 | 0.0408206895101857 | 0.979589655244907 |
| 45 | 0.0246016208134189 | 0.0492032416268378 | 0.975398379186581 |
| 46 | 0.118197810693998 | 0.236395621387996 | 0.881802189306002 |
| 47 | 0.129573722916021 | 0.259147445832042 | 0.87042627708398 |
| 48 | 0.119676131407654 | 0.239352262815308 | 0.880323868592346 |
| 49 | 0.458143278028540 | 0.916286556057081 | 0.54185672197146 |
| 50 | 0.954321333555303 | 0.0913573328893948 | 0.0456786664446974 |
| 51 | 0.99212853902937 | 0.0157429219412589 | 0.00787146097062947 |
| 52 | 0.983747628280392 | 0.0325047434392165 | 0.0162523717196082 |
| 53 | 0.961958915457032 | 0.0760821690859354 | 0.0380410845429677 |
| 54 | 0.936155727947757 | 0.127688544104486 | 0.0638442720522432 |
| 55 | 0.868478210869702 | 0.263043578260596 | 0.131521789130298 |
| Meta Analysis of Goldfeld-Quandt test for Heteroskedasticity | |||
| Description | # significant tests | % significant tests | OK/NOK |
| 1% type I error level | 11 | 0.215686274509804 | NOK |
| 5% type I error level | 27 | 0.529411764705882 | NOK |
| 10% type I error level | 30 | 0.588235294117647 | NOK |