| Multiple Linear Regression - Estimated Regression Equation |
| wgb[t] = + 0.653200943441071 + 0.00702202501777568nwwz[t] + 1.34862494351242Y1[t] -0.805559669404799Y2[t] + 0.169468018952212M1[t] + 0.306393307864775M2[t] + 0.228420712145096M3[t] -0.00583118897583866M4[t] + 0.0433429091353213M5[t] + 0.0295890799380566M6[t] + 0.0559292644629458M7[t] + 0.120208514339465M8[t] + 0.592741231781824M9[t] -0.353046985245862M10[t] + 0.0176212393133223M11[t] -0.00567653245168045t + e[t] |
| Multiple Linear Regression - Ordinary Least Squares | |||||
| Variable | Parameter | S.D. | T-STAT H0: parameter = 0 | 2-tail p-value | 1-tail p-value |
| (Intercept) | 0.653200943441071 | 0.453948 | 1.4389 | 0.155836 | 0.077918 |
| nwwz | 0.00702202501777568 | 0.001412 | 4.9732 | 7e-06 | 3e-06 |
| Y1 | 1.34862494351242 | 0.086747 | 15.5467 | 0 | 0 |
| Y2 | -0.805559669404799 | 0.090653 | -8.8862 | 0 | 0 |
| M1 | 0.169468018952212 | 0.100487 | 1.6865 | 0.097371 | 0.048685 |
| M2 | 0.306393307864775 | 0.102123 | 3.0002 | 0.004048 | 0.002024 |
| M3 | 0.228420712145096 | 0.106125 | 2.1524 | 0.035772 | 0.017886 |
| M4 | -0.00583118897583866 | 0.106016 | -0.055 | 0.956335 | 0.478168 |
| M5 | 0.0433429091353213 | 0.100087 | 0.4331 | 0.66667 | 0.333335 |
| M6 | 0.0295890799380566 | 0.099418 | 0.2976 | 0.767111 | 0.383556 |
| M7 | 0.0559292644629458 | 0.100908 | 0.5543 | 0.581647 | 0.290824 |
| M8 | 0.120208514339465 | 0.104058 | 1.1552 | 0.252998 | 0.126499 |
| M9 | 0.592741231781824 | 0.116655 | 5.0811 | 5e-06 | 2e-06 |
| M10 | -0.353046985245862 | 0.131114 | -2.6927 | 0.009376 | 0.004688 |
| M11 | 0.0176212393133223 | 0.101819 | 0.1731 | 0.863236 | 0.431618 |
| t | -0.00567653245168045 | 0.001411 | -4.0229 | 0.000177 | 8.9e-05 |
| Multiple Linear Regression - Regression Statistics | |
| Multiple R | 0.97826517898424 |
| R-squared | 0.957002760413066 |
| Adjusted R-squared | 0.94527624052572 |
| F-TEST (value) | 81.6101255621272 |
| F-TEST (DF numerator) | 15 |
| F-TEST (DF denominator) | 55 |
| p-value | 0 |
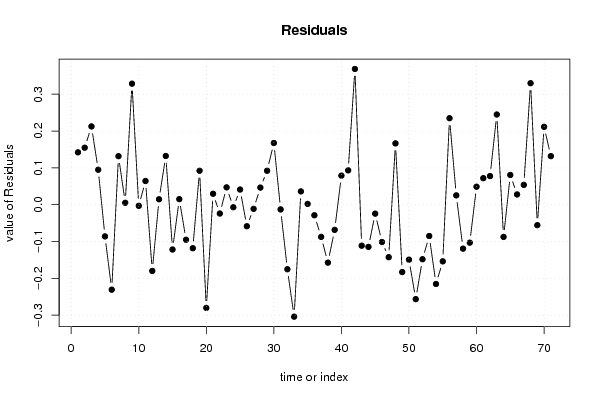
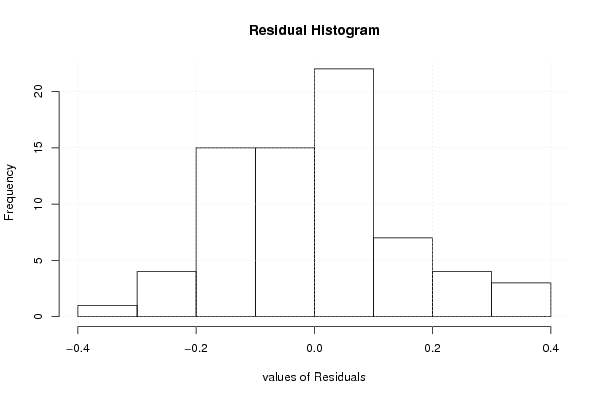
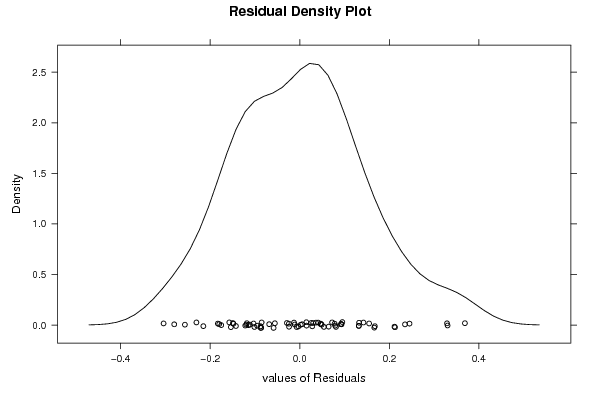
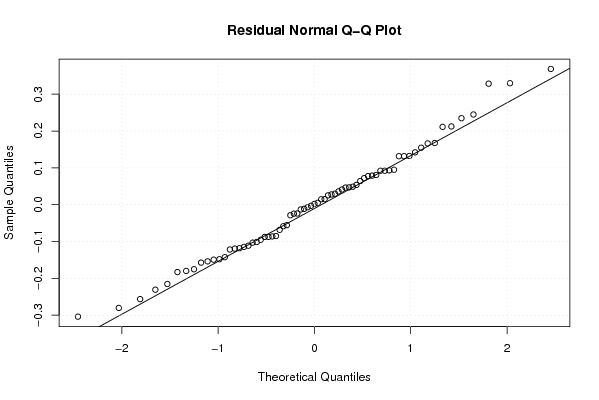
| Multiple Linear Regression - Residual Statistics | |
| Residual Standard Deviation | 0.163798831759909 |
| Sum Squared Residuals | 1.47565315072511 |
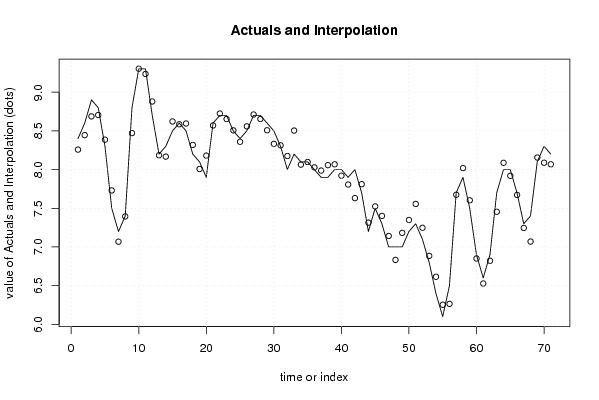
| Multiple Linear Regression - Actuals, Interpolation, and Residuals | |||
| Time or Index | Actuals | Interpolation Forecast | Residuals Prediction Error |
| 1 | 8.4 | 8.25777098973366 | 0.142229010266339 |
| 2 | 8.6 | 8.44519594633676 | 0.154804053663241 |
| 3 | 8.9 | 8.68744800701009 | 0.212551992989909 |
| 4 | 8.8 | 8.7050391726458 | 0.0949608273542069 |
| 5 | 8.3 | 8.38605039316814 | -0.086050393168142 |
| 6 | 7.5 | 7.73073137659681 | -0.230731376596812 |
| 7 | 7.2 | 7.0682528835447 | 0.131747116455296 |
| 8 | 7.4 | 7.39480395351076 | 0.00519604648924152 |
| 9 | 8.8 | 8.47136137827422 | 0.328638621725780 |
| 10 | 9.3 | 9.3030358159735 | -0.00303581597349203 |
| 11 | 9.3 | 9.23562251772382 | 0.0643774822761842 |
| 12 | 8.7 | 8.87976516143417 | -0.179765161434172 |
| 13 | 8.2 | 8.18522750670282 | 0.0147724932971820 |
| 14 | 8.3 | 8.16763174315702 | 0.132368256842979 |
| 15 | 8.5 | 8.6216249440393 | -0.121624944039307 |
| 16 | 8.6 | 8.58490958226425 | 0.015090417735754 |
| 17 | 8.5 | 8.59513568337623 | -0.0951356833762322 |
| 18 | 8.2 | 8.31815471032891 | -0.118154710328912 |
| 19 | 8.1 | 8.0077648212711 | 0.0922351787289031 |
| 20 | 7.9 | 8.1801949701839 | -0.280194970183909 |
| 21 | 8.6 | 8.570234533697 | 0.0297654663030053 |
| 22 | 8.7 | 8.72391917855728 | -0.0239191785572828 |
| 23 | 8.7 | 8.6528595714149 | 0.0471404285851058 |
| 24 | 8.5 | 8.50687368260276 | -0.00687368260275717 |
| 25 | 8.4 | 8.35880803029415 | 0.0411919697058491 |
| 26 | 8.5 | 8.5584383763914 | -0.0584383763914046 |
| 27 | 8.7 | 8.7112737845651 | -0.0112737845650952 |
| 28 | 8.7 | 8.65349234773671 | 0.046507652263292 |
| 29 | 8.6 | 8.50778987944413 | 0.0922101205558746 |
| 30 | 8.5 | 8.33243094839061 | 0.167569051609389 |
| 31 | 8.3 | 8.31283212308861 | -0.0128321230886081 |
| 32 | 8 | 8.17524379373367 | -0.175243793733668 |
| 33 | 8.2 | 8.50395480481821 | -0.303954804818213 |
| 34 | 8.1 | 8.06388294486277 | 0.0361170551372293 |
| 35 | 8.1 | 8.0977900836492 | 0.00220991635080508 |
| 36 | 8 | 8.0286518285047 | -0.0286518285047095 |
| 37 | 7.9 | 7.98736057047624 | -0.0873605704762423 |
| 38 | 7.9 | 8.05728077450859 | -0.157280774508586 |
| 39 | 8 | 8.06823166331326 | -0.0682316633132592 |
| 40 | 8 | 7.92103357398523 | 0.0789664260147686 |
| 41 | 7.9 | 7.8067328975087 | 0.0932671024913011 |
| 42 | 8 | 7.63137396645519 | 0.368626033544815 |
| 43 | 7.7 | 7.81127987967791 | -0.111279879677910 |
| 44 | 7.2 | 7.31451889693079 | -0.114518896930786 |
| 45 | 7.5 | 7.52428113643108 | -0.0242811364310837 |
| 46 | 7.3 | 7.40124977976117 | -0.101249779761171 |
| 47 | 7 | 7.14249618206034 | -0.142496182060340 |
| 48 | 7 | 6.83359071101592 | 0.166409288984084 |
| 49 | 7 | 7.18287389819568 | -0.182873898195682 |
| 50 | 7.2 | 7.34923277974544 | -0.149232779745442 |
| 51 | 7.3 | 7.5563747153299 | -0.256374715329895 |
| 52 | 7.1 | 7.24806469212091 | -0.148064692120908 |
| 53 | 6.8 | 6.88510510199522 | -0.0851051019952178 |
| 54 | 6.4 | 6.61517716615573 | -0.21517716615573 |
| 55 | 6.1 | 6.2537944414321 | -0.153794441432102 |
| 56 | 6.5 | 6.26514366865401 | 0.234856331345990 |
| 57 | 7.7 | 7.67462430727994 | 0.0253756927200614 |
| 58 | 7.9 | 8.01928562225356 | -0.11928562225356 |
| 59 | 7.5 | 7.60306639956448 | -0.103066399564482 |
| 60 | 6.9 | 6.85111861644245 | 0.048881383557553 |
| 61 | 6.6 | 6.52795900459745 | 0.072040995402554 |
| 62 | 6.9 | 6.82222037986079 | 0.0777796201392137 |
| 63 | 7.7 | 7.45504688574235 | 0.244953114257648 |
| 64 | 8 | 8.08746063124711 | -0.0874606312471133 |
| 65 | 8 | 7.91918604450758 | 0.0808139554924165 |
| 66 | 7.7 | 7.67213183207275 | 0.0278681679272501 |
| 67 | 7.3 | 7.24607585098558 | 0.0539241490144214 |
| 68 | 7.4 | 7.07009471698687 | 0.329905283013132 |
| 69 | 8.1 | 8.15554383949955 | -0.0555438394995496 |
| 70 | 8.3 | 8.08862665859172 | 0.211373341408276 |
| 71 | 8.2 | 8.06816524558727 | 0.131834754412727 |
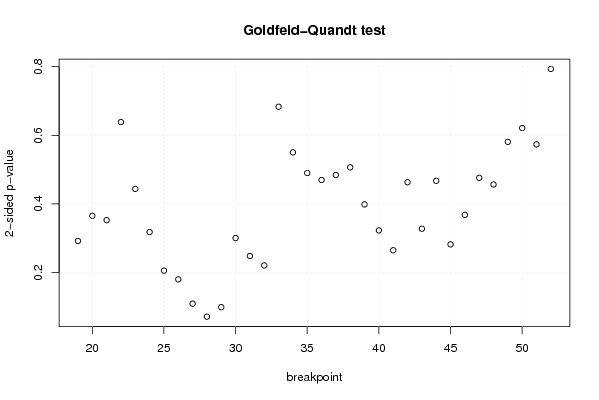
| Goldfeld-Quandt test for Heteroskedasticity | |||
| p-values | Alternative Hypothesis | ||
| breakpoint index | greater | 2-sided | less |
| 19 | 0.146143530184029 | 0.292287060368058 | 0.853856469815971 |
| 20 | 0.182786164307958 | 0.365572328615915 | 0.817213835692042 |
| 21 | 0.176478698613797 | 0.352957397227595 | 0.823521301386203 |
| 22 | 0.319342283036999 | 0.638684566073998 | 0.680657716963001 |
| 23 | 0.221995027357922 | 0.443990054715845 | 0.778004972642078 |
| 24 | 0.159118893150005 | 0.31823778630001 | 0.840881106849995 |
| 25 | 0.102935817961775 | 0.205871635923551 | 0.897064182038225 |
| 26 | 0.0902050997577756 | 0.180410199515551 | 0.909794900242224 |
| 27 | 0.054889168128782 | 0.109778336257564 | 0.945110831871218 |
| 28 | 0.0358874148601435 | 0.071774829720287 | 0.964112585139857 |
| 29 | 0.0496928379063984 | 0.0993856758127968 | 0.950307162093602 |
| 30 | 0.150339662837324 | 0.300679325674648 | 0.849660337162676 |
| 31 | 0.124239748495893 | 0.248479496991787 | 0.875760251504107 |
| 32 | 0.110502554668844 | 0.221005109337688 | 0.889497445331156 |
| 33 | 0.341647015584612 | 0.683294031169225 | 0.658352984415388 |
| 34 | 0.2751511010539 | 0.5503022021078 | 0.7248488989461 |
| 35 | 0.245133308428945 | 0.490266616857891 | 0.754866691571055 |
| 36 | 0.234963718118039 | 0.469927436236077 | 0.765036281881961 |
| 37 | 0.242224447172859 | 0.484448894345719 | 0.757775552827141 |
| 38 | 0.253382545954380 | 0.506765091908759 | 0.74661745404562 |
| 39 | 0.199397544905286 | 0.398795089810571 | 0.800602455094714 |
| 40 | 0.161520943272291 | 0.323041886544582 | 0.83847905672771 |
| 41 | 0.132609848996512 | 0.265219697993023 | 0.867390151003488 |
| 42 | 0.768360039411322 | 0.463279921177356 | 0.231639960588678 |
| 43 | 0.836060910096215 | 0.32787817980757 | 0.163939089903785 |
| 44 | 0.766245185921292 | 0.467509628157415 | 0.233754814078708 |
| 45 | 0.858852056583823 | 0.282295886832355 | 0.141147943416177 |
| 46 | 0.81579368500552 | 0.368412629988960 | 0.184206314994480 |
| 47 | 0.76189697137667 | 0.476206057246661 | 0.238103028623331 |
| 48 | 0.771559547458315 | 0.456880905083371 | 0.228440452541685 |
| 49 | 0.709491394937432 | 0.581017210125136 | 0.290508605062568 |
| 50 | 0.68937639555081 | 0.62124720889838 | 0.31062360444919 |
| 51 | 0.713160123759352 | 0.573679752481295 | 0.286839876240648 |
| 52 | 0.603317257608773 | 0.793365484782454 | 0.396682742391227 |
| Meta Analysis of Goldfeld-Quandt test for Heteroskedasticity | |||
| Description | # significant tests | % significant tests | OK/NOK |
| 1% type I error level | 0 | 0 | OK |
| 5% type I error level | 0 | 0 | OK |
| 10% type I error level | 2 | 0.0588235294117647 | OK |