| Multiple Linear Regression - Estimated Regression Equation |
| prod[t] = + 66.615835719766 + 0.261866270220996`inv `[t] + 24.6859521932016M1[t] + 25.0499411950045M2[t] + 13.7545503461808M3[t] + 5.0785128370699M4[t] + 13.6861755353866M5[t] + 7.51169583306567M6[t] + 16.4218449509768M7[t] + 12.4446259870471M8[t] + 1.82899134082118M9[t] + 19.6463261866882M10[t] + 5.43061782982147M11[t] -0.033778837209496t + e[t] |
| Multiple Linear Regression - Ordinary Least Squares | |||||
| Variable | Parameter | S.D. | T-STAT H0: parameter = 0 | 2-tail p-value | 1-tail p-value |
| (Intercept) | 66.615835719766 | 12.597272 | 5.2881 | 3e-06 | 2e-06 |
| `inv ` | 0.261866270220996 | 0.167355 | 1.5647 | 0.124499 | 0.062249 |
| M1 | 24.6859521932016 | 7.368378 | 3.3503 | 0.00162 | 0.00081 |
| M2 | 25.0499411950045 | 7.204189 | 3.4771 | 0.001118 | 0.000559 |
| M3 | 13.7545503461808 | 7.16031 | 1.9209 | 0.060949 | 0.030475 |
| M4 | 5.0785128370699 | 7.170758 | 0.7082 | 0.482379 | 0.241189 |
| M5 | 13.6861755353866 | 7.577135 | 1.8062 | 0.077425 | 0.038712 |
| M6 | 7.51169583306567 | 7.156678 | 1.0496 | 0.299382 | 0.149691 |
| M7 | 16.4218449509768 | 7.132997 | 2.3022 | 0.025898 | 0.012949 |
| M8 | 12.4446259870471 | 7.155111 | 1.7393 | 0.088677 | 0.044338 |
| M9 | 1.82899134082118 | 9.151114 | 0.1999 | 0.842467 | 0.421233 |
| M10 | 19.6463261866882 | 7.278557 | 2.6992 | 0.00969 | 0.004845 |
| M11 | 5.43061782982147 | 7.952979 | 0.6828 | 0.498132 | 0.249066 |
| t | -0.033778837209496 | 0.10958 | -0.3083 | 0.759279 | 0.37964 |
| Multiple Linear Regression - Regression Statistics | |
| Multiple R | 0.615161986324822 |
| R-squared | 0.378424269419101 |
| Adjusted R-squared | 0.202761562950586 |
| F-TEST (value) | 2.15426641788038 |
| F-TEST (DF numerator) | 13 |
| F-TEST (DF denominator) | 46 |
| p-value | 0.0283017411167295 |
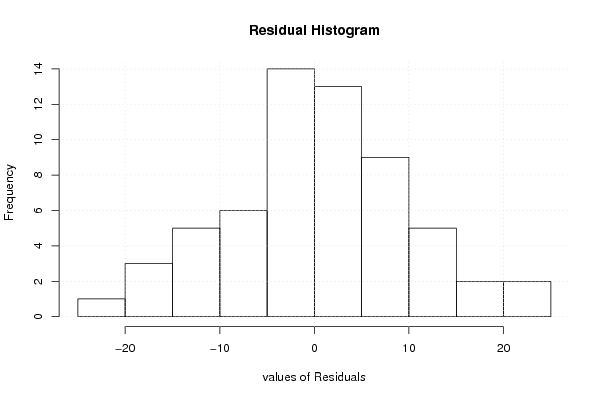
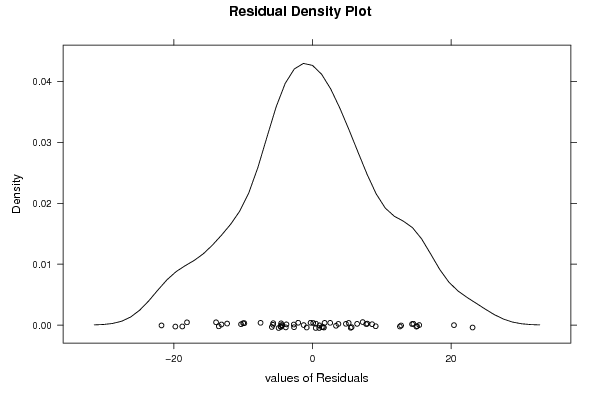
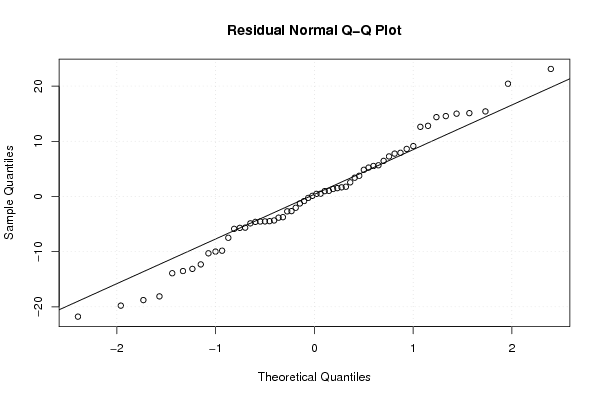
| Multiple Linear Regression - Residual Statistics | |
| Residual Standard Deviation | 11.2201809184622 |
| Sum Squared Residuals | 5791.05315277902 |
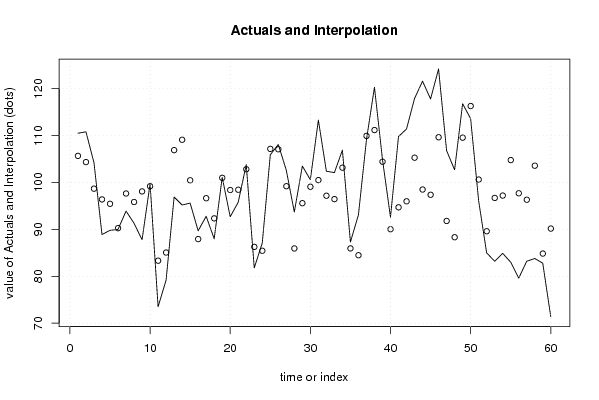
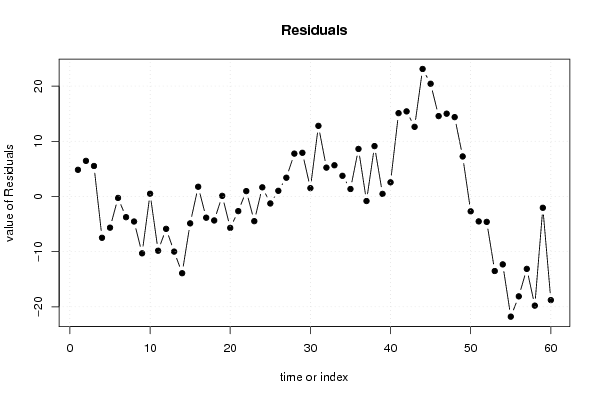
| Multiple Linear Regression - Actuals, Interpolation, and Residuals | |||
| Time or Index | Actuals | Interpolation Forecast | Residuals Prediction Error |
| 1 | 110.5 | 105.670653937913 | 4.82934606208667 |
| 2 | 110.8 | 104.351106600114 | 6.44889339988596 |
| 3 | 104.2 | 98.6782483508544 | 5.5217516491456 |
| 4 | 88.9 | 96.3841556249483 | -7.48415562494834 |
| 5 | 89.8 | 95.4522938770334 | -5.65229387703344 |
| 6 | 90 | 90.2653137913649 | -0.265313791364894 |
| 7 | 93.9 | 97.6490463318069 | -3.74904633180687 |
| 8 | 91.3 | 95.837725200524 | -4.53772520052403 |
| 9 | 87.8 | 98.0983188389837 | -10.2983188389837 |
| 10 | 99.7 | 99.2009934345638 | 0.499006565436208 |
| 11 | 73.5 | 83.3279353651174 | -9.82793536511739 |
| 12 | 79.2 | 85.0648611291638 | -5.86486112916379 |
| 13 | 96.9 | 106.888878766769 | -9.98887876676908 |
| 14 | 95.2 | 109.104526076954 | -13.9045260769537 |
| 15 | 95.6 | 100.472578974197 | -4.87257897419682 |
| 16 | 89.7 | 87.9395150826499 | 1.76048491735015 |
| 17 | 92.8 | 96.6443320788675 | -3.84433207886754 |
| 18 | 88 | 92.3476973119504 | -4.3476973119504 |
| 19 | 101.1 | 100.988387949453 | 0.111612050546823 |
| 20 | 92.7 | 98.3914680075073 | -5.69146800750732 |
| 21 | 95.8 | 98.4523849761106 | -2.65238497611064 |
| 22 | 103.8 | 102.828387949453 | 0.971612050546831 |
| 23 | 81.8 | 86.2744775774322 | -4.47447757743218 |
| 24 | 87.1 | 85.4451138933128 | 1.65488610668716 |
| 25 | 105.9 | 107.164385022830 | -1.26438502282974 |
| 26 | 108.1 | 107.075609155070 | 1.02439084493039 |
| 27 | 102.6 | 99.2030742359536 | 3.39692576404642 |
| 28 | 93.7 | 85.9367847877878 | 7.76321521221217 |
| 29 | 103.5 | 95.584320356801 | 7.9156796431989 |
| 30 | 100.6 | 99.0913004424696 | 1.50869955753036 |
| 31 | 113.3 | 100.504482021873 | 12.7955179781271 |
| 32 | 102.4 | 97.1743365233083 | 5.22566347669172 |
| 33 | 102.1 | 96.4496546812486 | 5.65034531875138 |
| 34 | 106.9 | 103.156267459558 | 3.743732540442 |
| 35 | 87.3 | 85.9476914119845 | 1.35230858801547 |
| 36 | 93.1 | 84.4898486793348 | 8.6101513206652 |
| 37 | 109.1 | 109.927620845990 | -0.82762084598985 |
| 38 | 120.3 | 111.174362956357 | 9.12563704364322 |
| 39 | 104.9 | 104.427852999191 | 0.472147000808966 |
| 40 | 92.6 | 90.035538589075 | 2.56446141092498 |
| 41 | 109.8 | 94.7076150238894 | 15.0923849761106 |
| 42 | 111.4 | 95.9887318126794 | 15.4112681873206 |
| 43 | 117.9 | 105.284088125735 | 12.6159118742653 |
| 44 | 121.6 | 98.497307860253 | 23.1026921397471 |
| 45 | 117.8 | 97.3798266128617 | 20.4201733871383 |
| 46 | 124.2 | 109.638004319856 | 14.5619956801437 |
| 47 | 106.8 | 91.8009492237524 | 14.9990507762476 |
| 48 | 102.7 | 88.326736210401 | 14.3732637895990 |
| 49 | 116.8 | 109.548461426498 | 7.251538573502 |
| 50 | 113.6 | 116.294395211506 | -2.69439521150585 |
| 51 | 96.1 | 100.618245439804 | -4.51824543980414 |
| 52 | 85 | 89.604005915539 | -4.60400591553896 |
| 53 | 83.2 | 96.7114386634086 | -13.5114386634086 |
| 54 | 84.9 | 97.2069566415357 | -12.3069566415356 |
| 55 | 83 | 104.773995571132 | -21.7739955711323 |
| 56 | 79.6 | 97.6991624084075 | -18.0991624084075 |
| 57 | 83.2 | 96.3198148907953 | -13.1198148907953 |
| 58 | 83.8 | 103.576346836569 | -19.7763468365688 |
| 59 | 82.8 | 84.8489464217135 | -2.04894642171353 |
| 60 | 71.4 | 90.1734400877876 | -18.7734400877876 |
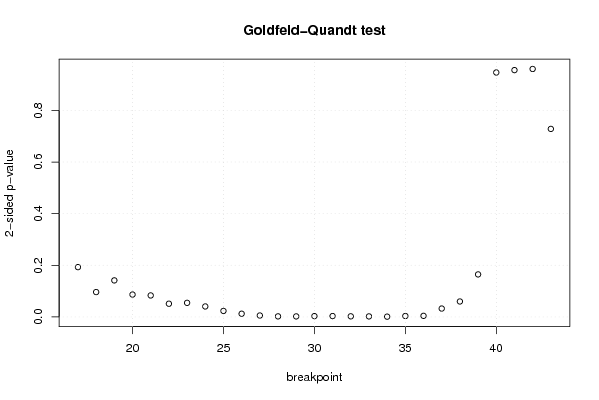
| Goldfeld-Quandt test for Heteroskedasticity | |||
| p-values | Alternative Hypothesis | ||
| breakpoint index | greater | 2-sided | less |
| 17 | 0.0964755949310787 | 0.192951189862157 | 0.903524405068921 |
| 18 | 0.0481627202277533 | 0.0963254404555066 | 0.951837279772247 |
| 19 | 0.0707887892008522 | 0.141577578401704 | 0.929211210799148 |
| 20 | 0.043355154581319 | 0.086710309162638 | 0.956644845418681 |
| 21 | 0.0416281727657958 | 0.0832563455315916 | 0.958371827234204 |
| 22 | 0.0255625174886962 | 0.0511250349773925 | 0.974437482511304 |
| 23 | 0.0272918533766425 | 0.054583706753285 | 0.972708146623358 |
| 24 | 0.0203029135598361 | 0.0406058271196723 | 0.979697086440164 |
| 25 | 0.0116444020881405 | 0.023288804176281 | 0.98835559791186 |
| 26 | 0.00620866260139614 | 0.0124173252027923 | 0.993791337398604 |
| 27 | 0.00276951984733803 | 0.00553903969467606 | 0.997230480152662 |
| 28 | 0.00112716273968816 | 0.00225432547937631 | 0.998872837260312 |
| 29 | 0.00104122173245483 | 0.00208244346490967 | 0.998958778267545 |
| 30 | 0.00157715800674303 | 0.00315431601348606 | 0.998422841993257 |
| 31 | 0.00168666497250730 | 0.00337332994501459 | 0.998313335027493 |
| 32 | 0.00119244490695311 | 0.00238488981390622 | 0.998807555093047 |
| 33 | 0.00103379065341227 | 0.00206758130682454 | 0.998966209346588 |
| 34 | 0.000547407720036218 | 0.00109481544007244 | 0.999452592279964 |
| 35 | 0.00180834123598707 | 0.00361668247197413 | 0.998191658764013 |
| 36 | 0.00212702691195710 | 0.00425405382391421 | 0.997872973088043 |
| 37 | 0.0162280586777488 | 0.0324561173554975 | 0.983771941322251 |
| 38 | 0.0299430891259082 | 0.0598861782518164 | 0.970056910874092 |
| 39 | 0.0823794600976472 | 0.164758920195294 | 0.917620539902353 |
| 40 | 0.526637578241239 | 0.946724843517522 | 0.473362421758761 |
| 41 | 0.477972860841221 | 0.955945721682442 | 0.522027139158779 |
| 42 | 0.51978503574513 | 0.96042992850974 | 0.48021496425487 |
| 43 | 0.364093281555167 | 0.728186563110335 | 0.635906718444833 |
| Meta Analysis of Goldfeld-Quandt test for Heteroskedasticity | |||
| Description | # significant tests | % significant tests | OK/NOK |
| 1% type I error level | 10 | 0.370370370370370 | NOK |
| 5% type I error level | 14 | 0.518518518518518 | NOK |
| 10% type I error level | 20 | 0.740740740740741 | NOK |