| Multiple Linear Regression - Estimated Regression Equation |
| Y[t] = + 2.86447730374015 -0.086292836908664X[t] + 0.721869390818033Y1[t] + 0.393165691970004Y2[t] -0.186439845201419`Y3 `[t] -2.21022856211889M1[t] + 14.2880488022346M2[t] + 13.5451642013673M3[t] + 16.0560856606977M4[t] + 8.10130396936484M5[t] + 11.6360412404237M6[t] + 17.3124338852545M7[t] -6.22433255674431M8[t] + 7.36102001165116M9[t] + 30.850583715014M10[t] + 16.4618484131315M11[t] + e[t] |
| Multiple Linear Regression - Ordinary Least Squares | |||||
| Variable | Parameter | S.D. | T-STAT H0: parameter = 0 | 2-tail p-value | 1-tail p-value |
| (Intercept) | 2.86447730374015 | 9.19809 | 0.3114 | 0.757098 | 0.378549 |
| X | -0.086292836908664 | 0.083492 | -1.0335 | 0.307557 | 0.153779 |
| Y1 | 0.721869390818033 | 0.169515 | 4.2584 | 0.000121 | 6.1e-05 |
| Y2 | 0.393165691970004 | 0.213275 | 1.8435 | 0.072678 | 0.036339 |
| `Y3 ` | -0.186439845201419 | 0.177096 | -1.0528 | 0.298769 | 0.149385 |
| M1 | -2.21022856211889 | 5.269972 | -0.4194 | 0.677167 | 0.338584 |
| M2 | 14.2880488022346 | 6.68478 | 2.1374 | 0.03873 | 0.019365 |
| M3 | 13.5451642013673 | 5.952244 | 2.2756 | 0.028298 | 0.014149 |
| M4 | 16.0560856606977 | 4.3289 | 3.709 | 0.000632 | 0.000316 |
| M5 | 8.10130396936484 | 4.820458 | 1.6806 | 0.100633 | 0.050317 |
| M6 | 11.6360412404237 | 5.204382 | 2.2358 | 0.03101 | 0.015505 |
| M7 | 17.3124338852545 | 5.361671 | 3.2289 | 0.002484 | 0.001242 |
| M8 | -6.22433255674431 | 5.08543 | -1.224 | 0.22813 | 0.114065 |
| M9 | 7.36102001165116 | 6.037021 | 1.2193 | 0.229867 | 0.114933 |
| M10 | 30.850583715014 | 7.629176 | 4.0438 | 0.000233 | 0.000117 |
| M11 | 16.4618484131315 | 5.015844 | 3.282 | 0.002144 | 0.001072 |
| Multiple Linear Regression - Regression Statistics | |
| Multiple R | 0.918965867543781 |
| R-squared | 0.844498265710494 |
| Adjusted R-squared | 0.78618511535193 |
| F-TEST (value) | 14.4821238522995 |
| F-TEST (DF numerator) | 15 |
| F-TEST (DF denominator) | 40 |
| p-value | 1.10615960835503e-11 |
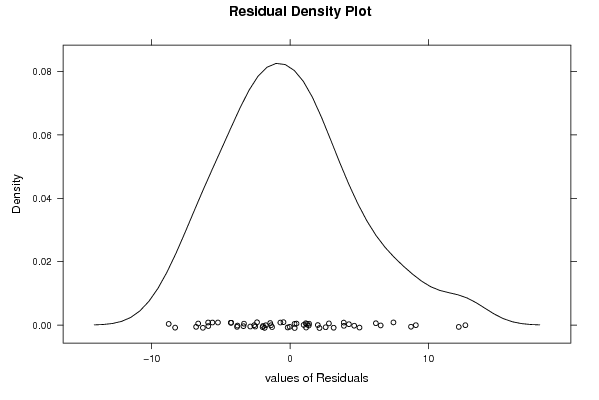
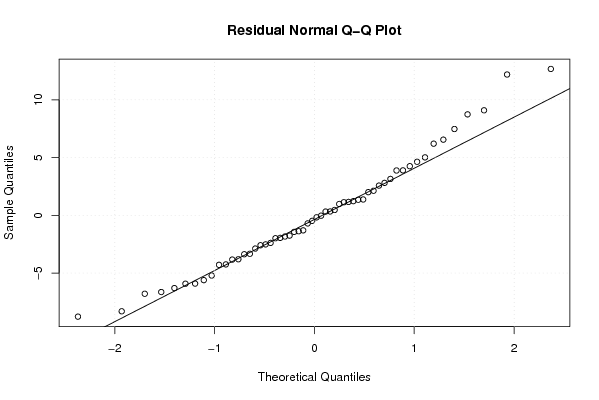
| Multiple Linear Regression - Residual Statistics | |
| Residual Standard Deviation | 5.66210143823518 |
| Sum Squared Residuals | 1282.37570787460 |
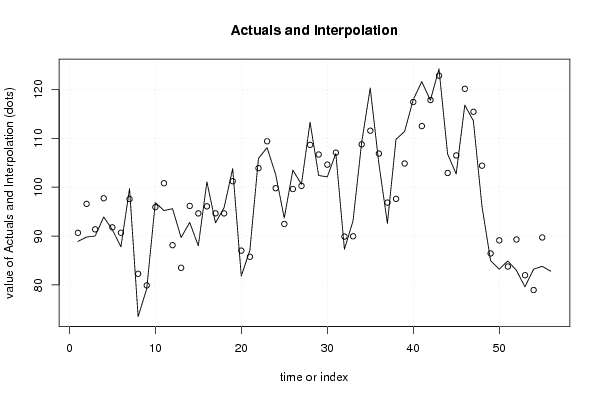
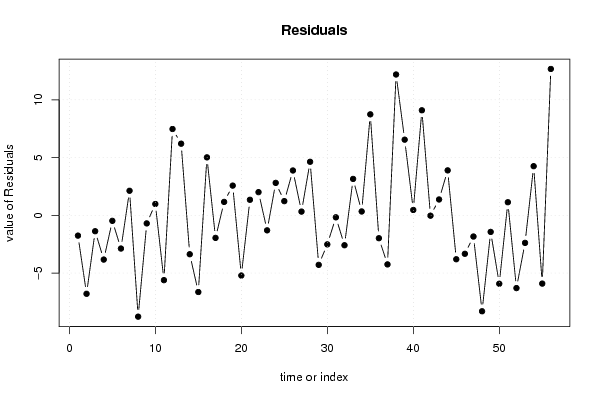
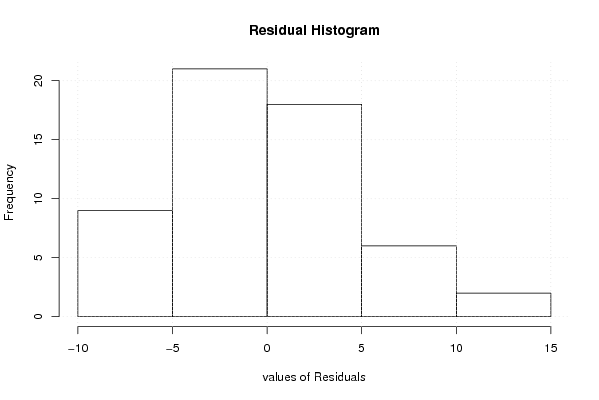
| Multiple Linear Regression - Actuals, Interpolation, and Residuals | |||
| Time or Index | Actuals | Interpolation Forecast | Residuals Prediction Error |
| 1 | 88.9 | 90.6536341014388 | -1.75363410143879 |
| 2 | 89.8 | 96.5889142454982 | -6.78891424549823 |
| 3 | 90 | 91.3742379236116 | -1.37423792361164 |
| 4 | 93.9 | 97.7277811858398 | -3.82778118583978 |
| 5 | 91.3 | 91.7742675663772 | -0.474267566377228 |
| 6 | 87.8 | 90.6739657913548 | -2.87396579135480 |
| 7 | 99.7 | 97.5713230839968 | 2.12867691600318 |
| 8 | 73.5 | 82.268481657195 | -8.76848165719501 |
| 9 | 79.2 | 79.8990143638178 | -0.699014363817748 |
| 10 | 96.9 | 95.915620945946 | 0.984379054054067 |
| 11 | 95.2 | 100.808433824306 | -5.60843382430649 |
| 12 | 95.6 | 88.126916856846 | 7.47308314315395 |
| 13 | 89.7 | 83.4969445335067 | 6.20305546649326 |
| 14 | 92.8 | 96.16726008721 | -3.36726008720991 |
| 15 | 88 | 94.6379793677417 | -6.63797936774166 |
| 16 | 101.1 | 96.0804000361587 | 5.01959996384129 |
| 17 | 92.7 | 94.6509672036549 | -1.95096720365488 |
| 18 | 95.8 | 94.6380063840518 | 1.16199361594821 |
| 19 | 103.8 | 101.225433605455 | 2.57456639454455 |
| 20 | 81.8 | 87.007907599596 | -5.20790759959608 |
| 21 | 87.1 | 85.7521123723471 | 1.34788762765290 |
| 22 | 105.9 | 103.892899635471 | 2.00710036452891 |
| 23 | 108.1 | 109.398832181894 | -1.29883218189376 |
| 24 | 102.6 | 99.789414810836 | 2.81058518916391 |
| 25 | 93.7 | 92.4702953939761 | 1.22970460602390 |
| 26 | 103.5 | 99.6175555834454 | 3.88244441655459 |
| 27 | 100.6 | 100.273771253358 | 0.326228746641827 |
| 28 | 113.3 | 108.662955734812 | 4.63704426518812 |
| 29 | 102.4 | 106.684262941219 | -4.28426294121861 |
| 30 | 102.1 | 104.614005172626 | -2.51400517262574 |
| 31 | 106.9 | 107.070731924917 | -0.170731924916517 |
| 32 | 87.3 | 89.8882922210166 | -2.58829222101665 |
| 33 | 93.1 | 89.9478515996925 | 3.15214840030745 |
| 34 | 109.1 | 108.764420439495 | 0.335579560504907 |
| 35 | 120.3 | 111.558152440895 | 8.74184755910534 |
| 36 | 104.9 | 106.880416528375 | -1.98041652837531 |
| 37 | 92.6 | 96.846372135418 | -4.24637213541808 |
| 38 | 109.8 | 97.6085413400549 | 12.1914586599451 |
| 39 | 111.4 | 104.849070730541 | 6.55092926945927 |
| 40 | 117.9 | 117.432574673988 | 0.467425326012318 |
| 41 | 121.6 | 112.506947863891 | 9.0930521361085 |
| 42 | 117.8 | 117.828815862984 | -0.0288158629844725 |
| 43 | 124.2 | 122.825737747959 | 1.37426225204068 |
| 44 | 106.8 | 102.907290216113 | 3.89270978388663 |
| 45 | 102.7 | 106.501021664143 | -3.80102166414261 |
| 46 | 116.8 | 120.127058979088 | -3.32705897908788 |
| 47 | 113.6 | 115.434581552905 | -1.83458155290508 |
| 48 | 96.1 | 104.403251803943 | -8.30325180394254 |
| 49 | 85 | 86.4327538356603 | -1.43275383566029 |
| 50 | 83.2 | 89.1177287437916 | -5.91772874379158 |
| 51 | 84.9 | 83.7649407247478 | 1.1350592752522 |
| 52 | 83 | 89.296288369202 | -6.29628836920195 |
| 53 | 79.6 | 81.9835544248578 | -2.38355442485778 |
| 54 | 83.2 | 78.9452067889832 | 4.2547932110168 |
| 55 | 83.8 | 89.7067736376719 | -5.90677363767189 |
| 56 | 82.8 | 70.1280283060789 | 12.6719716939211 |
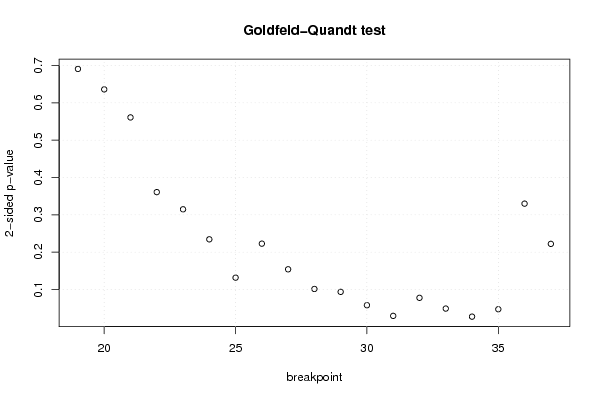
| Goldfeld-Quandt test for Heteroskedasticity | |||
| p-values | Alternative Hypothesis | ||
| breakpoint index | greater | 2-sided | less |
| 19 | 0.345422435171195 | 0.690844870342390 | 0.654577564828805 |
| 20 | 0.318058610880222 | 0.636117221760443 | 0.681941389119778 |
| 21 | 0.280487093650065 | 0.56097418730013 | 0.719512906349935 |
| 22 | 0.180415426058229 | 0.360830852116459 | 0.81958457394177 |
| 23 | 0.157399121994516 | 0.314798243989033 | 0.842600878005484 |
| 24 | 0.117171324631485 | 0.234342649262971 | 0.882828675368515 |
| 25 | 0.0658103896412949 | 0.131620779282590 | 0.934189610358705 |
| 26 | 0.111376283301400 | 0.222752566602800 | 0.8886237166986 |
| 27 | 0.0770023651314189 | 0.154004730262838 | 0.922997634868581 |
| 28 | 0.0506952523331808 | 0.101390504666362 | 0.94930474766682 |
| 29 | 0.0467914308294259 | 0.0935828616588518 | 0.953208569170574 |
| 30 | 0.0289111608705276 | 0.0578223217410552 | 0.971088839129472 |
| 31 | 0.0146359654929023 | 0.0292719309858045 | 0.985364034507098 |
| 32 | 0.038786729145181 | 0.077573458290362 | 0.961213270854819 |
| 33 | 0.0244103636069287 | 0.0488207272138574 | 0.975589636393071 |
| 34 | 0.0135772309203753 | 0.0271544618407505 | 0.986422769079625 |
| 35 | 0.0235082557279765 | 0.0470165114559531 | 0.976491744272023 |
| 36 | 0.164965639496379 | 0.329931278992758 | 0.835034360503621 |
| 37 | 0.111101639792292 | 0.222203279584584 | 0.888898360207708 |
| Meta Analysis of Goldfeld-Quandt test for Heteroskedasticity | |||
| Description | # significant tests | % significant tests | OK/NOK |
| 1% type I error level | 0 | 0 | OK |
| 5% type I error level | 4 | 0.210526315789474 | NOK |
| 10% type I error level | 7 | 0.368421052631579 | NOK |