| Multiple Linear Regression - Estimated Regression Equation |
| Y[t] = + 266232.75 + 582.583333333325X[t] + e[t] |
| Multiple Linear Regression - Ordinary Least Squares | |||||
| Variable | Parameter | S.D. | T-STAT H0: parameter = 0 | 2-tail p-value | 1-tail p-value |
| (Intercept) | 266232.75 | 2616.953032 | 101.7339 | 0 | 0 |
| X | 582.583333333325 | 5851.684873 | 0.0996 | 0.921038 | 0.460519 |
| Multiple Linear Regression - Regression Statistics | |
| Multiple R | 0.0130715179340899 |
| R-squared | 0.000170864581101233 |
| Adjusted R-squared | -0.0170675687881900 |
| F-TEST (value) | 0.00991183928613908 |
| F-TEST (DF numerator) | 1 |
| F-TEST (DF denominator) | 58 |
| p-value | 0.921038382478863 |
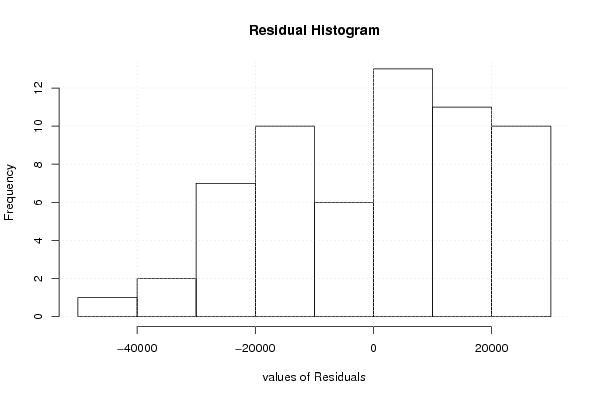
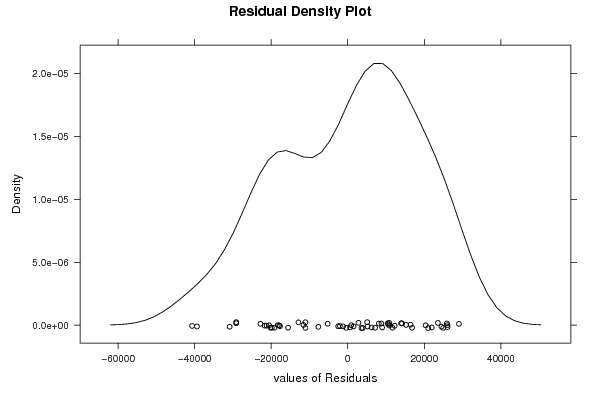
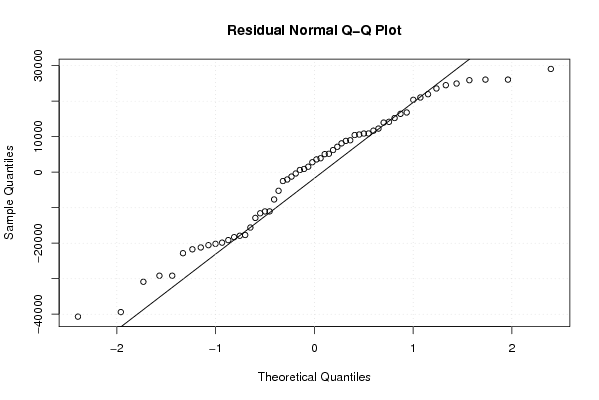
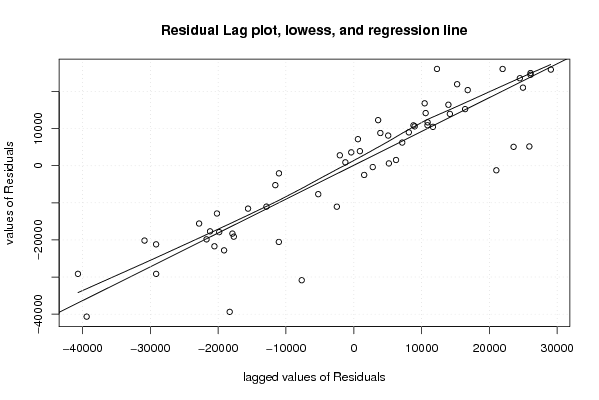
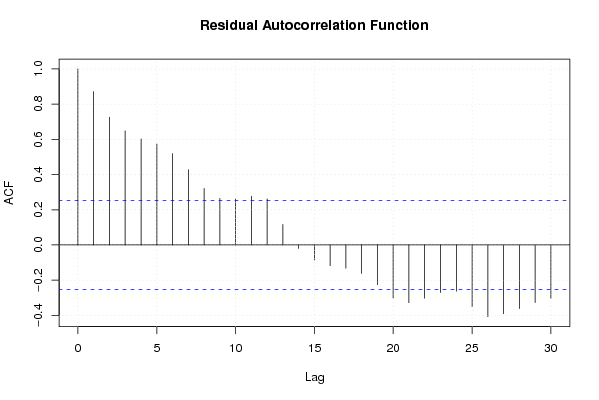
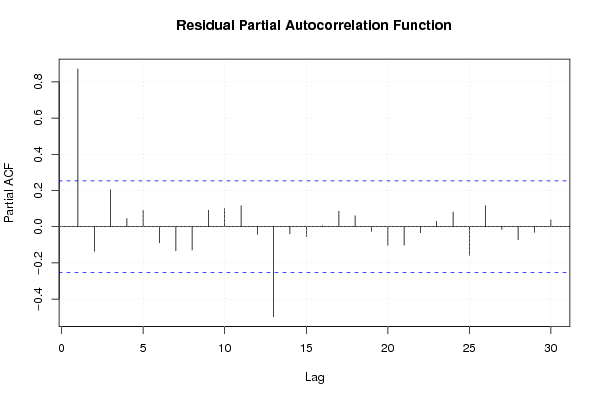
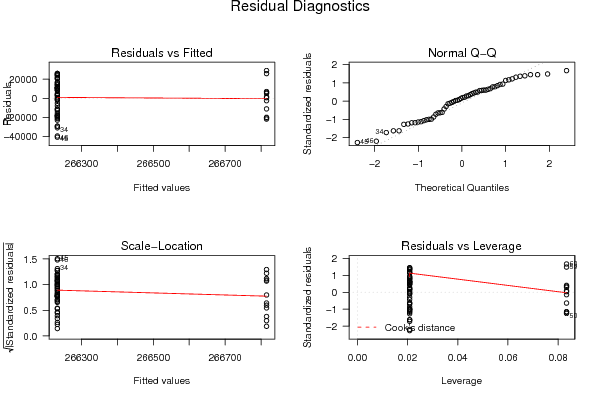
| Multiple Linear Regression - Residual Statistics | |
| Residual Standard Deviation | 18130.7824467722 |
| Sum Squared Residuals | 19066065783.6667 |
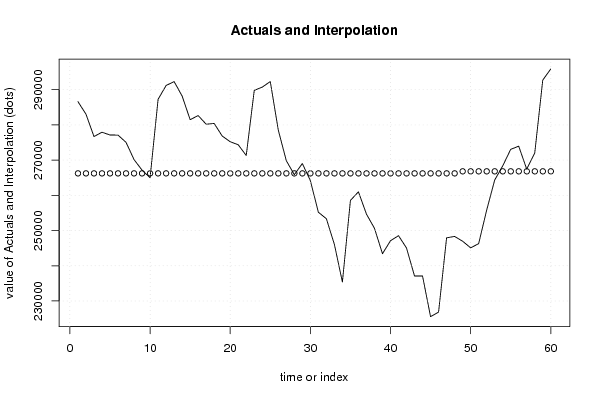
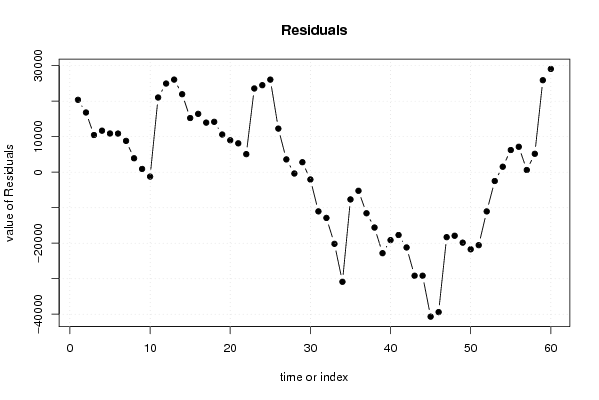
| Multiple Linear Regression - Actuals, Interpolation, and Residuals | |||
| Time or Index | Actuals | Interpolation Forecast | Residuals Prediction Error |
| 1 | 286602 | 266232.750000000 | 20369.2500000004 |
| 2 | 283042 | 266232.75 | 16809.25 |
| 3 | 276687 | 266232.75 | 10454.25 |
| 4 | 277915 | 266232.75 | 11682.25 |
| 5 | 277128 | 266232.75 | 10895.25 |
| 6 | 277103 | 266232.75 | 10870.25 |
| 7 | 275037 | 266232.75 | 8804.25 |
| 8 | 270150 | 266232.75 | 3917.24999999999 |
| 9 | 267140 | 266232.75 | 907.249999999992 |
| 10 | 264993 | 266232.75 | -1239.75000000001 |
| 11 | 287259 | 266232.75 | 21026.25 |
| 12 | 291186 | 266232.75 | 24953.25 |
| 13 | 292300 | 266232.75 | 26067.25 |
| 14 | 288186 | 266232.75 | 21953.25 |
| 15 | 281477 | 266232.75 | 15244.25 |
| 16 | 282656 | 266232.75 | 16423.25 |
| 17 | 280190 | 266232.75 | 13957.25 |
| 18 | 280408 | 266232.75 | 14175.25 |
| 19 | 276836 | 266232.75 | 10603.25 |
| 20 | 275216 | 266232.75 | 8983.25 |
| 21 | 274352 | 266232.75 | 8119.25 |
| 22 | 271311 | 266232.75 | 5078.24999999999 |
| 23 | 289802 | 266232.75 | 23569.25 |
| 24 | 290726 | 266232.75 | 24493.25 |
| 25 | 292300 | 266232.75 | 26067.25 |
| 26 | 278506 | 266232.75 | 12273.25 |
| 27 | 269826 | 266232.75 | 3593.24999999999 |
| 28 | 265861 | 266232.75 | -371.750000000008 |
| 29 | 269034 | 266232.75 | 2801.24999999999 |
| 30 | 264176 | 266232.75 | -2056.75000000001 |
| 31 | 255198 | 266232.75 | -11034.75 |
| 32 | 253353 | 266232.75 | -12879.75 |
| 33 | 246057 | 266232.75 | -20175.75 |
| 34 | 235372 | 266232.75 | -30860.75 |
| 35 | 258556 | 266232.75 | -7676.75 |
| 36 | 260993 | 266232.75 | -5239.75000000001 |
| 37 | 254663 | 266232.75 | -11569.75 |
| 38 | 250643 | 266232.75 | -15589.75 |
| 39 | 243422 | 266232.75 | -22810.75 |
| 40 | 247105 | 266232.75 | -19127.75 |
| 41 | 248541 | 266232.75 | -17691.75 |
| 42 | 245039 | 266232.75 | -21193.75 |
| 43 | 237080 | 266232.75 | -29152.75 |
| 44 | 237085 | 266232.75 | -29147.75 |
| 45 | 225554 | 266232.75 | -40678.75 |
| 46 | 226839 | 266232.75 | -39393.75 |
| 47 | 247934 | 266232.75 | -18298.75 |
| 48 | 248333 | 266232.75 | -17899.75 |
| 49 | 246969 | 266815.333333333 | -19846.3333333333 |
| 50 | 245098 | 266815.333333333 | -21717.3333333333 |
| 51 | 246263 | 266815.333333333 | -20552.3333333333 |
| 52 | 255765 | 266815.333333333 | -11050.3333333333 |
| 53 | 264319 | 266815.333333333 | -2496.33333333333 |
| 54 | 268347 | 266815.333333333 | 1531.66666666667 |
| 55 | 273046 | 266815.333333333 | 6230.66666666667 |
| 56 | 273963 | 266815.333333333 | 7147.66666666667 |
| 57 | 267430 | 266815.333333333 | 614.666666666668 |
| 58 | 271993 | 266815.333333333 | 5177.66666666667 |
| 59 | 292710 | 266815.333333333 | 25894.6666666667 |
| 60 | 295881 | 266815.333333333 | 29065.6666666667 |
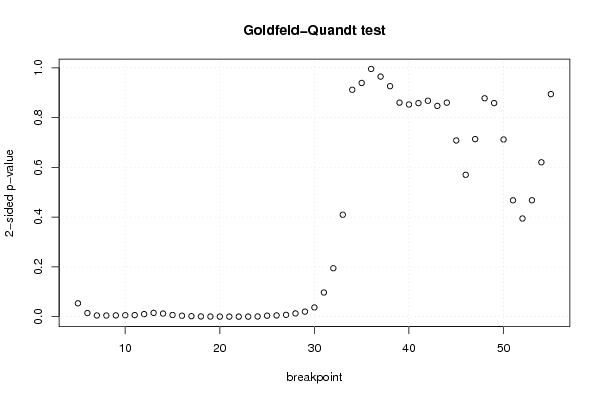
| Goldfeld-Quandt test for Heteroskedasticity | |||
| p-values | Alternative Hypothesis | ||
| breakpoint index | greater | 2-sided | less |
| 5 | 0.0268636797989692 | 0.0537273595979385 | 0.97313632020103 |
| 6 | 0.0072856343989968 | 0.0145712687979936 | 0.992714365601003 |
| 7 | 0.00249669077861382 | 0.00499338155722765 | 0.997503309221386 |
| 8 | 0.00227827485692729 | 0.00455654971385457 | 0.997721725143073 |
| 9 | 0.00261447622289175 | 0.0052289524457835 | 0.997385523777108 |
| 10 | 0.0029072966288041 | 0.0058145932576082 | 0.997092703371196 |
| 11 | 0.00313053848275274 | 0.00626107696550548 | 0.996869461517247 |
| 12 | 0.00514403982102575 | 0.0102880796420515 | 0.994855960178974 |
| 13 | 0.00762269107469671 | 0.0152453821493934 | 0.992377308925303 |
| 14 | 0.00625146213837943 | 0.0125029242767589 | 0.99374853786162 |
| 15 | 0.00336327271799783 | 0.00672654543599567 | 0.996636727282002 |
| 16 | 0.00190009021256220 | 0.00380018042512440 | 0.998099909787438 |
| 17 | 0.000997310756496163 | 0.00199462151299233 | 0.999002689243504 |
| 18 | 0.00053210483538169 | 0.00106420967076338 | 0.999467895164618 |
| 19 | 0.000283631118851084 | 0.000567262237702168 | 0.999716368881149 |
| 20 | 0.000159441400477832 | 0.000318882800955664 | 0.999840558599522 |
| 21 | 9.35829471347002e-05 | 0.000187165894269400 | 0.999906417052865 |
| 22 | 6.73070376131386e-05 | 0.000134614075226277 | 0.999932692962387 |
| 23 | 0.000142015683768027 | 0.000284031367536055 | 0.999857984316232 |
| 24 | 0.000410898240111605 | 0.00082179648022321 | 0.999589101759888 |
| 25 | 0.00201916592697714 | 0.00403833185395427 | 0.997980834073023 |
| 26 | 0.00252866503921871 | 0.00505733007843741 | 0.997471334960781 |
| 27 | 0.00365627685221632 | 0.00731255370443263 | 0.996343723147784 |
| 28 | 0.00651363244613518 | 0.0130272648922704 | 0.993486367553865 |
| 29 | 0.0101052178142287 | 0.0202104356284574 | 0.989894782185771 |
| 30 | 0.0185029351104796 | 0.0370058702209593 | 0.98149706488952 |
| 31 | 0.0485864753559896 | 0.0971729507119791 | 0.95141352464401 |
| 32 | 0.0973085037841553 | 0.194617007568311 | 0.902691496215845 |
| 33 | 0.204766937458545 | 0.409533874917091 | 0.795233062541455 |
| 34 | 0.455806426254125 | 0.91161285250825 | 0.544193573745875 |
| 35 | 0.469523241001475 | 0.93904648200295 | 0.530476758998525 |
| 36 | 0.497624859807746 | 0.995249719615492 | 0.502375140192254 |
| 37 | 0.517770293466604 | 0.964459413066791 | 0.482229706533396 |
| 38 | 0.537018352466459 | 0.925963295067082 | 0.462981647533541 |
| 39 | 0.570074499701558 | 0.859851000596884 | 0.429925500298442 |
| 40 | 0.573777583499874 | 0.852444833000251 | 0.426222416500126 |
| 41 | 0.57101959644601 | 0.857960807107979 | 0.428980403553989 |
| 42 | 0.566229923330903 | 0.867540153338195 | 0.433770076669097 |
| 43 | 0.576603404609444 | 0.846793190781112 | 0.423396595390556 |
| 44 | 0.570088862327838 | 0.859822275344324 | 0.429911137672162 |
| 45 | 0.646003140286486 | 0.707993719427029 | 0.353996859713514 |
| 46 | 0.715004605065213 | 0.569990789869574 | 0.284995394934787 |
| 47 | 0.643340273026858 | 0.713319453946283 | 0.356659726973142 |
| 48 | 0.561268046329986 | 0.877463907340028 | 0.438731953670014 |
| 49 | 0.570906208087578 | 0.858187583824845 | 0.429093791912423 |
| 50 | 0.644113165972442 | 0.711773668055116 | 0.355886834027558 |
| 51 | 0.766204842025012 | 0.467590315949977 | 0.233795157974988 |
| 52 | 0.80277441153467 | 0.394451176930662 | 0.197225588465331 |
| 53 | 0.766149709248902 | 0.467700581502195 | 0.233850290751098 |
| 54 | 0.689863052618623 | 0.620273894762753 | 0.310136947381377 |
| 55 | 0.552931724160543 | 0.894136551678914 | 0.447068275839457 |
| Meta Analysis of Goldfeld-Quandt test for Heteroskedasticity | |||
| Description | # significant tests | % significant tests | OK/NOK |
| 1% type I error level | 18 | 0.352941176470588 | NOK |
| 5% type I error level | 25 | 0.490196078431373 | NOK |
| 10% type I error level | 27 | 0.529411764705882 | NOK |