| Multiple Linear Regression - Estimated Regression Equation |
| Y[t] = + 47.6452791080674 -2.61492695465629X[t] + 0.168332065218935Y1[t] + 0.178485936109504Y2[t] + 0.407679280677300Y3[t] + 0.053273699457221Y4[t] -64.4595287059618M1[t] -37.304278203556M2[t] -12.7597221628184M3[t] + 1.64489339837566M4[t] -15.9606489351920M5[t] -13.1969103636244M6[t] -61.9077462099704M7[t] -42.7379786905838M8[t] -25.0967505219815M9[t] -12.9261758561011M10[t] -9.07613292450198M11[t] + 0.205736207577392t + e[t] |
| Multiple Linear Regression - Ordinary Least Squares | |||||
| Variable | Parameter | S.D. | T-STAT H0: parameter = 0 | 2-tail p-value | 1-tail p-value |
| (Intercept) | 47.6452791080674 | 24.115344 | 1.9757 | 0.055292 | 0.027646 |
| X | -2.61492695465629 | 3.341649 | -0.7825 | 0.438631 | 0.219316 |
| Y1 | 0.168332065218935 | 0.164445 | 1.0236 | 0.312314 | 0.156157 |
| Y2 | 0.178485936109504 | 0.159587 | 1.1184 | 0.270227 | 0.135114 |
| Y3 | 0.407679280677300 | 0.173984 | 2.3432 | 0.024313 | 0.012156 |
| Y4 | 0.053273699457221 | 0.181553 | 0.2934 | 0.770747 | 0.385373 |
| M1 | -64.4595287059618 | 5.429632 | -11.8718 | 0 | 0 |
| M2 | -37.304278203556 | 10.939564 | -3.41 | 0.001523 | 0.000762 |
| M3 | -12.7597221628184 | 10.602045 | -1.2035 | 0.236032 | 0.118016 |
| M4 | 1.64489339837566 | 10.57292 | 0.1556 | 0.87717 | 0.438585 |
| M5 | -15.9606489351920 | 7.051891 | -2.2633 | 0.029259 | 0.014629 |
| M6 | -13.1969103636244 | 5.498351 | -2.4002 | 0.02126 | 0.01063 |
| M7 | -61.9077462099704 | 6.504014 | -9.5184 | 0 | 0 |
| M8 | -42.7379786905838 | 10.687725 | -3.9988 | 0.000275 | 0.000137 |
| M9 | -25.0967505219815 | 9.772276 | -2.5682 | 0.014169 | 0.007084 |
| M10 | -12.9261758561011 | 9.377625 | -1.3784 | 0.175934 | 0.087967 |
| M11 | -9.07613292450198 | 5.466635 | -1.6603 | 0.104879 | 0.05244 |
| t | 0.205736207577392 | 0.27365 | 0.7518 | 0.456671 | 0.228335 |
| Multiple Linear Regression - Regression Statistics | |
| Multiple R | 0.976124683817898 |
| R-squared | 0.95281939835859 |
| Adjusted R-squared | 0.932253495079002 |
| F-TEST (value) | 46.3300534581549 |
| F-TEST (DF numerator) | 17 |
| F-TEST (DF denominator) | 39 |
| p-value | 0 |
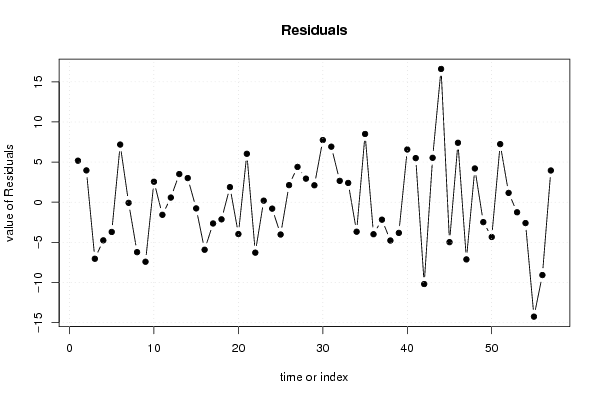
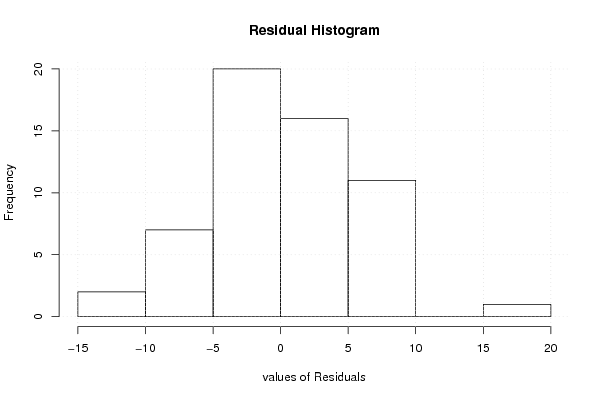
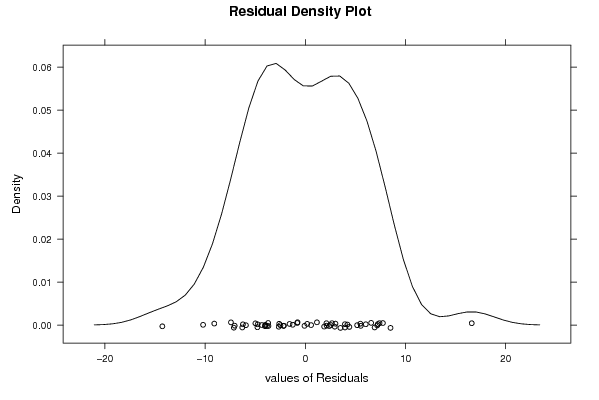
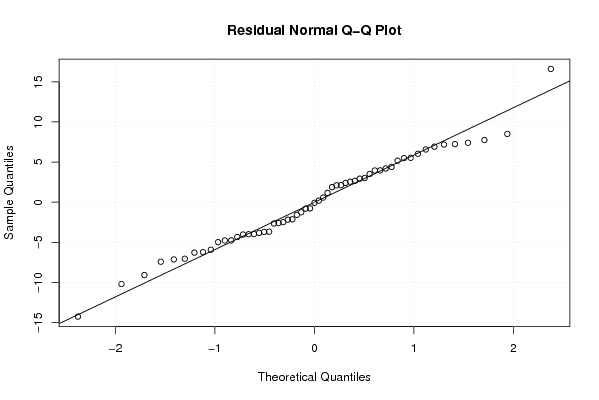
| Multiple Linear Regression - Residual Statistics | |
| Residual Standard Deviation | 6.76798289851965 |
| Sum Squared Residuals | 1786.41810807153 |
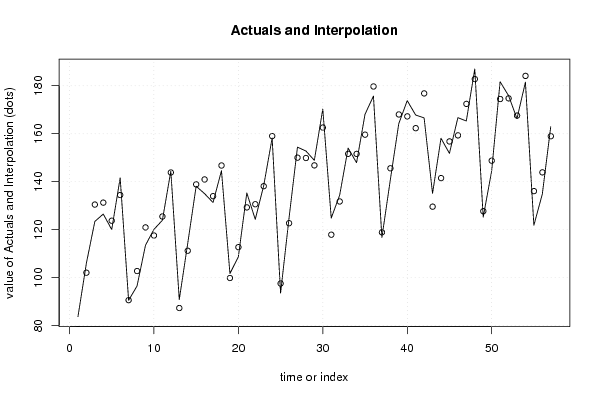
| Multiple Linear Regression - Actuals, Interpolation, and Residuals | |||
| Time or Index | Actuals | Interpolation Forecast | Residuals Prediction Error |
| 1 | 83.7 | 78.524777452074 | 5.17522254792598 |
| 2 | 106 | 102.033091708755 | 3.96690829124484 |
| 3 | 123.4 | 130.44630438448 | -7.04630438448 |
| 4 | 126.5 | 131.252692880435 | -4.75269288043451 |
| 5 | 120 | 123.705494373234 | -3.70549437323354 |
| 6 | 141.6 | 134.415740112076 | 7.184259887924 |
| 7 | 90.5 | 90.57722263798 | -0.077222637979992 |
| 8 | 96.5 | 102.721487196137 | -6.2214871961366 |
| 9 | 113.5 | 120.917406044592 | -7.41740604459194 |
| 10 | 120.1 | 117.544578309095 | 2.55542169090537 |
| 11 | 123.9 | 125.469399634377 | -1.56939963437743 |
| 12 | 144.4 | 143.819127760869 | 0.580872239131105 |
| 13 | 90.8 | 87.2907252999318 | 3.50927470006823 |
| 14 | 114.2 | 111.188862687416 | 3.01113731258373 |
| 15 | 138.1 | 138.871144398207 | -0.771144398206966 |
| 16 | 135 | 140.921704825243 | -5.92170482524313 |
| 17 | 131.3 | 133.950108047033 | -2.65010804703304 |
| 18 | 144.6 | 146.733587158415 | -2.13358715841498 |
| 19 | 101.7 | 99.816341670381 | 1.883658329619 |
| 20 | 108.7 | 112.670700942886 | -3.97070094288573 |
| 21 | 135.3 | 129.263964861517 | 6.03603513848342 |
| 22 | 124.3 | 130.586409284289 | -6.28640928428948 |
| 23 | 138.3 | 138.106574864597 | 0.193425135403223 |
| 24 | 158.2 | 158.998932374753 | -0.798932374753439 |
| 25 | 93.5 | 97.5263593978706 | -4.02635939787064 |
| 26 | 124.8 | 122.669630852221 | 2.13036914777932 |
| 27 | 154.4 | 149.999326153483 | 4.40067384651726 |
| 28 | 152.8 | 149.862214012340 | 2.93778598766044 |
| 29 | 148.9 | 146.789813421158 | 2.11018657884242 |
| 30 | 170.3 | 162.551989149233 | 7.74801085076738 |
| 31 | 124.8 | 117.877715210172 | 6.92228478982777 |
| 32 | 134.4 | 131.738521888645 | 2.66147811135491 |
| 33 | 154 | 151.596933176555 | 2.40306682344484 |
| 34 | 147.9 | 151.576667412523 | -3.67666741252271 |
| 35 | 168.1 | 159.593713070808 | 8.50628692919152 |
| 36 | 175.7 | 179.689067126107 | -3.98906712610677 |
| 37 | 116.7 | 118.877335130028 | -2.17733513002824 |
| 38 | 140.8 | 145.573375009519 | -4.77337500951892 |
| 39 | 164.2 | 168.024291061333 | -3.82429106133284 |
| 40 | 173.8 | 167.226926772381 | 6.5730732276194 |
| 41 | 167.8 | 162.301601773801 | 5.49839822619864 |
| 42 | 166.6 | 176.798140473052 | -10.1981404730519 |
| 43 | 135.1 | 129.565525446508 | 5.53447455349176 |
| 44 | 158.1 | 141.48973782647 | 16.6102621735300 |
| 45 | 151.8 | 156.777175381680 | -4.97717538167963 |
| 46 | 166.7 | 159.292344994093 | 7.40765500590683 |
| 47 | 165.3 | 172.430312430217 | -7.13031243021731 |
| 48 | 187 | 182.792872738271 | 4.20712726172911 |
| 49 | 125.2 | 127.680802720095 | -2.48080272009532 |
| 50 | 144.4 | 148.735039742089 | -4.33503974208898 |
| 51 | 181.7 | 174.458934002497 | 7.24106599750255 |
| 52 | 175.9 | 174.736461509602 | 1.16353849039780 |
| 53 | 166.3 | 167.552982384775 | -1.25298238477449 |
| 54 | 181.5 | 184.100543107225 | -2.60054310722453 |
| 55 | 121.8 | 136.063195034959 | -14.2631950349585 |
| 56 | 134.8 | 143.879552145863 | -9.07955214586262 |
| 57 | 162.9 | 158.944520535657 | 3.95547946434331 |
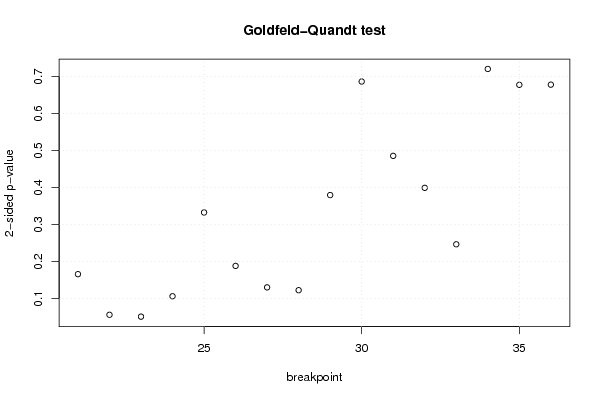
| Goldfeld-Quandt test for Heteroskedasticity | |||
| p-values | Alternative Hypothesis | ||
| breakpoint index | greater | 2-sided | less |
| 21 | 0.0830376652643334 | 0.166075330528667 | 0.916962334735667 |
| 22 | 0.0281955021571149 | 0.0563910043142298 | 0.971804497842885 |
| 23 | 0.0256652877513923 | 0.0513305755027847 | 0.974334712248608 |
| 24 | 0.05320779521483 | 0.10641559042966 | 0.94679220478517 |
| 25 | 0.166316999647596 | 0.332633999295193 | 0.833683000352404 |
| 26 | 0.0941801390643515 | 0.188360278128703 | 0.905819860935648 |
| 27 | 0.0651917857959028 | 0.130383571591806 | 0.934808214204097 |
| 28 | 0.0613962689480755 | 0.122792537896151 | 0.938603731051925 |
| 29 | 0.189826371762835 | 0.379652743525669 | 0.810173628237165 |
| 30 | 0.343100602378543 | 0.686201204757085 | 0.656899397621457 |
| 31 | 0.242760433070904 | 0.485520866141809 | 0.757239566929096 |
| 32 | 0.199550484303713 | 0.399100968607426 | 0.800449515696287 |
| 33 | 0.123361700531559 | 0.246723401063117 | 0.876638299468441 |
| 34 | 0.360078664405100 | 0.720157328810199 | 0.6399213355949 |
| 35 | 0.338622327168357 | 0.677244654336714 | 0.661377672831643 |
| 36 | 0.338848769057837 | 0.677697538115675 | 0.661151230942163 |
| Meta Analysis of Goldfeld-Quandt test for Heteroskedasticity | |||
| Description | # significant tests | % significant tests | OK/NOK |
| 1% type I error level | 0 | 0 | OK |
| 5% type I error level | 0 | 0 | OK |
| 10% type I error level | 2 | 0.125 | NOK |