| Multiple Linear Regression - Estimated Regression Equation |
| tot.ind.prod.index[t] = + 97.0651490600515 + 0.0381800024164384prijsindex.grondst.incl.energie[t] + e[t] |
| Multiple Linear Regression - Ordinary Least Squares | |||||
| Variable | Parameter | S.D. | T-STAT H0: parameter = 0 | 2-tail p-value | 1-tail p-value |
| (Intercept) | 97.0651490600515 | 3.509877 | 27.6549 | 0 | 0 |
| prijsindex.grondst.incl.energie | 0.0381800024164384 | 0.015644 | 2.4405 | 0.017689 | 0.008845 |
| Multiple Linear Regression - Regression Statistics | |
| Multiple R | 0.302807907985026 |
| R-squared | 0.091692629138268 |
| Adjusted R-squared | 0.0762975889541708 |
| F-TEST (value) | 5.95598504724821 |
| F-TEST (DF numerator) | 1 |
| F-TEST (DF denominator) | 59 |
| p-value | 0.0176891166963650 |
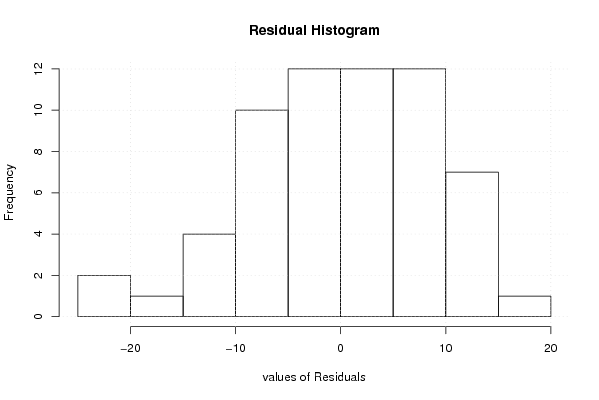
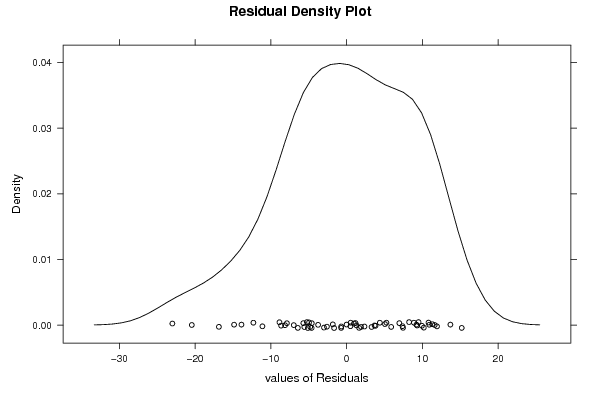
| Multiple Linear Regression - Residual Statistics | |
| Residual Standard Deviation | 8.75875544910125 |
| Sum Squared Residuals | 4526.23202401249 |
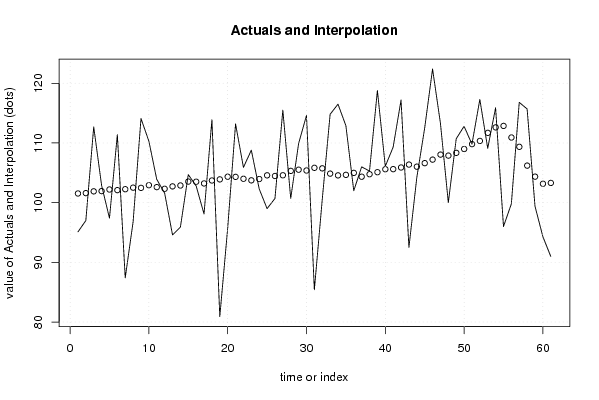
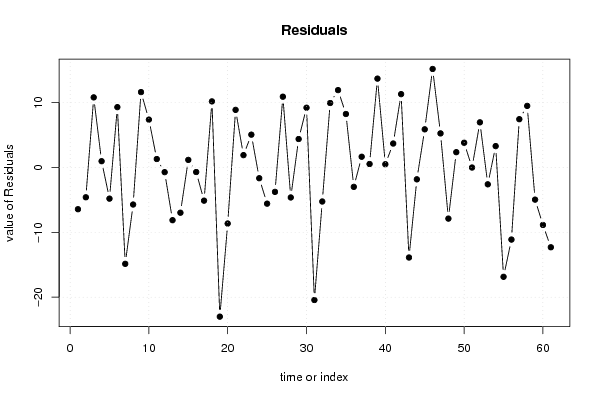
| Multiple Linear Regression - Actuals, Interpolation, and Residuals | |||
| Time or Index | Actuals | Interpolation Forecast | Residuals Prediction Error |
| 1 | 95.1 | 101.536027343016 | -6.43602734301649 |
| 2 | 97 | 101.597115346883 | -4.59711534688277 |
| 3 | 112.7 | 101.894919365731 | 10.805080634269 |
| 4 | 102.9 | 101.933099368147 | 0.966900631852572 |
| 5 | 97.4 | 102.204177385304 | -4.80417738530414 |
| 6 | 111.4 | 102.097273378538 | 9.30272662146189 |
| 7 | 87.4 | 102.253811388446 | -14.8538113884455 |
| 8 | 96.8 | 102.513435404877 | -5.7134354048773 |
| 9 | 114.1 | 102.475255402461 | 11.6247445975391 |
| 10 | 110.3 | 102.921961430733 | 7.37803856926681 |
| 11 | 103.9 | 102.601249410435 | 1.2987505895649 |
| 12 | 101.6 | 102.322535392795 | -0.72253539279511 |
| 13 | 94.6 | 102.727243418409 | -8.12724341840936 |
| 14 | 95.9 | 102.876145427833 | -6.97614542783346 |
| 15 | 104.7 | 103.532841469396 | 1.16715853060380 |
| 16 | 102.8 | 103.502297467463 | -0.702297467463053 |
| 17 | 98.1 | 103.215947449340 | -5.11594744933977 |
| 18 | 113.9 | 103.712287480753 | 10.1877125192465 |
| 19 | 80.9 | 103.899369492594 | -22.999369492594 |
| 20 | 95.7 | 104.342257520625 | -8.6422575206247 |
| 21 | 113.2 | 104.319349519175 | 8.88065048082517 |
| 22 | 105.9 | 103.998637498877 | 1.90136250112326 |
| 23 | 108.8 | 103.739013482445 | 5.06098651755503 |
| 24 | 102.3 | 103.956639496219 | -1.65663949621867 |
| 25 | 99 | 104.578973535607 | -5.57897353560661 |
| 26 | 100.7 | 104.464433528357 | -3.76443352835729 |
| 27 | 115.5 | 104.58660953609 | 10.9133904639101 |
| 28 | 100.7 | 105.323483582727 | -4.62348358272716 |
| 29 | 109.9 | 105.518201595051 | 4.38179840494901 |
| 30 | 114.6 | 105.384571586593 | 9.21542841340653 |
| 31 | 85.4 | 105.835095615107 | -20.4350956151074 |
| 32 | 100.5 | 105.747281609550 | -5.24728160954963 |
| 33 | 114.8 | 104.861505553488 | 9.93849444651174 |
| 34 | 116.5 | 104.571337535123 | 11.9286624648767 |
| 35 | 112.9 | 104.655333540439 | 8.24466645956052 |
| 36 | 102 | 104.987499561462 | -2.9874995614625 |
| 37 | 106 | 104.346075520866 | 1.65392447913366 |
| 38 | 105.3 | 104.762237547206 | 0.537762452794481 |
| 39 | 118.8 | 105.102039568712 | 13.6979604312882 |
| 40 | 106.1 | 105.598379600126 | 0.501620399874478 |
| 41 | 109.3 | 105.609833600850 | 3.69016639914955 |
| 42 | 117.2 | 105.892365618732 | 11.3076343812679 |
| 43 | 92.5 | 106.381069649663 | -13.8810696496625 |
| 44 | 104.2 | 106.025995627190 | -1.82599562718962 |
| 45 | 112.5 | 106.617785664644 | 5.88221433535558 |
| 46 | 122.4 | 107.209575702099 | 15.1904242979008 |
| 47 | 113.3 | 108.045717755019 | 5.25428224498078 |
| 48 | 100 | 107.881543744629 | -7.88154374462853 |
| 49 | 110.7 | 108.343521773867 | 2.35647822613257 |
| 50 | 112.8 | 108.988763814705 | 3.81123618529475 |
| 51 | 109.8 | 109.809633866659 | -0.00963386665867005 |
| 52 | 117.3 | 110.340335900247 | 6.95966409975284 |
| 53 | 109.1 | 111.695725986031 | -2.59572598603073 |
| 54 | 115.9 | 112.608228043784 | 3.29177195621641 |
| 55 | 96 | 112.856398059490 | -16.8563980594904 |
| 56 | 99.8 | 110.913035936494 | -11.1130359364937 |
| 57 | 116.8 | 109.355291837903 | 7.44470816209695 |
| 58 | 115.7 | 106.205441638547 | 9.49455836145312 |
| 59 | 99.4 | 104.357529521591 | -4.95752952159126 |
| 60 | 94.3 | 103.162495445957 | -8.86249544595675 |
| 61 | 91 | 103.303761454898 | -12.3037614548976 |
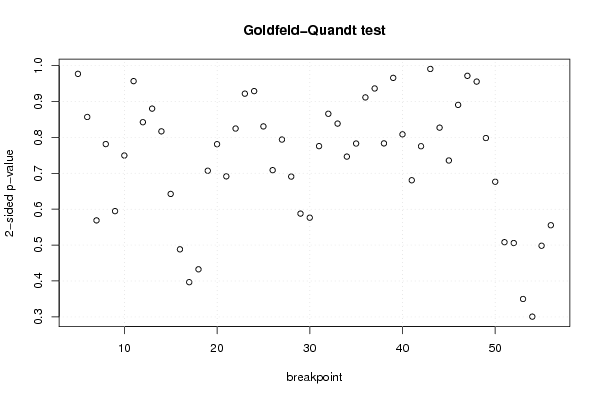
| Goldfeld-Quandt test for Heteroskedasticity | |||
| p-values | Alternative Hypothesis | ||
| breakpoint index | greater | 2-sided | less |
| 5 | 0.48852038055793 | 0.97704076111586 | 0.51147961944207 |
| 6 | 0.428458910274713 | 0.856917820549426 | 0.571541089725287 |
| 7 | 0.71557030272188 | 0.56885939455624 | 0.28442969727812 |
| 8 | 0.609286736705344 | 0.781426526589311 | 0.390713263294656 |
| 9 | 0.70266326295086 | 0.59467347409828 | 0.29733673704914 |
| 10 | 0.625207867714216 | 0.749584264571568 | 0.374792132285784 |
| 11 | 0.521607312123254 | 0.956785375753493 | 0.478392687876746 |
| 12 | 0.421190775049421 | 0.842381550098842 | 0.578809224950579 |
| 13 | 0.440110285932732 | 0.880220571865464 | 0.559889714067268 |
| 14 | 0.408454249576488 | 0.816908499152976 | 0.591545750423512 |
| 15 | 0.321280151393456 | 0.642560302786911 | 0.678719848606544 |
| 16 | 0.244119043610301 | 0.488238087220602 | 0.755880956389699 |
| 17 | 0.198337163713323 | 0.396674327426646 | 0.801662836286677 |
| 18 | 0.216273555822111 | 0.432547111644221 | 0.78372644417789 |
| 19 | 0.646423846269238 | 0.707152307461524 | 0.353576153730762 |
| 20 | 0.609420193752477 | 0.781159612495047 | 0.390579806247523 |
| 21 | 0.65424185088829 | 0.69151629822342 | 0.34575814911171 |
| 22 | 0.587654158742085 | 0.82469168251583 | 0.412345841257915 |
| 23 | 0.539067037226234 | 0.921865925547532 | 0.460932962773766 |
| 24 | 0.464522837943202 | 0.929045675886404 | 0.535477162056798 |
| 25 | 0.415326426731082 | 0.830652853462164 | 0.584673573268918 |
| 26 | 0.354391153321591 | 0.708782306643182 | 0.64560884667841 |
| 27 | 0.397008316296813 | 0.794016632593626 | 0.602991683703187 |
| 28 | 0.345435367254843 | 0.690870734509686 | 0.654564632745157 |
| 29 | 0.293850043565377 | 0.587700087130755 | 0.706149956434623 |
| 30 | 0.288189512860958 | 0.576379025721917 | 0.711810487139042 |
| 31 | 0.612133271886826 | 0.775733456226348 | 0.387866728113174 |
| 32 | 0.567073623823013 | 0.865852752353973 | 0.432926376176987 |
| 33 | 0.58076415191958 | 0.83847169616084 | 0.41923584808042 |
| 34 | 0.626739926317229 | 0.746520147365542 | 0.373260073682771 |
| 35 | 0.608536122972555 | 0.78292775405489 | 0.391463877027445 |
| 36 | 0.544258707418428 | 0.911482585163144 | 0.455741292581572 |
| 37 | 0.468184108557091 | 0.936368217114181 | 0.531815891442909 |
| 38 | 0.391673603726995 | 0.783347207453991 | 0.608326396273005 |
| 39 | 0.482937244043709 | 0.965874488087417 | 0.517062755956291 |
| 40 | 0.404306075572635 | 0.80861215114527 | 0.595693924427365 |
| 41 | 0.340321362029421 | 0.680642724058842 | 0.659678637970579 |
| 42 | 0.387717356944843 | 0.775434713889685 | 0.612282643055157 |
| 43 | 0.49536785703022 | 0.99073571406044 | 0.50463214296978 |
| 44 | 0.413600009961027 | 0.827200019922053 | 0.586399990038973 |
| 45 | 0.367850711102947 | 0.735701422205894 | 0.632149288897053 |
| 46 | 0.554732145437648 | 0.890535709124704 | 0.445267854562352 |
| 47 | 0.514210114887598 | 0.971579770224804 | 0.485789885112402 |
| 48 | 0.477761851449873 | 0.955523702899746 | 0.522238148550127 |
| 49 | 0.399128694765867 | 0.798257389531733 | 0.600871305234133 |
| 50 | 0.3382228611141 | 0.6764457222282 | 0.6617771388859 |
| 51 | 0.254036744574418 | 0.508073489148835 | 0.745963255425582 |
| 52 | 0.252887259762176 | 0.505774519524352 | 0.747112740237824 |
| 53 | 0.174935562141397 | 0.349871124282795 | 0.825064437858603 |
| 54 | 0.150318755398436 | 0.300637510796873 | 0.849681244601564 |
| 55 | 0.249077853181075 | 0.498155706362151 | 0.750922146818925 |
| 56 | 0.722328815731794 | 0.555342368536411 | 0.277671184268206 |
| Meta Analysis of Goldfeld-Quandt test for Heteroskedasticity | |||
| Description | # significant tests | % significant tests | OK/NOK |
| 1% type I error level | 0 | 0 | OK |
| 5% type I error level | 0 | 0 | OK |
| 10% type I error level | 0 | 0 | OK |