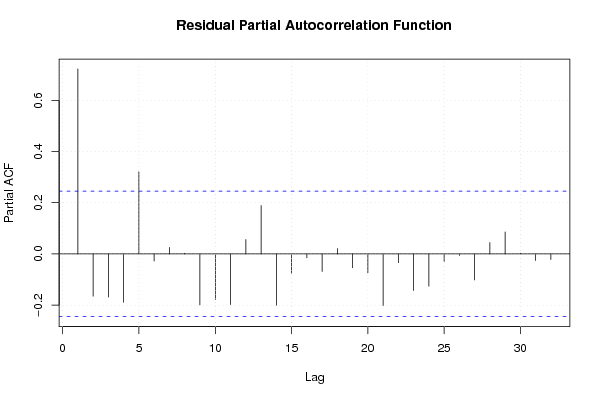
| Multiple Linear Regression - Estimated Regression Equation |
| bbp[t] = -1.10070696468018 + 1.31713480216938dnst[t] + 0.204745979954158M1[t] + 0.452084793437836M2[t] + 0.799849627608484M3[t] + 0.952090115257092M4[t] + 1.09514885838966M5[t] + 1.01898393026522M6[t] + 0.902307777316414M7[t] + 0.91003049667132M8[t] + 0.853865568546879M9[t] + 0.836728728552598M10[t] + 0.330794143950892M11[t] -0.0111496797887823t + e[t] |
| Multiple Linear Regression - Ordinary Least Squares | |||||
| Variable | Parameter | S.D. | T-STAT H0: parameter = 0 | 2-tail p-value | 1-tail p-value |
| (Intercept) | -1.10070696468018 | 0.410339 | -2.6824 | 0.00988 | 0.00494 |
| dnst | 1.31713480216938 | 0.082683 | 15.9299 | 0 | 0 |
| M1 | 0.204745979954158 | 0.447859 | 0.4572 | 0.649532 | 0.324766 |
| M2 | 0.452084793437836 | 0.447994 | 1.0091 | 0.317771 | 0.158885 |
| M3 | 0.799849627608484 | 0.451394 | 1.772 | 0.082496 | 0.041248 |
| M4 | 0.952090115257092 | 0.459715 | 2.071 | 0.043536 | 0.021768 |
| M5 | 1.09514885838966 | 0.469221 | 2.334 | 0.023657 | 0.011828 |
| M6 | 1.01898393026522 | 0.469145 | 2.172 | 0.034624 | 0.017312 |
| M7 | 0.902307777316414 | 0.467722 | 1.9292 | 0.059397 | 0.029699 |
| M8 | 0.91003049667132 | 0.467551 | 1.9464 | 0.05724 | 0.02862 |
| M9 | 0.853865568546879 | 0.467292 | 1.8273 | 0.073631 | 0.036816 |
| M10 | 0.836728728552598 | 0.467132 | 1.7912 | 0.079314 | 0.039657 |
| M11 | 0.330794143950892 | 0.467163 | 0.7081 | 0.482177 | 0.241088 |
| t | -0.0111496797887823 | 0.005094 | -2.1886 | 0.033325 | 0.016663 |
| Multiple Linear Regression - Regression Statistics | |
| Multiple R | 0.922286268476566 |
| R-squared | 0.850611961020428 |
| Adjusted R-squared | 0.811771070885739 |
| F-TEST (value) | 21.8999090409811 |
| F-TEST (DF numerator) | 13 |
| F-TEST (DF denominator) | 50 |
| p-value | 3.33066907387547e-16 |
| Multiple Linear Regression - Residual Statistics | |
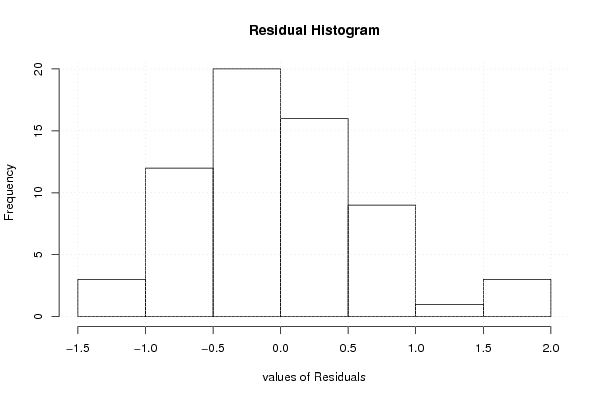
| Residual Standard Deviation | 0.738411089186721 |
| Sum Squared Residuals | 27.262546831696 |
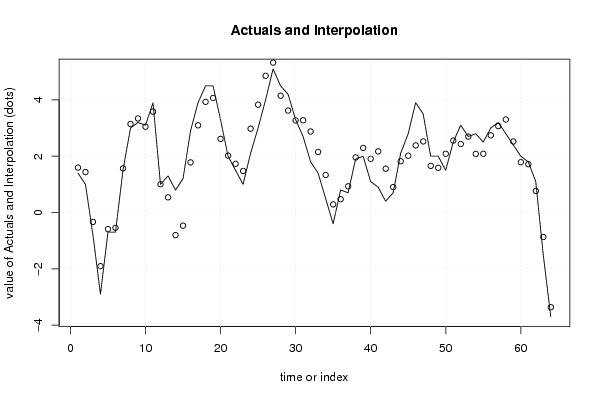
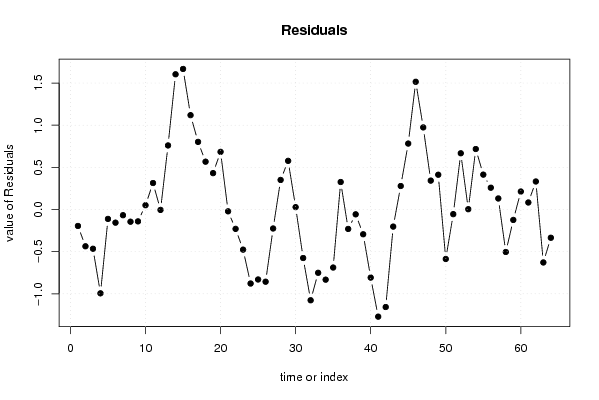
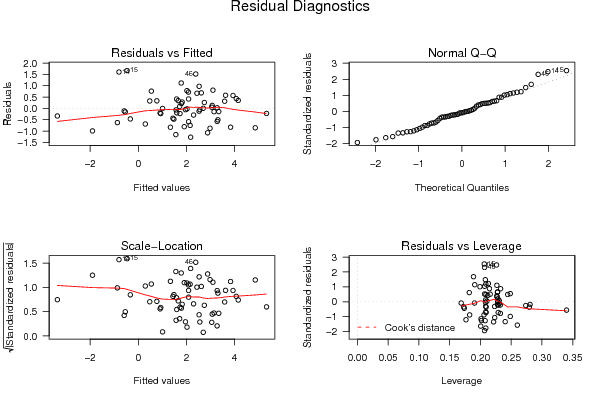
| Multiple Linear Regression - Actuals, Interpolation, and Residuals | |||
| Time or Index | Actuals | Interpolation Forecast | Residuals Prediction Error |
| 1 | 1.4 | 1.59544545960700 | -0.195445459606998 |
| 2 | 1 | 1.43649415265109 | -0.436494152651087 |
| 3 | -0.8 | -0.334306376438048 | -0.465693623561952 |
| 4 | -2.9 | -1.90549081139842 | -0.994509188601583 |
| 5 | -0.7 | -0.588160426102185 | -0.111839573897815 |
| 6 | -0.7 | -0.543761553798471 | -0.156238446201528 |
| 7 | 1.5 | 1.56754177715188 | -0.0675417771518839 |
| 8 | 3 | 3.14467657932126 | -0.144676579321264 |
| 9 | 3.2 | 3.34078893184191 | -0.140788931841914 |
| 10 | 3.1 | 3.04907545162498 | 0.050924548375023 |
| 11 | 3.9 | 3.58569902896999 | 0.314300971030007 |
| 12 | 1 | 1.00462604154237 | -0.00462604154237274 |
| 13 | 1.3 | 0.539654940623058 | 0.760345059376942 |
| 14 | 0.8 | -0.8047176882853 | 1.6047176882853 |
| 15 | 1.2 | -0.468102533903436 | 1.66810253390344 |
| 16 | 2.9 | 1.78040395742740 | 1.11959604257260 |
| 17 | 3.9 | 3.09773434272363 | 0.802265657276371 |
| 18 | 4.5 | 3.93241409632897 | 0.567585903671031 |
| 19 | 4.5 | 4.06801522402526 | 0.431984775974744 |
| 20 | 3.3 | 2.61573998120506 | 0.684260018794938 |
| 21 | 2 | 2.02157145242409 | -0.0215714524240858 |
| 22 | 1.5 | 1.72985797220715 | -0.229857972207147 |
| 23 | 1 | 1.47620066825053 | -0.476200668250535 |
| 24 | 2.1 | 2.97824556754799 | -0.878245567547992 |
| 25 | 3 | 3.83040926879806 | -0.830409268798058 |
| 26 | 4 | 4.85687928379458 | -0.856879283794581 |
| 27 | 5.1 | 5.32520791839339 | -0.225207918393386 |
| 28 | 4.5 | 4.14916392408383 | 0.350836075916170 |
| 29 | 4.2 | 3.62250558634293 | 0.57749441365707 |
| 30 | 3.3 | 3.27176401799583 | 0.028235982004171 |
| 31 | 2.7 | 3.27565166547518 | -0.575651665475178 |
| 32 | 1.8 | 2.87708426439049 | -1.07708426439049 |
| 33 | 1.4 | 2.15120225539257 | -0.751202255392574 |
| 34 | 0.5 | 1.33263485430788 | -0.832634854307884 |
| 35 | -0.4 | 0.288696669049643 | -0.688696669049643 |
| 36 | 0.8 | 0.473606766177721 | 0.326393233822279 |
| 37 | 0.7 | 0.930630026776972 | -0.230630026776973 |
| 38 | 1.9 | 1.95710004177350 | -0.0571000417734953 |
| 39 | 2 | 2.29371519615536 | -0.293715196155361 |
| 40 | 1.1 | 1.90795208314744 | -0.807952083147435 |
| 41 | 0.9 | 2.17157462670816 | -1.27157462670816 |
| 42 | 0.4 | 1.55740609792719 | -1.15740609792719 |
| 43 | 0.7 | 0.902726344321845 | -0.202726344321845 |
| 44 | 2.1 | 1.82129374540653 | 0.278706254593466 |
| 45 | 2.8 | 2.01740609792719 | 0.782593902072813 |
| 46 | 3.9 | 2.38426001879494 | 1.51573998120506 |
| 47 | 3.5 | 2.52574315548914 | 0.974256844510861 |
| 48 | 2 | 1.65694541088171 | 0.343054589118287 |
| 49 | 2 | 1.58711475061321 | 0.412885249386788 |
| 50 | 1.5 | 2.08673084474198 | -0.586730844741984 |
| 51 | 2.5 | 2.55505947934079 | -0.055059479340788 |
| 52 | 3.1 | 2.43272332676674 | 0.667276673233263 |
| 53 | 2.7 | 2.69634587032746 | 0.00365412967253531 |
| 54 | 2.8 | 2.08217734154649 | 0.717822658453512 |
| 55 | 2.5 | 2.08606498902584 | 0.413935010974163 |
| 56 | 3 | 2.74120542967665 | 0.258794570323349 |
| 57 | 3.2 | 3.06903126241424 | 0.130968737585760 |
| 58 | 2.8 | 3.30417170306505 | -0.504171703065054 |
| 59 | 2.4 | 2.52366047824069 | -0.123660478240689 |
| 60 | 2 | 1.7865762138502 | 0.213423786149799 |
| 61 | 1.8 | 1.7167455535817 | 0.0832544464182992 |
| 62 | 1.1 | 0.767513365324154 | 0.332486634675846 |
| 63 | -1.5 | -0.87157368354805 | -0.62842631645195 |
| 64 | -3.7 | -3.36475248002698 | -0.335247519973016 |
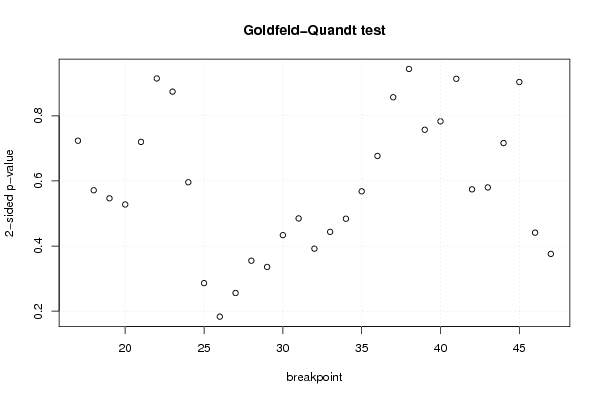
| Goldfeld-Quandt test for Heteroskedasticity | |||
| p-values | Alternative Hypothesis | ||
| breakpoint index | greater | 2-sided | less |
| 17 | 0.361778604722714 | 0.723557209445428 | 0.638221395277286 |
| 18 | 0.285727540300273 | 0.571455080600546 | 0.714272459699727 |
| 19 | 0.273381116781944 | 0.546762233563888 | 0.726618883218056 |
| 20 | 0.263930544448386 | 0.527861088896771 | 0.736069455551614 |
| 21 | 0.359969253531991 | 0.719938507063981 | 0.64003074646801 |
| 22 | 0.45737737678008 | 0.91475475356016 | 0.54262262321992 |
| 23 | 0.562862822328686 | 0.874274355342629 | 0.437137177671314 |
| 24 | 0.702002194456123 | 0.595995611087754 | 0.297997805543877 |
| 25 | 0.856850669898064 | 0.286298660203871 | 0.143149330101936 |
| 26 | 0.908319217840426 | 0.183361564319148 | 0.0916807821595738 |
| 27 | 0.871996988738605 | 0.256006022522789 | 0.128003011261395 |
| 28 | 0.822419157965617 | 0.355161684068766 | 0.177580842034383 |
| 29 | 0.832002292242125 | 0.335995415515749 | 0.167997707757875 |
| 30 | 0.78316045879127 | 0.433679082417458 | 0.216839541208729 |
| 31 | 0.757515131230083 | 0.484969737539835 | 0.242484868769917 |
| 32 | 0.803943518803675 | 0.39211296239265 | 0.196056481196325 |
| 33 | 0.778135308543413 | 0.443729382913175 | 0.221864691456587 |
| 34 | 0.75800780598237 | 0.483984388035261 | 0.241992194017630 |
| 35 | 0.715889147060883 | 0.568221705878235 | 0.284110852939117 |
| 36 | 0.66156731462742 | 0.67686537074516 | 0.33843268537258 |
| 37 | 0.571496155379766 | 0.857007689240469 | 0.428503844620234 |
| 38 | 0.471960635842272 | 0.943921271684545 | 0.528039364157728 |
| 39 | 0.378579746596305 | 0.757159493192609 | 0.621420253403695 |
| 40 | 0.391543020634462 | 0.783086041268923 | 0.608456979365538 |
| 41 | 0.456839482854875 | 0.91367896570975 | 0.543160517145125 |
| 42 | 0.712848347316911 | 0.574303305366178 | 0.287151652683089 |
| 43 | 0.709919813255307 | 0.580160373489386 | 0.290080186744693 |
| 44 | 0.641819843573847 | 0.716360312852306 | 0.358180156426153 |
| 45 | 0.548090970165839 | 0.903818059668322 | 0.451909029834161 |
| 46 | 0.77934330369942 | 0.441313392601161 | 0.220656696300581 |
| 47 | 0.811963730826638 | 0.376072538346724 | 0.188036269173362 |
| Meta Analysis of Goldfeld-Quandt test for Heteroskedasticity | |||
| Description | # significant tests | % significant tests | OK/NOK |
| 1% type I error level | 0 | 0 | OK |
| 5% type I error level | 0 | 0 | OK |
| 10% type I error level | 0 | 0 | OK |