| Multiple Linear Regression - Estimated Regression Equation |
| Y[t] = + 2.70950552586520 + 0.835106106989052X[t] + e[t] |
| Multiple Linear Regression - Ordinary Least Squares | |||||
| Variable | Parameter | S.D. | T-STAT H0: parameter = 0 | 2-tail p-value | 1-tail p-value |
| (Intercept) | 2.70950552586520 | 1.111025 | 2.4387 | 0.017821 | 0.00891 |
| X | 0.835106106989052 | 0.154242 | 5.4143 | 1e-06 | 1e-06 |
| Multiple Linear Regression - Regression Statistics | |
| Multiple R | 0.579423898585697 |
| R-squared | 0.335732054252248 |
| Adjusted R-squared | 0.324279158635908 |
| F-TEST (value) | 29.3141634656339 |
| F-TEST (DF numerator) | 1 |
| F-TEST (DF denominator) | 58 |
| p-value | 1.2302241262363e-06 |
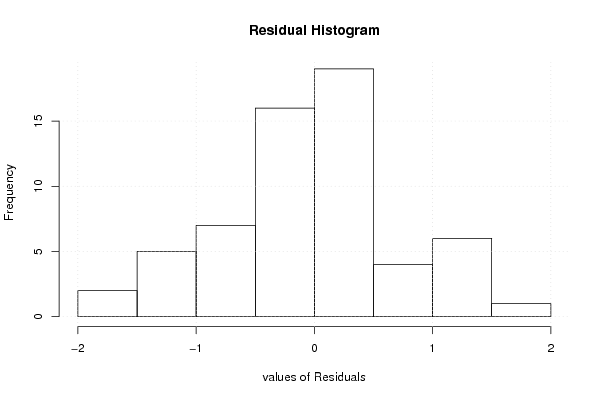
| Multiple Linear Regression - Residual Statistics | |
| Residual Standard Deviation | 0.78189229948904 |
| Sum Squared Residuals | 35.458622944015 |
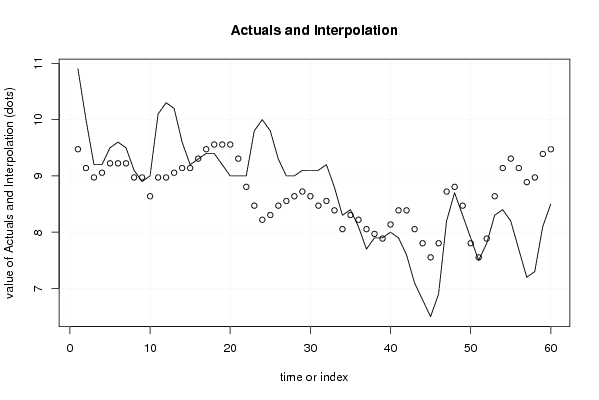
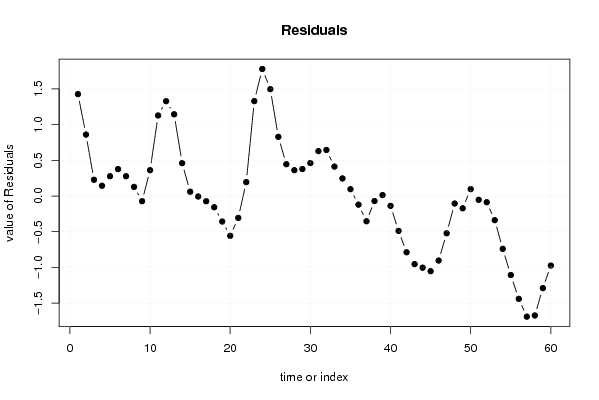
| Multiple Linear Regression - Actuals, Interpolation, and Residuals | |||
| Time or Index | Actuals | Interpolation Forecast | Residuals Prediction Error |
| 1 | 10.9 | 9.47386499247651 | 1.42613500752349 |
| 2 | 10 | 9.1398225496809 | 0.860177450319103 |
| 3 | 9.2 | 8.9728013282831 | 0.227198671716909 |
| 4 | 9.2 | 9.056311938982 | 0.143688061018004 |
| 5 | 9.5 | 9.2233331603798 | 0.276666839620194 |
| 6 | 9.6 | 9.2233331603798 | 0.376666839620194 |
| 7 | 9.5 | 9.2233331603798 | 0.276666839620194 |
| 8 | 9.1 | 8.9728013282831 | 0.127198671716909 |
| 9 | 8.9 | 8.9728013282831 | -0.0728013282830901 |
| 10 | 9 | 8.63875888548747 | 0.361241114512530 |
| 11 | 10.1 | 8.9728013282831 | 1.12719867171691 |
| 12 | 10.3 | 8.9728013282831 | 1.32719867171691 |
| 13 | 10.2 | 9.056311938982 | 1.14368806101800 |
| 14 | 9.6 | 9.1398225496809 | 0.460177450319099 |
| 15 | 9.2 | 9.1398225496809 | 0.0601774503190984 |
| 16 | 9.3 | 9.30684377107871 | -0.00684377107871056 |
| 17 | 9.4 | 9.47386499247652 | -0.0738649924765206 |
| 18 | 9.4 | 9.55737560317543 | -0.157375603175426 |
| 19 | 9.2 | 9.55737560317543 | -0.357375603175427 |
| 20 | 9 | 9.55737560317543 | -0.557375603175426 |
| 21 | 9 | 9.30684377107871 | -0.306843771078711 |
| 22 | 9 | 8.80578010688528 | 0.19421989311472 |
| 23 | 9.8 | 8.47173766408966 | 1.32826233591034 |
| 24 | 10 | 8.22120583199294 | 1.77879416800706 |
| 25 | 9.8 | 8.30471644269185 | 1.49528355730815 |
| 26 | 9.3 | 8.47173766408966 | 0.82826233591034 |
| 27 | 9 | 8.55524827478856 | 0.444751725211435 |
| 28 | 9 | 8.63875888548747 | 0.361241114512530 |
| 29 | 9.1 | 8.72226949618637 | 0.377730503813624 |
| 30 | 9.1 | 8.63875888548747 | 0.46124111451253 |
| 31 | 9.1 | 8.47173766408966 | 0.62826233591034 |
| 32 | 9.2 | 8.55524827478856 | 0.644751725211434 |
| 33 | 8.8 | 8.38822705339075 | 0.411772946609246 |
| 34 | 8.3 | 8.05418461059513 | 0.245815389404866 |
| 35 | 8.4 | 8.30471644269185 | 0.095283557308151 |
| 36 | 8.1 | 8.22120583199294 | -0.121205831992944 |
| 37 | 7.7 | 8.05418461059513 | -0.354184610595134 |
| 38 | 7.9 | 7.97067399989623 | -0.0706739998962283 |
| 39 | 7.9 | 7.88716338919732 | 0.0128366108026765 |
| 40 | 8 | 8.13769522129404 | -0.137695221294039 |
| 41 | 7.9 | 8.38822705339075 | -0.488227053390754 |
| 42 | 7.6 | 8.38822705339075 | -0.788227053390755 |
| 43 | 7.1 | 8.05418461059513 | -0.954184610595134 |
| 44 | 6.8 | 7.80365277849842 | -1.00365277849842 |
| 45 | 6.5 | 7.5531209464017 | -1.05312094640170 |
| 46 | 6.9 | 7.80365277849842 | -0.903652778498418 |
| 47 | 8.2 | 8.72226949618637 | -0.522269496186376 |
| 48 | 8.7 | 8.80578010688528 | -0.105780106885281 |
| 49 | 8.3 | 8.47173766408966 | -0.171737664089659 |
| 50 | 7.9 | 7.80365277849842 | 0.0963472215015821 |
| 51 | 7.5 | 7.5531209464017 | -0.0531209464017029 |
| 52 | 7.8 | 7.88716338919732 | -0.087163389197324 |
| 53 | 8.3 | 8.63875888548747 | -0.338758885487469 |
| 54 | 8.4 | 9.1398225496809 | -0.7398225496809 |
| 55 | 8.2 | 9.30684377107871 | -1.10684377107871 |
| 56 | 7.7 | 9.1398225496809 | -1.4398225496809 |
| 57 | 7.2 | 8.88929071758418 | -1.68929071758419 |
| 58 | 7.3 | 8.9728013282831 | -1.67280132828309 |
| 59 | 8.1 | 9.39035438177762 | -1.29035438177762 |
| 60 | 8.5 | 9.47386499247652 | -0.973864992476521 |
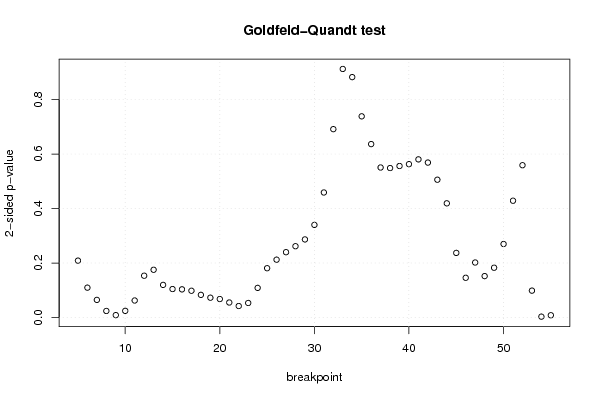
| Goldfeld-Quandt test for Heteroskedasticity | |||
| p-values | Alternative Hypothesis | ||
| breakpoint index | greater | 2-sided | less |
| 5 | 0.104453868982327 | 0.208907737964653 | 0.895546131017674 |
| 6 | 0.0548345934899461 | 0.109669186979892 | 0.945165406510054 |
| 7 | 0.0323977796641757 | 0.0647955593283514 | 0.967602220335824 |
| 8 | 0.0120958623795675 | 0.0241917247591351 | 0.987904137620432 |
| 9 | 0.00442328104088511 | 0.00884656208177023 | 0.995576718959115 |
| 10 | 0.0122910969844129 | 0.0245821939688257 | 0.987708903015587 |
| 11 | 0.0312676415579527 | 0.0625352831159054 | 0.968732358442047 |
| 12 | 0.0767267249632572 | 0.153453449926514 | 0.923273275036743 |
| 13 | 0.0876632881889357 | 0.175326576377871 | 0.912336711811064 |
| 14 | 0.0598821975986328 | 0.119764395197266 | 0.940117802401367 |
| 15 | 0.0522854030560193 | 0.104570806112039 | 0.94771459694398 |
| 16 | 0.0517373693149608 | 0.103474738629922 | 0.94826263068504 |
| 17 | 0.049172188253989 | 0.098344376507978 | 0.95082781174601 |
| 18 | 0.0416156659527625 | 0.083231331905525 | 0.958384334047238 |
| 19 | 0.0364391453270226 | 0.0728782906540453 | 0.963560854672977 |
| 20 | 0.0339880883602210 | 0.0679761767204421 | 0.96601191163978 |
| 21 | 0.0276073531653358 | 0.0552147063306716 | 0.972392646834664 |
| 22 | 0.0211224962790403 | 0.0422449925580806 | 0.97887750372096 |
| 23 | 0.0267074959602235 | 0.0534149919204469 | 0.973292504039777 |
| 24 | 0.0544330453003503 | 0.108866090600701 | 0.94556695469965 |
| 25 | 0.0905072289922121 | 0.181014457984424 | 0.909492771007788 |
| 26 | 0.106162089882550 | 0.212324179765101 | 0.89383791011745 |
| 27 | 0.119971439440128 | 0.239942878880255 | 0.880028560559872 |
| 28 | 0.130899041217287 | 0.261798082434575 | 0.869100958782713 |
| 29 | 0.143357981814524 | 0.286715963629048 | 0.856642018185476 |
| 30 | 0.170040151414001 | 0.340080302828003 | 0.829959848585999 |
| 31 | 0.229494056295517 | 0.458988112591034 | 0.770505943704483 |
| 32 | 0.345706127101862 | 0.691412254203724 | 0.654293872898138 |
| 33 | 0.456183345363332 | 0.912366690726663 | 0.543816654636668 |
| 34 | 0.558792485265538 | 0.882415029468925 | 0.441207514734462 |
| 35 | 0.630737703160812 | 0.738524593678377 | 0.369262296839188 |
| 36 | 0.68169315636134 | 0.636613687277321 | 0.318306843638661 |
| 37 | 0.724673824909788 | 0.550652350180425 | 0.275326175090212 |
| 38 | 0.72567215141497 | 0.54865569717006 | 0.27432784858503 |
| 39 | 0.721926149710535 | 0.556147700578929 | 0.278073850289465 |
| 40 | 0.718505186659742 | 0.562989626680516 | 0.281494813340258 |
| 41 | 0.70973101726039 | 0.580537965479219 | 0.290268982739609 |
| 42 | 0.715625377659837 | 0.568749244680326 | 0.284374622340163 |
| 43 | 0.747078426913322 | 0.505843146173356 | 0.252921573086678 |
| 44 | 0.790403559376853 | 0.419192881246294 | 0.209596440623147 |
| 45 | 0.881377309649361 | 0.237245380701277 | 0.118622690350639 |
| 46 | 0.927048471758179 | 0.145903056483643 | 0.0729515282418215 |
| 47 | 0.89901315567151 | 0.201973688656981 | 0.100986844328491 |
| 48 | 0.923941148084055 | 0.152117703831891 | 0.0760588519159453 |
| 49 | 0.908580492500835 | 0.18283901499833 | 0.091419507499165 |
| 50 | 0.865036882287067 | 0.269926235425865 | 0.134963117712933 |
| 51 | 0.785618631104973 | 0.428762737790054 | 0.214381368895027 |
| 52 | 0.720473585687382 | 0.559052828625237 | 0.279526414312618 |
| 53 | 0.95060924996371 | 0.098781500072578 | 0.049390750036289 |
| 54 | 0.998363194940028 | 0.00327361011994483 | 0.00163680505997241 |
| 55 | 0.99578547144192 | 0.00842905711615963 | 0.00421452855807982 |
| Meta Analysis of Goldfeld-Quandt test for Heteroskedasticity | |||
| Description | # significant tests | % significant tests | OK/NOK |
| 1% type I error level | 3 | 0.0588235294117647 | NOK |
| 5% type I error level | 6 | 0.117647058823529 | NOK |
| 10% type I error level | 15 | 0.294117647058824 | NOK |