Free Statistics

of Irreproducible Research!

Author's title

Author*The author of this computation has been verified*
R Software Modulerwasp_multipleregression.wasp
Title produced by softwareMultiple Regression
Date of computationThu, 19 Nov 2009 08:37:48 -0700
Cite this page as followsStatistical Computations at FreeStatistics.org, Office for Research Development and Education, URL https://freestatistics.org/blog/index.php?v=date/2009/Nov/19/t12586452750biw7e2jvkqptav.htm/, Retrieved Wed, 24 Apr 2024 02:31:16 +0000
Statistical Computations at FreeStatistics.org, Office for Research Development and Education, URL https://freestatistics.org/blog/index.php?pk=57769, Retrieved Wed, 24 Apr 2024 02:31:16 +0000
QR Codes:

Original text written by user:Multiple lineair regression software (1)
IsPrivate?No (this computation is public)
User-defined keywords
Estimated Impact148
Family? (F = Feedback message, R = changed R code, M = changed R Module, P = changed Parameters, D = changed Data)
-     [Multiple Regression] [Q1 The Seatbeltlaw] [2007-11-14 19:27:43] [8cd6641b921d30ebe00b648d1481bba0]
- RMPD  [Multiple Regression] [Seatbelt] [2009-11-12 13:54:52] [b98453cac15ba1066b407e146608df68]
-    D      [Multiple Regression] [shw7: Multiple li...] [2009-11-19 15:37:48] [7a39e26d7a09dd77604df90cb29f8d39] [Current]
Feedback Forum

Post a new message
Dataseries X:
0.7461	0.527
0.7775	0.472
0.7790	0
0.7744	0.052
0.7905	0.313
0.7719	0.364
0.7811	0.363
0.7557	-0.155
0.7637	0.052
0.7595	0.568
0.7471	0.668
0.7615	1.378
0.7487	0.252
0.7389	-0.402
0.7337	-0.05
0.7510	0.555
0.7382	0.05
0.7159	0.15
0.7542	0.45
0.7636	0.299
0.7433	0.199
0.7658	0.496
0.7627	0.444
0.7480	-0.393
0.7692	-0.444
0.7850	0.198
0.7913	0.494
0.7720	0.133
0.7880	0.388
0.8070	0.484
0.8268	0.278
0.8244	0.369
0.8487	0.165
0.8572	0.155
0.8214	0.087
0.8827	0.414
0.9216	0.36
0.8865	0.975
0.8816	0.27
0.8884	0.359
0.9466	0.169
0.9180	0.381
0.9337	0.154
0.9559	0.486
0.9626	0.925
0.9434	0.728
0.8639	-0.014
0.7996	0.046
0.6680	-0.819
0.6572	-1.674
0.6928	-0.788
0.6438	0.279
0.6454	0.396
0.6873	-0.141
0.7265	-0.019
0.7912	0.099
0.8114	0.742
0.8281	0.005
0.8393	0.448


Summary of computational transaction
Raw Inputview raw input (R code)
Raw Outputview raw output of R engine
Computing time3 seconds
R Server'Gwilym Jenkins' @ 72.249.127.135

\begin{tabular}{lllllllll}
\hline
Summary of computational transaction \tabularnewline
Raw Input & view raw input (R code)  \tabularnewline
Raw Output & view raw output of R engine  \tabularnewline
Computing time & 3 seconds \tabularnewline
R Server & 'Gwilym Jenkins' @ 72.249.127.135 \tabularnewline
\hline
\end{tabular}
%Source: https://freestatistics.org/blog/index.php?pk=57769&T=0

[TABLE]
[ROW][C]Summary of computational transaction[/C][/ROW]
[ROW][C]Raw Input[/C][C]view raw input (R code) [/C][/ROW]
[ROW][C]Raw Output[/C][C]view raw output of R engine [/C][/ROW]
[ROW][C]Computing time[/C][C]3 seconds[/C][/ROW]
[ROW][C]R Server[/C][C]'Gwilym Jenkins' @ 72.249.127.135[/C][/ROW]
[/TABLE]
Source: https://freestatistics.org/blog/index.php?pk=57769&T=0

Globally Unique Identifier (entire table): ba.freestatistics.org/blog/index.php?pk=57769&T=0

As an alternative you can also use a QR Code:  

The GUIDs for individual cells are displayed in the table below:

Summary of computational transaction
Raw Inputview raw input (R code)
Raw Outputview raw output of R engine
Computing time3 seconds
R Server'Gwilym Jenkins' @ 72.249.127.135


Multiple Linear Regression - Estimated Regression Equation
USDOLLAR[t] = + 0.778012058274589 + 0.0734527913500218AMERIKAANSE_INFLATIE[t] + e[t]

\begin{tabular}{lllllllll}
\hline
Multiple Linear Regression - Estimated Regression Equation \tabularnewline
USDOLLAR[t] =  +  0.778012058274589 +  0.0734527913500218AMERIKAANSE_INFLATIE[t]  + e[t] \tabularnewline
\hline
\end{tabular}
%Source: https://freestatistics.org/blog/index.php?pk=57769&T=1

[TABLE]
[ROW][C]Multiple Linear Regression - Estimated Regression Equation[/C][/ROW]
[ROW][C]USDOLLAR[t] =  +  0.778012058274589 +  0.0734527913500218AMERIKAANSE_INFLATIE[t]  + e[t][/C][/ROW]
[/TABLE]
Source: https://freestatistics.org/blog/index.php?pk=57769&T=1

Globally Unique Identifier (entire table): ba.freestatistics.org/blog/index.php?pk=57769&T=1

As an alternative you can also use a QR Code:  

The GUIDs for individual cells are displayed in the table below:

Multiple Linear Regression - Estimated Regression Equation
USDOLLAR[t] = + 0.778012058274589 + 0.0734527913500218AMERIKAANSE_INFLATIE[t] + e[t]


Multiple Linear Regression - Ordinary Least Squares
VariableParameterS.D.T-STATH0: parameter = 02-tail p-value1-tail p-value
(Intercept)0.7780120582745890.01021976.134100
AMERIKAANSE_INFLATIE0.07345279135002180.020553.57440.0007230.000362

\begin{tabular}{lllllllll}
\hline
Multiple Linear Regression - Ordinary Least Squares \tabularnewline
Variable & Parameter & S.D. & T-STATH0: parameter = 0 & 2-tail p-value & 1-tail p-value \tabularnewline
(Intercept) & 0.778012058274589 & 0.010219 & 76.1341 & 0 & 0 \tabularnewline
AMERIKAANSE_INFLATIE & 0.0734527913500218 & 0.02055 & 3.5744 & 0.000723 & 0.000362 \tabularnewline
\hline
\end{tabular}
%Source: https://freestatistics.org/blog/index.php?pk=57769&T=2

[TABLE]
[ROW][C]Multiple Linear Regression - Ordinary Least Squares[/C][/ROW]
[ROW][C]Variable[/C][C]Parameter[/C][C]S.D.[/C][C]T-STATH0: parameter = 0[/C][C]2-tail p-value[/C][C]1-tail p-value[/C][/ROW]
[ROW][C](Intercept)[/C][C]0.778012058274589[/C][C]0.010219[/C][C]76.1341[/C][C]0[/C][C]0[/C][/ROW]
[ROW][C]AMERIKAANSE_INFLATIE[/C][C]0.0734527913500218[/C][C]0.02055[/C][C]3.5744[/C][C]0.000723[/C][C]0.000362[/C][/ROW]
[/TABLE]
Source: https://freestatistics.org/blog/index.php?pk=57769&T=2

Globally Unique Identifier (entire table): ba.freestatistics.org/blog/index.php?pk=57769&T=2

As an alternative you can also use a QR Code:  

The GUIDs for individual cells are displayed in the table below:

Multiple Linear Regression - Ordinary Least Squares
VariableParameterS.D.T-STATH0: parameter = 02-tail p-value1-tail p-value
(Intercept)0.7780120582745890.01021976.134100
AMERIKAANSE_INFLATIE0.07345279135002180.020553.57440.0007230.000362


Multiple Linear Regression - Regression Statistics
Multiple R0.42790305973798
R-squared0.183101028533125
Adjusted R-squared0.168769467630197
F-TEST (value)12.7760702252412
F-TEST (DF numerator)1
F-TEST (DF denominator)57
p-value0.000723181931649775
Multiple Linear Regression - Residual Statistics
Residual Standard Deviation0.0707069736074677
Sum Squared Residuals0.284970138653447

\begin{tabular}{lllllllll}
\hline
Multiple Linear Regression - Regression Statistics \tabularnewline
Multiple R & 0.42790305973798 \tabularnewline
R-squared & 0.183101028533125 \tabularnewline
Adjusted R-squared & 0.168769467630197 \tabularnewline
F-TEST (value) & 12.7760702252412 \tabularnewline
F-TEST (DF numerator) & 1 \tabularnewline
F-TEST (DF denominator) & 57 \tabularnewline
p-value & 0.000723181931649775 \tabularnewline
Multiple Linear Regression - Residual Statistics \tabularnewline
Residual Standard Deviation & 0.0707069736074677 \tabularnewline
Sum Squared Residuals & 0.284970138653447 \tabularnewline
\hline
\end{tabular}
%Source: https://freestatistics.org/blog/index.php?pk=57769&T=3

[TABLE]
[ROW][C]Multiple Linear Regression - Regression Statistics[/C][/ROW]
[ROW][C]Multiple R[/C][C]0.42790305973798[/C][/ROW]
[ROW][C]R-squared[/C][C]0.183101028533125[/C][/ROW]
[ROW][C]Adjusted R-squared[/C][C]0.168769467630197[/C][/ROW]
[ROW][C]F-TEST (value)[/C][C]12.7760702252412[/C][/ROW]
[ROW][C]F-TEST (DF numerator)[/C][C]1[/C][/ROW]
[ROW][C]F-TEST (DF denominator)[/C][C]57[/C][/ROW]
[ROW][C]p-value[/C][C]0.000723181931649775[/C][/ROW]
[ROW][C]Multiple Linear Regression - Residual Statistics[/C][/ROW]
[ROW][C]Residual Standard Deviation[/C][C]0.0707069736074677[/C][/ROW]
[ROW][C]Sum Squared Residuals[/C][C]0.284970138653447[/C][/ROW]
[/TABLE]
Source: https://freestatistics.org/blog/index.php?pk=57769&T=3

Globally Unique Identifier (entire table): ba.freestatistics.org/blog/index.php?pk=57769&T=3

As an alternative you can also use a QR Code:  

The GUIDs for individual cells are displayed in the table below:

Multiple Linear Regression - Regression Statistics
Multiple R0.42790305973798
R-squared0.183101028533125
Adjusted R-squared0.168769467630197
F-TEST (value)12.7760702252412
F-TEST (DF numerator)1
F-TEST (DF denominator)57
p-value0.000723181931649775
Multiple Linear Regression - Residual Statistics
Residual Standard Deviation0.0707069736074677
Sum Squared Residuals0.284970138653447


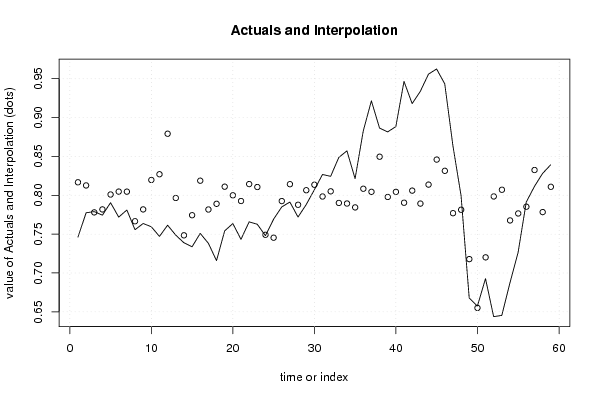
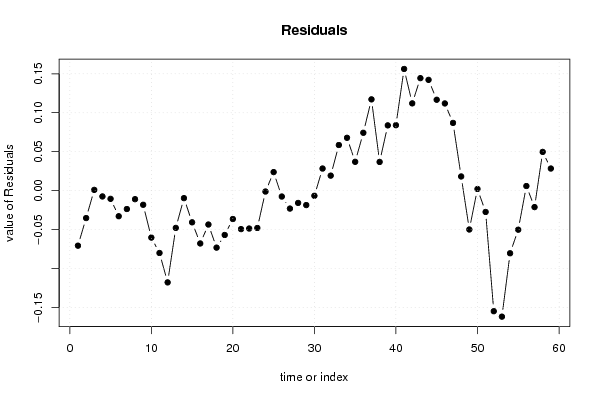
Multiple Linear Regression - Actuals, Interpolation, and Residuals
Time or IndexActualsInterpolationForecastResidualsPrediction Error
10.74610.816721679316048-0.0706216793160478
20.77750.812681775791799-0.0351817757917988
30.7790.7780120582745890.000987941725411454
40.77440.78183160342479-0.00743160342478972
50.79050.801002781967145-0.0105027819671454
60.77190.804748874325997-0.0328488743259965
70.78110.804675421534646-0.0235754215346464
80.75570.766626875615335-0.0109268756153352
90.76370.78183160342479-0.0181316034247897
100.75950.8197332437614-0.060233243761401
110.74710.827078522896403-0.079978522896403
120.76150.879230004754919-0.117730004754919
130.74870.796522161694794-0.047822161694794
140.73890.74848403615188-0.00958403615187983
150.73370.774339418707087-0.0406394187070875
160.7510.81877835747385-0.0677783574738506
170.73820.78168469784209-0.0434846978420897
180.71590.789029976977092-0.0731299769770919
190.75420.811065814382098-0.0568658143820984
200.76360.799974442888245-0.0363744428882451
210.74330.792629163753243-0.049329163753243
220.76580.8144446427842-0.0486446427841993
230.76270.810625097633998-0.0479250976339982
240.7480.74914511127403-0.00114511127403003
250.76920.7453990189151790.0238009810848211
260.7850.792555710961893-0.00755571096189284
270.79130.8142977372015-0.0229977372014993
280.7720.787781279524141-0.0157812795241414
290.7880.806511741318397-0.0185117413183970
300.8070.813563209287999-0.00656320928799903
310.82680.7984319342698950.0283680657301054
320.82440.8051161382827470.0192838617172534
330.84870.7901317688473420.0585682311526579
340.85720.7893972409338420.067802759066158
350.82140.784402451122040.0369975488779596
360.88270.8084215138934980.0742784861065025
370.92160.8044550631605960.117144936839404
380.88650.849628529840860.0368714701591402
390.88160.7978443119390940.0837556880609056
400.88840.8043816103692460.0840183896307536
410.94660.7904255800127420.156174419987258
420.9180.8059975717789470.112002428221053
430.93370.7893237881424920.144376211857508
440.95590.8137101148706990.142189885129301
450.96260.8459558902733590.116644109726641
460.94340.8314856903774040.111914309622596
470.86390.7769837191956880.0869162808043117
480.79960.781390886676690.0182091133233104
490.6680.717854222158921-0.0498542221589208
500.65720.6550520855546520.00214791444534780
510.69280.720131258690771-0.0273312586907715
520.64380.798505387061245-0.154705387061245
530.64540.807099363649197-0.161699363649197
540.68730.767655214694235-0.0803552146942355
550.72650.776616455238938-0.0501164552389381
560.79120.785283884618240.00591611538175929
570.81140.832514029456305-0.0211140294563047
580.82810.7783793222313390.0497206777686613
590.83930.8109189087993980.0283810912006017

\begin{tabular}{lllllllll}
\hline
Multiple Linear Regression - Actuals, Interpolation, and Residuals \tabularnewline
Time or Index & Actuals & InterpolationForecast & ResidualsPrediction Error \tabularnewline
1 & 0.7461 & 0.816721679316048 & -0.0706216793160478 \tabularnewline
2 & 0.7775 & 0.812681775791799 & -0.0351817757917988 \tabularnewline
3 & 0.779 & 0.778012058274589 & 0.000987941725411454 \tabularnewline
4 & 0.7744 & 0.78183160342479 & -0.00743160342478972 \tabularnewline
5 & 0.7905 & 0.801002781967145 & -0.0105027819671454 \tabularnewline
6 & 0.7719 & 0.804748874325997 & -0.0328488743259965 \tabularnewline
7 & 0.7811 & 0.804675421534646 & -0.0235754215346464 \tabularnewline
8 & 0.7557 & 0.766626875615335 & -0.0109268756153352 \tabularnewline
9 & 0.7637 & 0.78183160342479 & -0.0181316034247897 \tabularnewline
10 & 0.7595 & 0.8197332437614 & -0.060233243761401 \tabularnewline
11 & 0.7471 & 0.827078522896403 & -0.079978522896403 \tabularnewline
12 & 0.7615 & 0.879230004754919 & -0.117730004754919 \tabularnewline
13 & 0.7487 & 0.796522161694794 & -0.047822161694794 \tabularnewline
14 & 0.7389 & 0.74848403615188 & -0.00958403615187983 \tabularnewline
15 & 0.7337 & 0.774339418707087 & -0.0406394187070875 \tabularnewline
16 & 0.751 & 0.81877835747385 & -0.0677783574738506 \tabularnewline
17 & 0.7382 & 0.78168469784209 & -0.0434846978420897 \tabularnewline
18 & 0.7159 & 0.789029976977092 & -0.0731299769770919 \tabularnewline
19 & 0.7542 & 0.811065814382098 & -0.0568658143820984 \tabularnewline
20 & 0.7636 & 0.799974442888245 & -0.0363744428882451 \tabularnewline
21 & 0.7433 & 0.792629163753243 & -0.049329163753243 \tabularnewline
22 & 0.7658 & 0.8144446427842 & -0.0486446427841993 \tabularnewline
23 & 0.7627 & 0.810625097633998 & -0.0479250976339982 \tabularnewline
24 & 0.748 & 0.74914511127403 & -0.00114511127403003 \tabularnewline
25 & 0.7692 & 0.745399018915179 & 0.0238009810848211 \tabularnewline
26 & 0.785 & 0.792555710961893 & -0.00755571096189284 \tabularnewline
27 & 0.7913 & 0.8142977372015 & -0.0229977372014993 \tabularnewline
28 & 0.772 & 0.787781279524141 & -0.0157812795241414 \tabularnewline
29 & 0.788 & 0.806511741318397 & -0.0185117413183970 \tabularnewline
30 & 0.807 & 0.813563209287999 & -0.00656320928799903 \tabularnewline
31 & 0.8268 & 0.798431934269895 & 0.0283680657301054 \tabularnewline
32 & 0.8244 & 0.805116138282747 & 0.0192838617172534 \tabularnewline
33 & 0.8487 & 0.790131768847342 & 0.0585682311526579 \tabularnewline
34 & 0.8572 & 0.789397240933842 & 0.067802759066158 \tabularnewline
35 & 0.8214 & 0.78440245112204 & 0.0369975488779596 \tabularnewline
36 & 0.8827 & 0.808421513893498 & 0.0742784861065025 \tabularnewline
37 & 0.9216 & 0.804455063160596 & 0.117144936839404 \tabularnewline
38 & 0.8865 & 0.84962852984086 & 0.0368714701591402 \tabularnewline
39 & 0.8816 & 0.797844311939094 & 0.0837556880609056 \tabularnewline
40 & 0.8884 & 0.804381610369246 & 0.0840183896307536 \tabularnewline
41 & 0.9466 & 0.790425580012742 & 0.156174419987258 \tabularnewline
42 & 0.918 & 0.805997571778947 & 0.112002428221053 \tabularnewline
43 & 0.9337 & 0.789323788142492 & 0.144376211857508 \tabularnewline
44 & 0.9559 & 0.813710114870699 & 0.142189885129301 \tabularnewline
45 & 0.9626 & 0.845955890273359 & 0.116644109726641 \tabularnewline
46 & 0.9434 & 0.831485690377404 & 0.111914309622596 \tabularnewline
47 & 0.8639 & 0.776983719195688 & 0.0869162808043117 \tabularnewline
48 & 0.7996 & 0.78139088667669 & 0.0182091133233104 \tabularnewline
49 & 0.668 & 0.717854222158921 & -0.0498542221589208 \tabularnewline
50 & 0.6572 & 0.655052085554652 & 0.00214791444534780 \tabularnewline
51 & 0.6928 & 0.720131258690771 & -0.0273312586907715 \tabularnewline
52 & 0.6438 & 0.798505387061245 & -0.154705387061245 \tabularnewline
53 & 0.6454 & 0.807099363649197 & -0.161699363649197 \tabularnewline
54 & 0.6873 & 0.767655214694235 & -0.0803552146942355 \tabularnewline
55 & 0.7265 & 0.776616455238938 & -0.0501164552389381 \tabularnewline
56 & 0.7912 & 0.78528388461824 & 0.00591611538175929 \tabularnewline
57 & 0.8114 & 0.832514029456305 & -0.0211140294563047 \tabularnewline
58 & 0.8281 & 0.778379322231339 & 0.0497206777686613 \tabularnewline
59 & 0.8393 & 0.810918908799398 & 0.0283810912006017 \tabularnewline
\hline
\end{tabular}
%Source: https://freestatistics.org/blog/index.php?pk=57769&T=4

[TABLE]
[ROW][C]Multiple Linear Regression - Actuals, Interpolation, and Residuals[/C][/ROW]
[ROW][C]Time or Index[/C][C]Actuals[/C][C]InterpolationForecast[/C][C]ResidualsPrediction Error[/C][/ROW]
[ROW][C]1[/C][C]0.7461[/C][C]0.816721679316048[/C][C]-0.0706216793160478[/C][/ROW]
[ROW][C]2[/C][C]0.7775[/C][C]0.812681775791799[/C][C]-0.0351817757917988[/C][/ROW]
[ROW][C]3[/C][C]0.779[/C][C]0.778012058274589[/C][C]0.000987941725411454[/C][/ROW]
[ROW][C]4[/C][C]0.7744[/C][C]0.78183160342479[/C][C]-0.00743160342478972[/C][/ROW]
[ROW][C]5[/C][C]0.7905[/C][C]0.801002781967145[/C][C]-0.0105027819671454[/C][/ROW]
[ROW][C]6[/C][C]0.7719[/C][C]0.804748874325997[/C][C]-0.0328488743259965[/C][/ROW]
[ROW][C]7[/C][C]0.7811[/C][C]0.804675421534646[/C][C]-0.0235754215346464[/C][/ROW]
[ROW][C]8[/C][C]0.7557[/C][C]0.766626875615335[/C][C]-0.0109268756153352[/C][/ROW]
[ROW][C]9[/C][C]0.7637[/C][C]0.78183160342479[/C][C]-0.0181316034247897[/C][/ROW]
[ROW][C]10[/C][C]0.7595[/C][C]0.8197332437614[/C][C]-0.060233243761401[/C][/ROW]
[ROW][C]11[/C][C]0.7471[/C][C]0.827078522896403[/C][C]-0.079978522896403[/C][/ROW]
[ROW][C]12[/C][C]0.7615[/C][C]0.879230004754919[/C][C]-0.117730004754919[/C][/ROW]
[ROW][C]13[/C][C]0.7487[/C][C]0.796522161694794[/C][C]-0.047822161694794[/C][/ROW]
[ROW][C]14[/C][C]0.7389[/C][C]0.74848403615188[/C][C]-0.00958403615187983[/C][/ROW]
[ROW][C]15[/C][C]0.7337[/C][C]0.774339418707087[/C][C]-0.0406394187070875[/C][/ROW]
[ROW][C]16[/C][C]0.751[/C][C]0.81877835747385[/C][C]-0.0677783574738506[/C][/ROW]
[ROW][C]17[/C][C]0.7382[/C][C]0.78168469784209[/C][C]-0.0434846978420897[/C][/ROW]
[ROW][C]18[/C][C]0.7159[/C][C]0.789029976977092[/C][C]-0.0731299769770919[/C][/ROW]
[ROW][C]19[/C][C]0.7542[/C][C]0.811065814382098[/C][C]-0.0568658143820984[/C][/ROW]
[ROW][C]20[/C][C]0.7636[/C][C]0.799974442888245[/C][C]-0.0363744428882451[/C][/ROW]
[ROW][C]21[/C][C]0.7433[/C][C]0.792629163753243[/C][C]-0.049329163753243[/C][/ROW]
[ROW][C]22[/C][C]0.7658[/C][C]0.8144446427842[/C][C]-0.0486446427841993[/C][/ROW]
[ROW][C]23[/C][C]0.7627[/C][C]0.810625097633998[/C][C]-0.0479250976339982[/C][/ROW]
[ROW][C]24[/C][C]0.748[/C][C]0.74914511127403[/C][C]-0.00114511127403003[/C][/ROW]
[ROW][C]25[/C][C]0.7692[/C][C]0.745399018915179[/C][C]0.0238009810848211[/C][/ROW]
[ROW][C]26[/C][C]0.785[/C][C]0.792555710961893[/C][C]-0.00755571096189284[/C][/ROW]
[ROW][C]27[/C][C]0.7913[/C][C]0.8142977372015[/C][C]-0.0229977372014993[/C][/ROW]
[ROW][C]28[/C][C]0.772[/C][C]0.787781279524141[/C][C]-0.0157812795241414[/C][/ROW]
[ROW][C]29[/C][C]0.788[/C][C]0.806511741318397[/C][C]-0.0185117413183970[/C][/ROW]
[ROW][C]30[/C][C]0.807[/C][C]0.813563209287999[/C][C]-0.00656320928799903[/C][/ROW]
[ROW][C]31[/C][C]0.8268[/C][C]0.798431934269895[/C][C]0.0283680657301054[/C][/ROW]
[ROW][C]32[/C][C]0.8244[/C][C]0.805116138282747[/C][C]0.0192838617172534[/C][/ROW]
[ROW][C]33[/C][C]0.8487[/C][C]0.790131768847342[/C][C]0.0585682311526579[/C][/ROW]
[ROW][C]34[/C][C]0.8572[/C][C]0.789397240933842[/C][C]0.067802759066158[/C][/ROW]
[ROW][C]35[/C][C]0.8214[/C][C]0.78440245112204[/C][C]0.0369975488779596[/C][/ROW]
[ROW][C]36[/C][C]0.8827[/C][C]0.808421513893498[/C][C]0.0742784861065025[/C][/ROW]
[ROW][C]37[/C][C]0.9216[/C][C]0.804455063160596[/C][C]0.117144936839404[/C][/ROW]
[ROW][C]38[/C][C]0.8865[/C][C]0.84962852984086[/C][C]0.0368714701591402[/C][/ROW]
[ROW][C]39[/C][C]0.8816[/C][C]0.797844311939094[/C][C]0.0837556880609056[/C][/ROW]
[ROW][C]40[/C][C]0.8884[/C][C]0.804381610369246[/C][C]0.0840183896307536[/C][/ROW]
[ROW][C]41[/C][C]0.9466[/C][C]0.790425580012742[/C][C]0.156174419987258[/C][/ROW]
[ROW][C]42[/C][C]0.918[/C][C]0.805997571778947[/C][C]0.112002428221053[/C][/ROW]
[ROW][C]43[/C][C]0.9337[/C][C]0.789323788142492[/C][C]0.144376211857508[/C][/ROW]
[ROW][C]44[/C][C]0.9559[/C][C]0.813710114870699[/C][C]0.142189885129301[/C][/ROW]
[ROW][C]45[/C][C]0.9626[/C][C]0.845955890273359[/C][C]0.116644109726641[/C][/ROW]
[ROW][C]46[/C][C]0.9434[/C][C]0.831485690377404[/C][C]0.111914309622596[/C][/ROW]
[ROW][C]47[/C][C]0.8639[/C][C]0.776983719195688[/C][C]0.0869162808043117[/C][/ROW]
[ROW][C]48[/C][C]0.7996[/C][C]0.78139088667669[/C][C]0.0182091133233104[/C][/ROW]
[ROW][C]49[/C][C]0.668[/C][C]0.717854222158921[/C][C]-0.0498542221589208[/C][/ROW]
[ROW][C]50[/C][C]0.6572[/C][C]0.655052085554652[/C][C]0.00214791444534780[/C][/ROW]
[ROW][C]51[/C][C]0.6928[/C][C]0.720131258690771[/C][C]-0.0273312586907715[/C][/ROW]
[ROW][C]52[/C][C]0.6438[/C][C]0.798505387061245[/C][C]-0.154705387061245[/C][/ROW]
[ROW][C]53[/C][C]0.6454[/C][C]0.807099363649197[/C][C]-0.161699363649197[/C][/ROW]
[ROW][C]54[/C][C]0.6873[/C][C]0.767655214694235[/C][C]-0.0803552146942355[/C][/ROW]
[ROW][C]55[/C][C]0.7265[/C][C]0.776616455238938[/C][C]-0.0501164552389381[/C][/ROW]
[ROW][C]56[/C][C]0.7912[/C][C]0.78528388461824[/C][C]0.00591611538175929[/C][/ROW]
[ROW][C]57[/C][C]0.8114[/C][C]0.832514029456305[/C][C]-0.0211140294563047[/C][/ROW]
[ROW][C]58[/C][C]0.8281[/C][C]0.778379322231339[/C][C]0.0497206777686613[/C][/ROW]
[ROW][C]59[/C][C]0.8393[/C][C]0.810918908799398[/C][C]0.0283810912006017[/C][/ROW]
[/TABLE]
Source: https://freestatistics.org/blog/index.php?pk=57769&T=4

Globally Unique Identifier (entire table): ba.freestatistics.org/blog/index.php?pk=57769&T=4

As an alternative you can also use a QR Code:  

The GUIDs for individual cells are displayed in the table below:

Multiple Linear Regression - Actuals, Interpolation, and Residuals
Time or IndexActualsInterpolationForecastResidualsPrediction Error
10.74610.816721679316048-0.0706216793160478
20.77750.812681775791799-0.0351817757917988
30.7790.7780120582745890.000987941725411454
40.77440.78183160342479-0.00743160342478972
50.79050.801002781967145-0.0105027819671454
60.77190.804748874325997-0.0328488743259965
70.78110.804675421534646-0.0235754215346464
80.75570.766626875615335-0.0109268756153352
90.76370.78183160342479-0.0181316034247897
100.75950.8197332437614-0.060233243761401
110.74710.827078522896403-0.079978522896403
120.76150.879230004754919-0.117730004754919
130.74870.796522161694794-0.047822161694794
140.73890.74848403615188-0.00958403615187983
150.73370.774339418707087-0.0406394187070875
160.7510.81877835747385-0.0677783574738506
170.73820.78168469784209-0.0434846978420897
180.71590.789029976977092-0.0731299769770919
190.75420.811065814382098-0.0568658143820984
200.76360.799974442888245-0.0363744428882451
210.74330.792629163753243-0.049329163753243
220.76580.8144446427842-0.0486446427841993
230.76270.810625097633998-0.0479250976339982
240.7480.74914511127403-0.00114511127403003
250.76920.7453990189151790.0238009810848211
260.7850.792555710961893-0.00755571096189284
270.79130.8142977372015-0.0229977372014993
280.7720.787781279524141-0.0157812795241414
290.7880.806511741318397-0.0185117413183970
300.8070.813563209287999-0.00656320928799903
310.82680.7984319342698950.0283680657301054
320.82440.8051161382827470.0192838617172534
330.84870.7901317688473420.0585682311526579
340.85720.7893972409338420.067802759066158
350.82140.784402451122040.0369975488779596
360.88270.8084215138934980.0742784861065025
370.92160.8044550631605960.117144936839404
380.88650.849628529840860.0368714701591402
390.88160.7978443119390940.0837556880609056
400.88840.8043816103692460.0840183896307536
410.94660.7904255800127420.156174419987258
420.9180.8059975717789470.112002428221053
430.93370.7893237881424920.144376211857508
440.95590.8137101148706990.142189885129301
450.96260.8459558902733590.116644109726641
460.94340.8314856903774040.111914309622596
470.86390.7769837191956880.0869162808043117
480.79960.781390886676690.0182091133233104
490.6680.717854222158921-0.0498542221589208
500.65720.6550520855546520.00214791444534780
510.69280.720131258690771-0.0273312586907715
520.64380.798505387061245-0.154705387061245
530.64540.807099363649197-0.161699363649197
540.68730.767655214694235-0.0803552146942355
550.72650.776616455238938-0.0501164552389381
560.79120.785283884618240.00591611538175929
570.81140.832514029456305-0.0211140294563047
580.82810.7783793222313390.0497206777686613
590.83930.8109189087993980.0283810912006017


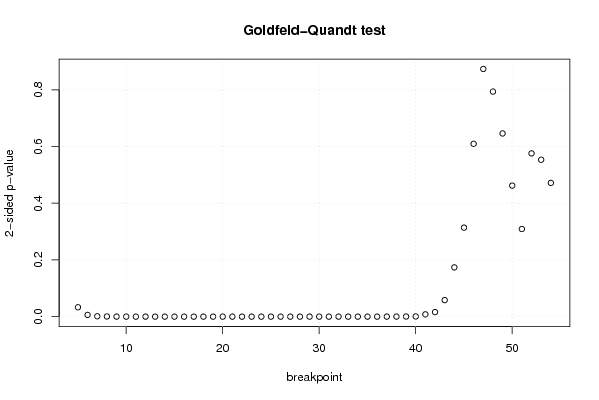
Goldfeld-Quandt test for Heteroskedasticity
p-valuesAlternative Hypothesis
breakpoint indexgreater2-sidedless
50.01656889563365280.03313779126730570.983431104366347
60.003098744643908050.00619748928781610.996901255356092
70.000656350869859810.001312701739719620.99934364913014
80.0003561626309455740.0007123252618911470.999643837369054
97.34169727859286e-050.0001468339455718570.999926583027214
101.83338498926448e-053.66676997852896e-050.999981666150107
117.95925270696285e-061.59185054139257e-050.999992040747293
122.28330208265459e-064.56660416530917e-060.999997716697917
131.05026197637992e-062.10052395275984e-060.999998949738024
149.88925907002844e-071.97785181400569e-060.999999011074093
158.11687246403366e-071.62337449280673e-060.999999188312754
162.80108237438389e-075.60216474876778e-070.999999719891763
171.34242029875230e-072.68484059750461e-070.99999986575797
184.29209975251621e-078.58419950503242e-070.999999570790025
191.40600440065859e-072.81200880131718e-070.99999985939956
204.13046127298554e-088.26092254597109e-080.999999958695387
211.539094945175e-083.07818989035e-080.99999998460905
225.26633064813193e-091.05326612962639e-080.99999999473367
231.75817056812536e-093.51634113625073e-090.99999999824183
243.97810634667618e-107.95621269335237e-100.99999999960219
251.46526596062830e-102.93053192125661e-100.999999999853473
261.05172266509937e-102.10344533019874e-100.999999999894828
271.08782194500936e-102.17564389001871e-100.999999999891218
283.51792781369143e-117.03585562738287e-110.99999999996482
292.50627801030645e-115.0125560206129e-110.999999999974937
306.49205728836221e-111.29841145767244e-100.99999999993508
317.2603958370207e-101.45207916740414e-090.99999999927396
322.47479208671765e-094.94958417343531e-090.999999997525208
333.69445973507212e-087.38891947014423e-080.999999963055403
343.38940500137604e-076.77881000275208e-070.9999996610595
352.92558262821573e-075.85116525643146e-070.999999707441737
363.08296909186209e-066.16593818372419e-060.999996917030908
379.16470963533985e-050.0001832941927067970.999908352903647
380.0001360954824202940.0002721909648405890.99986390451758
390.0002375915742002790.0004751831484005580.9997624084258
400.0003725317384706470.0007450634769412940.99962746826153
410.004049193061035030.008098386122070070.995950806938965
420.00801138312255820.01602276624511640.991988616877442
430.02916974670728980.05833949341457950.97083025329271
440.08686323612883160.1737264722576630.913136763871168
450.1569681601752320.3139363203504640.843031839824768
460.3047277942521570.6094555885043150.695272205747843
470.4367084292973890.8734168585947770.563291570702611
480.396795665440040.793591330880080.60320433455996
490.3230126999694950.6460253999389910.676987300030504
500.2310562355856890.4621124711713790.76894376441431
510.1544763970926600.3089527941853210.84552360290734
520.2878304196240420.5756608392480840.712169580375958
530.7233775568816840.5532448862366320.276622443118316
540.7641415902184190.4717168195631620.235858409781581

\begin{tabular}{lllllllll}
\hline
Goldfeld-Quandt test for Heteroskedasticity \tabularnewline
p-values & Alternative Hypothesis \tabularnewline
breakpoint index & greater & 2-sided & less \tabularnewline
5 & 0.0165688956336528 & 0.0331377912673057 & 0.983431104366347 \tabularnewline
6 & 0.00309874464390805 & 0.0061974892878161 & 0.996901255356092 \tabularnewline
7 & 0.00065635086985981 & 0.00131270173971962 & 0.99934364913014 \tabularnewline
8 & 0.000356162630945574 & 0.000712325261891147 & 0.999643837369054 \tabularnewline
9 & 7.34169727859286e-05 & 0.000146833945571857 & 0.999926583027214 \tabularnewline
10 & 1.83338498926448e-05 & 3.66676997852896e-05 & 0.999981666150107 \tabularnewline
11 & 7.95925270696285e-06 & 1.59185054139257e-05 & 0.999992040747293 \tabularnewline
12 & 2.28330208265459e-06 & 4.56660416530917e-06 & 0.999997716697917 \tabularnewline
13 & 1.05026197637992e-06 & 2.10052395275984e-06 & 0.999998949738024 \tabularnewline
14 & 9.88925907002844e-07 & 1.97785181400569e-06 & 0.999999011074093 \tabularnewline
15 & 8.11687246403366e-07 & 1.62337449280673e-06 & 0.999999188312754 \tabularnewline
16 & 2.80108237438389e-07 & 5.60216474876778e-07 & 0.999999719891763 \tabularnewline
17 & 1.34242029875230e-07 & 2.68484059750461e-07 & 0.99999986575797 \tabularnewline
18 & 4.29209975251621e-07 & 8.58419950503242e-07 & 0.999999570790025 \tabularnewline
19 & 1.40600440065859e-07 & 2.81200880131718e-07 & 0.99999985939956 \tabularnewline
20 & 4.13046127298554e-08 & 8.26092254597109e-08 & 0.999999958695387 \tabularnewline
21 & 1.539094945175e-08 & 3.07818989035e-08 & 0.99999998460905 \tabularnewline
22 & 5.26633064813193e-09 & 1.05326612962639e-08 & 0.99999999473367 \tabularnewline
23 & 1.75817056812536e-09 & 3.51634113625073e-09 & 0.99999999824183 \tabularnewline
24 & 3.97810634667618e-10 & 7.95621269335237e-10 & 0.99999999960219 \tabularnewline
25 & 1.46526596062830e-10 & 2.93053192125661e-10 & 0.999999999853473 \tabularnewline
26 & 1.05172266509937e-10 & 2.10344533019874e-10 & 0.999999999894828 \tabularnewline
27 & 1.08782194500936e-10 & 2.17564389001871e-10 & 0.999999999891218 \tabularnewline
28 & 3.51792781369143e-11 & 7.03585562738287e-11 & 0.99999999996482 \tabularnewline
29 & 2.50627801030645e-11 & 5.0125560206129e-11 & 0.999999999974937 \tabularnewline
30 & 6.49205728836221e-11 & 1.29841145767244e-10 & 0.99999999993508 \tabularnewline
31 & 7.2603958370207e-10 & 1.45207916740414e-09 & 0.99999999927396 \tabularnewline
32 & 2.47479208671765e-09 & 4.94958417343531e-09 & 0.999999997525208 \tabularnewline
33 & 3.69445973507212e-08 & 7.38891947014423e-08 & 0.999999963055403 \tabularnewline
34 & 3.38940500137604e-07 & 6.77881000275208e-07 & 0.9999996610595 \tabularnewline
35 & 2.92558262821573e-07 & 5.85116525643146e-07 & 0.999999707441737 \tabularnewline
36 & 3.08296909186209e-06 & 6.16593818372419e-06 & 0.999996917030908 \tabularnewline
37 & 9.16470963533985e-05 & 0.000183294192706797 & 0.999908352903647 \tabularnewline
38 & 0.000136095482420294 & 0.000272190964840589 & 0.99986390451758 \tabularnewline
39 & 0.000237591574200279 & 0.000475183148400558 & 0.9997624084258 \tabularnewline
40 & 0.000372531738470647 & 0.000745063476941294 & 0.99962746826153 \tabularnewline
41 & 0.00404919306103503 & 0.00809838612207007 & 0.995950806938965 \tabularnewline
42 & 0.0080113831225582 & 0.0160227662451164 & 0.991988616877442 \tabularnewline
43 & 0.0291697467072898 & 0.0583394934145795 & 0.97083025329271 \tabularnewline
44 & 0.0868632361288316 & 0.173726472257663 & 0.913136763871168 \tabularnewline
45 & 0.156968160175232 & 0.313936320350464 & 0.843031839824768 \tabularnewline
46 & 0.304727794252157 & 0.609455588504315 & 0.695272205747843 \tabularnewline
47 & 0.436708429297389 & 0.873416858594777 & 0.563291570702611 \tabularnewline
48 & 0.39679566544004 & 0.79359133088008 & 0.60320433455996 \tabularnewline
49 & 0.323012699969495 & 0.646025399938991 & 0.676987300030504 \tabularnewline
50 & 0.231056235585689 & 0.462112471171379 & 0.76894376441431 \tabularnewline
51 & 0.154476397092660 & 0.308952794185321 & 0.84552360290734 \tabularnewline
52 & 0.287830419624042 & 0.575660839248084 & 0.712169580375958 \tabularnewline
53 & 0.723377556881684 & 0.553244886236632 & 0.276622443118316 \tabularnewline
54 & 0.764141590218419 & 0.471716819563162 & 0.235858409781581 \tabularnewline
\hline
\end{tabular}
%Source: https://freestatistics.org/blog/index.php?pk=57769&T=5

[TABLE]
[ROW][C]Goldfeld-Quandt test for Heteroskedasticity[/C][/ROW]
[ROW][C]p-values[/C][C]Alternative Hypothesis[/C][/ROW]
[ROW][C]breakpoint index[/C][C]greater[/C][C]2-sided[/C][C]less[/C][/ROW]
[ROW][C]5[/C][C]0.0165688956336528[/C][C]0.0331377912673057[/C][C]0.983431104366347[/C][/ROW]
[ROW][C]6[/C][C]0.00309874464390805[/C][C]0.0061974892878161[/C][C]0.996901255356092[/C][/ROW]
[ROW][C]7[/C][C]0.00065635086985981[/C][C]0.00131270173971962[/C][C]0.99934364913014[/C][/ROW]
[ROW][C]8[/C][C]0.000356162630945574[/C][C]0.000712325261891147[/C][C]0.999643837369054[/C][/ROW]
[ROW][C]9[/C][C]7.34169727859286e-05[/C][C]0.000146833945571857[/C][C]0.999926583027214[/C][/ROW]
[ROW][C]10[/C][C]1.83338498926448e-05[/C][C]3.66676997852896e-05[/C][C]0.999981666150107[/C][/ROW]
[ROW][C]11[/C][C]7.95925270696285e-06[/C][C]1.59185054139257e-05[/C][C]0.999992040747293[/C][/ROW]
[ROW][C]12[/C][C]2.28330208265459e-06[/C][C]4.56660416530917e-06[/C][C]0.999997716697917[/C][/ROW]
[ROW][C]13[/C][C]1.05026197637992e-06[/C][C]2.10052395275984e-06[/C][C]0.999998949738024[/C][/ROW]
[ROW][C]14[/C][C]9.88925907002844e-07[/C][C]1.97785181400569e-06[/C][C]0.999999011074093[/C][/ROW]
[ROW][C]15[/C][C]8.11687246403366e-07[/C][C]1.62337449280673e-06[/C][C]0.999999188312754[/C][/ROW]
[ROW][C]16[/C][C]2.80108237438389e-07[/C][C]5.60216474876778e-07[/C][C]0.999999719891763[/C][/ROW]
[ROW][C]17[/C][C]1.34242029875230e-07[/C][C]2.68484059750461e-07[/C][C]0.99999986575797[/C][/ROW]
[ROW][C]18[/C][C]4.29209975251621e-07[/C][C]8.58419950503242e-07[/C][C]0.999999570790025[/C][/ROW]
[ROW][C]19[/C][C]1.40600440065859e-07[/C][C]2.81200880131718e-07[/C][C]0.99999985939956[/C][/ROW]
[ROW][C]20[/C][C]4.13046127298554e-08[/C][C]8.26092254597109e-08[/C][C]0.999999958695387[/C][/ROW]
[ROW][C]21[/C][C]1.539094945175e-08[/C][C]3.07818989035e-08[/C][C]0.99999998460905[/C][/ROW]
[ROW][C]22[/C][C]5.26633064813193e-09[/C][C]1.05326612962639e-08[/C][C]0.99999999473367[/C][/ROW]
[ROW][C]23[/C][C]1.75817056812536e-09[/C][C]3.51634113625073e-09[/C][C]0.99999999824183[/C][/ROW]
[ROW][C]24[/C][C]3.97810634667618e-10[/C][C]7.95621269335237e-10[/C][C]0.99999999960219[/C][/ROW]
[ROW][C]25[/C][C]1.46526596062830e-10[/C][C]2.93053192125661e-10[/C][C]0.999999999853473[/C][/ROW]
[ROW][C]26[/C][C]1.05172266509937e-10[/C][C]2.10344533019874e-10[/C][C]0.999999999894828[/C][/ROW]
[ROW][C]27[/C][C]1.08782194500936e-10[/C][C]2.17564389001871e-10[/C][C]0.999999999891218[/C][/ROW]
[ROW][C]28[/C][C]3.51792781369143e-11[/C][C]7.03585562738287e-11[/C][C]0.99999999996482[/C][/ROW]
[ROW][C]29[/C][C]2.50627801030645e-11[/C][C]5.0125560206129e-11[/C][C]0.999999999974937[/C][/ROW]
[ROW][C]30[/C][C]6.49205728836221e-11[/C][C]1.29841145767244e-10[/C][C]0.99999999993508[/C][/ROW]
[ROW][C]31[/C][C]7.2603958370207e-10[/C][C]1.45207916740414e-09[/C][C]0.99999999927396[/C][/ROW]
[ROW][C]32[/C][C]2.47479208671765e-09[/C][C]4.94958417343531e-09[/C][C]0.999999997525208[/C][/ROW]
[ROW][C]33[/C][C]3.69445973507212e-08[/C][C]7.38891947014423e-08[/C][C]0.999999963055403[/C][/ROW]
[ROW][C]34[/C][C]3.38940500137604e-07[/C][C]6.77881000275208e-07[/C][C]0.9999996610595[/C][/ROW]
[ROW][C]35[/C][C]2.92558262821573e-07[/C][C]5.85116525643146e-07[/C][C]0.999999707441737[/C][/ROW]
[ROW][C]36[/C][C]3.08296909186209e-06[/C][C]6.16593818372419e-06[/C][C]0.999996917030908[/C][/ROW]
[ROW][C]37[/C][C]9.16470963533985e-05[/C][C]0.000183294192706797[/C][C]0.999908352903647[/C][/ROW]
[ROW][C]38[/C][C]0.000136095482420294[/C][C]0.000272190964840589[/C][C]0.99986390451758[/C][/ROW]
[ROW][C]39[/C][C]0.000237591574200279[/C][C]0.000475183148400558[/C][C]0.9997624084258[/C][/ROW]
[ROW][C]40[/C][C]0.000372531738470647[/C][C]0.000745063476941294[/C][C]0.99962746826153[/C][/ROW]
[ROW][C]41[/C][C]0.00404919306103503[/C][C]0.00809838612207007[/C][C]0.995950806938965[/C][/ROW]
[ROW][C]42[/C][C]0.0080113831225582[/C][C]0.0160227662451164[/C][C]0.991988616877442[/C][/ROW]
[ROW][C]43[/C][C]0.0291697467072898[/C][C]0.0583394934145795[/C][C]0.97083025329271[/C][/ROW]
[ROW][C]44[/C][C]0.0868632361288316[/C][C]0.173726472257663[/C][C]0.913136763871168[/C][/ROW]
[ROW][C]45[/C][C]0.156968160175232[/C][C]0.313936320350464[/C][C]0.843031839824768[/C][/ROW]
[ROW][C]46[/C][C]0.304727794252157[/C][C]0.609455588504315[/C][C]0.695272205747843[/C][/ROW]
[ROW][C]47[/C][C]0.436708429297389[/C][C]0.873416858594777[/C][C]0.563291570702611[/C][/ROW]
[ROW][C]48[/C][C]0.39679566544004[/C][C]0.79359133088008[/C][C]0.60320433455996[/C][/ROW]
[ROW][C]49[/C][C]0.323012699969495[/C][C]0.646025399938991[/C][C]0.676987300030504[/C][/ROW]
[ROW][C]50[/C][C]0.231056235585689[/C][C]0.462112471171379[/C][C]0.76894376441431[/C][/ROW]
[ROW][C]51[/C][C]0.154476397092660[/C][C]0.308952794185321[/C][C]0.84552360290734[/C][/ROW]
[ROW][C]52[/C][C]0.287830419624042[/C][C]0.575660839248084[/C][C]0.712169580375958[/C][/ROW]
[ROW][C]53[/C][C]0.723377556881684[/C][C]0.553244886236632[/C][C]0.276622443118316[/C][/ROW]
[ROW][C]54[/C][C]0.764141590218419[/C][C]0.471716819563162[/C][C]0.235858409781581[/C][/ROW]
[/TABLE]
Source: https://freestatistics.org/blog/index.php?pk=57769&T=5

Globally Unique Identifier (entire table): ba.freestatistics.org/blog/index.php?pk=57769&T=5

As an alternative you can also use a QR Code:  

The GUIDs for individual cells are displayed in the table below:

Goldfeld-Quandt test for Heteroskedasticity
p-valuesAlternative Hypothesis
breakpoint indexgreater2-sidedless
50.01656889563365280.03313779126730570.983431104366347
60.003098744643908050.00619748928781610.996901255356092
70.000656350869859810.001312701739719620.99934364913014
80.0003561626309455740.0007123252618911470.999643837369054
97.34169727859286e-050.0001468339455718570.999926583027214
101.83338498926448e-053.66676997852896e-050.999981666150107
117.95925270696285e-061.59185054139257e-050.999992040747293
122.28330208265459e-064.56660416530917e-060.999997716697917
131.05026197637992e-062.10052395275984e-060.999998949738024
149.88925907002844e-071.97785181400569e-060.999999011074093
158.11687246403366e-071.62337449280673e-060.999999188312754
162.80108237438389e-075.60216474876778e-070.999999719891763
171.34242029875230e-072.68484059750461e-070.99999986575797
184.29209975251621e-078.58419950503242e-070.999999570790025
191.40600440065859e-072.81200880131718e-070.99999985939956
204.13046127298554e-088.26092254597109e-080.999999958695387
211.539094945175e-083.07818989035e-080.99999998460905
225.26633064813193e-091.05326612962639e-080.99999999473367
231.75817056812536e-093.51634113625073e-090.99999999824183
243.97810634667618e-107.95621269335237e-100.99999999960219
251.46526596062830e-102.93053192125661e-100.999999999853473
261.05172266509937e-102.10344533019874e-100.999999999894828
271.08782194500936e-102.17564389001871e-100.999999999891218
283.51792781369143e-117.03585562738287e-110.99999999996482
292.50627801030645e-115.0125560206129e-110.999999999974937
306.49205728836221e-111.29841145767244e-100.99999999993508
317.2603958370207e-101.45207916740414e-090.99999999927396
322.47479208671765e-094.94958417343531e-090.999999997525208
333.69445973507212e-087.38891947014423e-080.999999963055403
343.38940500137604e-076.77881000275208e-070.9999996610595
352.92558262821573e-075.85116525643146e-070.999999707441737
363.08296909186209e-066.16593818372419e-060.999996917030908
379.16470963533985e-050.0001832941927067970.999908352903647
380.0001360954824202940.0002721909648405890.99986390451758
390.0002375915742002790.0004751831484005580.9997624084258
400.0003725317384706470.0007450634769412940.99962746826153
410.004049193061035030.008098386122070070.995950806938965
420.00801138312255820.01602276624511640.991988616877442
430.02916974670728980.05833949341457950.97083025329271
440.08686323612883160.1737264722576630.913136763871168
450.1569681601752320.3139363203504640.843031839824768
460.3047277942521570.6094555885043150.695272205747843
470.4367084292973890.8734168585947770.563291570702611
480.396795665440040.793591330880080.60320433455996
490.3230126999694950.6460253999389910.676987300030504
500.2310562355856890.4621124711713790.76894376441431
510.1544763970926600.3089527941853210.84552360290734
520.2878304196240420.5756608392480840.712169580375958
530.7233775568816840.5532448862366320.276622443118316
540.7641415902184190.4717168195631620.235858409781581


Meta Analysis of Goldfeld-Quandt test for Heteroskedasticity
Description# significant tests% significant testsOK/NOK
1% type I error level360.72NOK
5% type I error level380.76NOK
10% type I error level390.78NOK

\begin{tabular}{lllllllll}
\hline
Meta Analysis of Goldfeld-Quandt test for Heteroskedasticity \tabularnewline
Description & # significant tests & % significant tests & OK/NOK \tabularnewline
1% type I error level & 36 & 0.72 & NOK \tabularnewline
5% type I error level & 38 & 0.76 & NOK \tabularnewline
10% type I error level & 39 & 0.78 & NOK \tabularnewline
\hline
\end{tabular}
%Source: https://freestatistics.org/blog/index.php?pk=57769&T=6

[TABLE]
[ROW][C]Meta Analysis of Goldfeld-Quandt test for Heteroskedasticity[/C][/ROW]
[ROW][C]Description[/C][C]# significant tests[/C][C]% significant tests[/C][C]OK/NOK[/C][/ROW]
[ROW][C]1% type I error level[/C][C]36[/C][C]0.72[/C][C]NOK[/C][/ROW]
[ROW][C]5% type I error level[/C][C]38[/C][C]0.76[/C][C]NOK[/C][/ROW]
[ROW][C]10% type I error level[/C][C]39[/C][C]0.78[/C][C]NOK[/C][/ROW]
[/TABLE]
Source: https://freestatistics.org/blog/index.php?pk=57769&T=6

Globally Unique Identifier (entire table): ba.freestatistics.org/blog/index.php?pk=57769&T=6

As an alternative you can also use a QR Code:  

The GUIDs for individual cells are displayed in the table below:

Meta Analysis of Goldfeld-Quandt test for Heteroskedasticity
Description# significant tests% significant testsOK/NOK
1% type I error level360.72NOK
5% type I error level380.76NOK
10% type I error level390.78NOK


Parameters (Session):
par1 = 1 ; par2 = Do not include Seasonal Dummies ; par3 = No Linear Trend ;
Parameters (R input):
par1 = 1 ; par2 = Do not include Seasonal Dummies ; par3 = No Linear Trend ;
R code (references can be found in the software module):
library(lattice)
library(lmtest)
n25 <- 25 #minimum number of obs. for Goldfeld-Quandt test
par1 <- as.numeric(par1)
x <- t(y)
k <- length(x[1,])
n <- length(x[,1])
x1 <- cbind(x[,par1], x[,1:k!=par1])
mycolnames <- c(colnames(x)[par1], colnames(x)[1:k!=par1])
colnames(x1) <- mycolnames #colnames(x)[par1]
x <- x1
if (par3 == 'First Differences'){
x2 <- array(0, dim=c(n-1,k), dimnames=list(1:(n-1), paste('(1-B)',colnames(x),sep='')))
for (i in 1:n-1) {
for (j in 1:k) {
x2[i,j] <- x[i+1,j] - x[i,j]
}
}
x <- x2
}
if (par2 == 'Include Monthly Dummies'){
x2 <- array(0, dim=c(n,11), dimnames=list(1:n, paste('M', seq(1:11), sep ='')))
for (i in 1:11){
x2[seq(i,n,12),i] <- 1
}
x <- cbind(x, x2)
}
if (par2 == 'Include Quarterly Dummies'){
x2 <- array(0, dim=c(n,3), dimnames=list(1:n, paste('Q', seq(1:3), sep ='')))
for (i in 1:3){
x2[seq(i,n,4),i] <- 1
}
x <- cbind(x, x2)
}
k <- length(x[1,])
if (par3 == 'Linear Trend'){
x <- cbind(x, c(1:n))
colnames(x)[k+1] <- 't'
}
x
k <- length(x[1,])
df <- as.data.frame(x)
(mylm <- lm(df))
(mysum <- summary(mylm))
if (n > n25) {
kp3 <- k + 3
nmkm3 <- n - k - 3
gqarr <- array(NA, dim=c(nmkm3-kp3+1,3))
numgqtests <- 0
numsignificant1 <- 0
numsignificant5 <- 0
numsignificant10 <- 0
for (mypoint in kp3:nmkm3) {
j <- 0
numgqtests <- numgqtests + 1
for (myalt in c('greater', 'two.sided', 'less')) {
j <- j + 1
gqarr[mypoint-kp3+1,j] <- gqtest(mylm, point=mypoint, alternative=myalt)$p.value
}
if (gqarr[mypoint-kp3+1,2] < 0.01) numsignificant1 <- numsignificant1 + 1
if (gqarr[mypoint-kp3+1,2] < 0.05) numsignificant5 <- numsignificant5 + 1
if (gqarr[mypoint-kp3+1,2] < 0.10) numsignificant10 <- numsignificant10 + 1
}
gqarr
}
bitmap(file='test0.png')
plot(x[,1], type='l', main='Actuals and Interpolation', ylab='value of Actuals and Interpolation (dots)', xlab='time or index')
points(x[,1]-mysum$resid)
grid()
dev.off()
bitmap(file='test1.png')
plot(mysum$resid, type='b', pch=19, main='Residuals', ylab='value of Residuals', xlab='time or index')
grid()
dev.off()
bitmap(file='test2.png')
hist(mysum$resid, main='Residual Histogram', xlab='values of Residuals')
grid()
dev.off()
bitmap(file='test3.png')
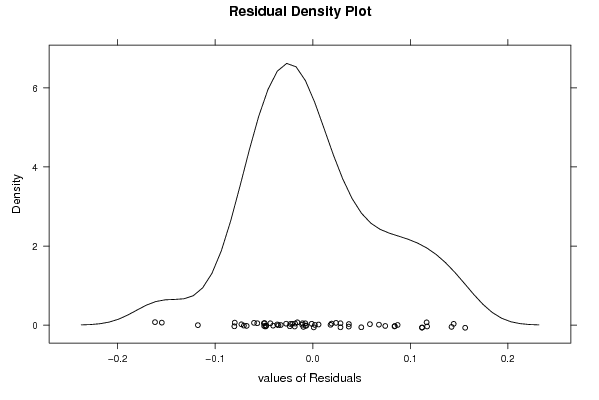
densityplot(~mysum$resid,col='black',main='Residual Density Plot', xlab='values of Residuals')
dev.off()
bitmap(file='test4.png')
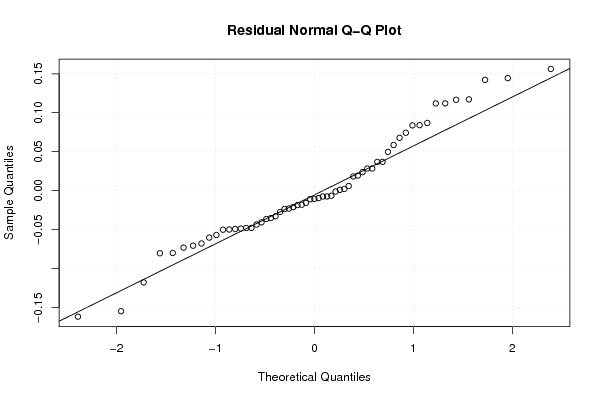
qqnorm(mysum$resid, main='Residual Normal Q-Q Plot')
qqline(mysum$resid)
grid()
dev.off()
(myerror <- as.ts(mysum$resid))
bitmap(file='test5.png')
dum <- cbind(lag(myerror,k=1),myerror)
dum
dum1 <- dum[2:length(myerror),]
dum1
z <- as.data.frame(dum1)
z
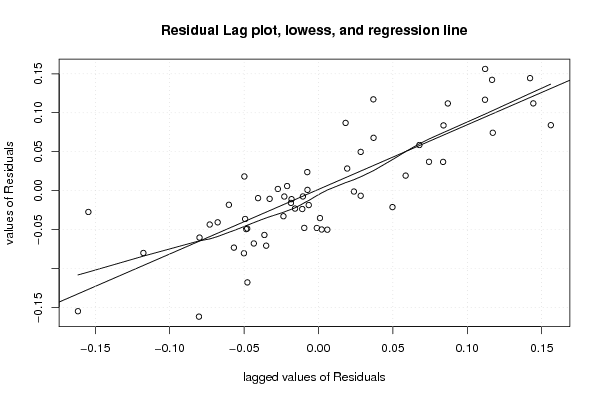
plot(z,main=paste('Residual Lag plot, lowess, and regression line'), ylab='values of Residuals', xlab='lagged values of Residuals')
lines(lowess(z))
abline(lm(z))
grid()
dev.off()
bitmap(file='test6.png')
acf(mysum$resid, lag.max=length(mysum$resid)/2, main='Residual Autocorrelation Function')
grid()
dev.off()
bitmap(file='test7.png')
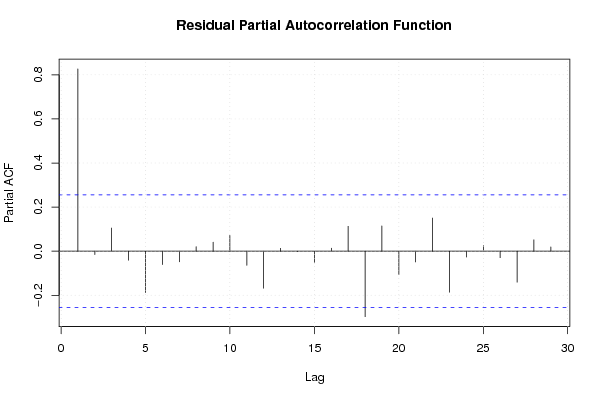
pacf(mysum$resid, lag.max=length(mysum$resid)/2, main='Residual Partial Autocorrelation Function')
grid()
dev.off()
bitmap(file='test8.png')
opar <- par(mfrow = c(2,2), oma = c(0, 0, 1.1, 0))
plot(mylm, las = 1, sub='Residual Diagnostics')
par(opar)
dev.off()
if (n > n25) {
bitmap(file='test9.png')
plot(kp3:nmkm3,gqarr[,2], main='Goldfeld-Quandt test',ylab='2-sided p-value',xlab='breakpoint')
grid()
dev.off()
}
load(file='createtable')
a<-table.start()
a<-table.row.start(a)
a<-table.element(a, 'Multiple Linear Regression - Estimated Regression Equation', 1, TRUE)
a<-table.row.end(a)
myeq <- colnames(x)[1]
myeq <- paste(myeq, '[t] = ', sep='')
for (i in 1:k){
if (mysum$coefficients[i,1] > 0) myeq <- paste(myeq, '+', '')
myeq <- paste(myeq, mysum$coefficients[i,1], sep=' ')
if (rownames(mysum$coefficients)[i] != '(Intercept)') {
myeq <- paste(myeq, rownames(mysum$coefficients)[i], sep='')
if (rownames(mysum$coefficients)[i] != 't') myeq <- paste(myeq, '[t]', sep='')
}
}
myeq <- paste(myeq, ' + e[t]')
a<-table.row.start(a)
a<-table.element(a, myeq)
a<-table.row.end(a)
a<-table.end(a)
table.save(a,file='mytable1.tab')
a<-table.start()
a<-table.row.start(a)
a<-table.element(a,hyperlink('ols1.htm','Multiple Linear Regression - Ordinary Least Squares',''), 6, TRUE)
a<-table.row.end(a)
a<-table.row.start(a)
a<-table.element(a,'Variable',header=TRUE)
a<-table.element(a,'Parameter',header=TRUE)
a<-table.element(a,'S.D.',header=TRUE)
a<-table.element(a,'T-STAT
H0: parameter = 0',header=TRUE)
a<-table.element(a,'2-tail p-value',header=TRUE)
a<-table.element(a,'1-tail p-value',header=TRUE)
a<-table.row.end(a)
for (i in 1:k){
a<-table.row.start(a)
a<-table.element(a,rownames(mysum$coefficients)[i],header=TRUE)
a<-table.element(a,mysum$coefficients[i,1])
a<-table.element(a, round(mysum$coefficients[i,2],6))
a<-table.element(a, round(mysum$coefficients[i,3],4))
a<-table.element(a, round(mysum$coefficients[i,4],6))
a<-table.element(a, round(mysum$coefficients[i,4]/2,6))
a<-table.row.end(a)
}
a<-table.end(a)
table.save(a,file='mytable2.tab')
a<-table.start()
a<-table.row.start(a)
a<-table.element(a, 'Multiple Linear Regression - Regression Statistics', 2, TRUE)
a<-table.row.end(a)
a<-table.row.start(a)
a<-table.element(a, 'Multiple R',1,TRUE)
a<-table.element(a, sqrt(mysum$r.squared))
a<-table.row.end(a)
a<-table.row.start(a)
a<-table.element(a, 'R-squared',1,TRUE)
a<-table.element(a, mysum$r.squared)
a<-table.row.end(a)
a<-table.row.start(a)
a<-table.element(a, 'Adjusted R-squared',1,TRUE)
a<-table.element(a, mysum$adj.r.squared)
a<-table.row.end(a)
a<-table.row.start(a)
a<-table.element(a, 'F-TEST (value)',1,TRUE)
a<-table.element(a, mysum$fstatistic[1])
a<-table.row.end(a)
a<-table.row.start(a)
a<-table.element(a, 'F-TEST (DF numerator)',1,TRUE)
a<-table.element(a, mysum$fstatistic[2])
a<-table.row.end(a)
a<-table.row.start(a)
a<-table.element(a, 'F-TEST (DF denominator)',1,TRUE)
a<-table.element(a, mysum$fstatistic[3])
a<-table.row.end(a)
a<-table.row.start(a)
a<-table.element(a, 'p-value',1,TRUE)
a<-table.element(a, 1-pf(mysum$fstatistic[1],mysum$fstatistic[2],mysum$fstatistic[3]))
a<-table.row.end(a)
a<-table.row.start(a)
a<-table.element(a, 'Multiple Linear Regression - Residual Statistics', 2, TRUE)
a<-table.row.end(a)
a<-table.row.start(a)
a<-table.element(a, 'Residual Standard Deviation',1,TRUE)
a<-table.element(a, mysum$sigma)
a<-table.row.end(a)
a<-table.row.start(a)
a<-table.element(a, 'Sum Squared Residuals',1,TRUE)
a<-table.element(a, sum(myerror*myerror))
a<-table.row.end(a)
a<-table.end(a)
table.save(a,file='mytable3.tab')
a<-table.start()
a<-table.row.start(a)
a<-table.element(a, 'Multiple Linear Regression - Actuals, Interpolation, and Residuals', 4, TRUE)
a<-table.row.end(a)
a<-table.row.start(a)
a<-table.element(a, 'Time or Index', 1, TRUE)
a<-table.element(a, 'Actuals', 1, TRUE)
a<-table.element(a, 'Interpolation
Forecast', 1, TRUE)
a<-table.element(a, 'Residuals
Prediction Error', 1, TRUE)
a<-table.row.end(a)
for (i in 1:n) {
a<-table.row.start(a)
a<-table.element(a,i, 1, TRUE)
a<-table.element(a,x[i])
a<-table.element(a,x[i]-mysum$resid[i])
a<-table.element(a,mysum$resid[i])
a<-table.row.end(a)
}
a<-table.end(a)
table.save(a,file='mytable4.tab')
if (n > n25) {
a<-table.start()
a<-table.row.start(a)
a<-table.element(a,'Goldfeld-Quandt test for Heteroskedasticity',4,TRUE)
a<-table.row.end(a)
a<-table.row.start(a)
a<-table.element(a,'p-values',header=TRUE)
a<-table.element(a,'Alternative Hypothesis',3,header=TRUE)
a<-table.row.end(a)
a<-table.row.start(a)
a<-table.element(a,'breakpoint index',header=TRUE)
a<-table.element(a,'greater',header=TRUE)
a<-table.element(a,'2-sided',header=TRUE)
a<-table.element(a,'less',header=TRUE)
a<-table.row.end(a)
for (mypoint in kp3:nmkm3) {
a<-table.row.start(a)
a<-table.element(a,mypoint,header=TRUE)
a<-table.element(a,gqarr[mypoint-kp3+1,1])
a<-table.element(a,gqarr[mypoint-kp3+1,2])
a<-table.element(a,gqarr[mypoint-kp3+1,3])
a<-table.row.end(a)
}
a<-table.end(a)
table.save(a,file='mytable5.tab')
a<-table.start()
a<-table.row.start(a)
a<-table.element(a,'Meta Analysis of Goldfeld-Quandt test for Heteroskedasticity',4,TRUE)
a<-table.row.end(a)
a<-table.row.start(a)
a<-table.element(a,'Description',header=TRUE)
a<-table.element(a,'# significant tests',header=TRUE)
a<-table.element(a,'% significant tests',header=TRUE)
a<-table.element(a,'OK/NOK',header=TRUE)
a<-table.row.end(a)
a<-table.row.start(a)
a<-table.element(a,'1% type I error level',header=TRUE)
a<-table.element(a,numsignificant1)
a<-table.element(a,numsignificant1/numgqtests)
if (numsignificant1/numgqtests < 0.01) dum <- 'OK' else dum <- 'NOK'
a<-table.element(a,dum)
a<-table.row.end(a)
a<-table.row.start(a)
a<-table.element(a,'5% type I error level',header=TRUE)
a<-table.element(a,numsignificant5)
a<-table.element(a,numsignificant5/numgqtests)
if (numsignificant5/numgqtests < 0.05) dum <- 'OK' else dum <- 'NOK'
a<-table.element(a,dum)
a<-table.row.end(a)
a<-table.row.start(a)
a<-table.element(a,'10% type I error level',header=TRUE)
a<-table.element(a,numsignificant10)
a<-table.element(a,numsignificant10/numgqtests)
if (numsignificant10/numgqtests < 0.1) dum <- 'OK' else dum <- 'NOK'
a<-table.element(a,dum)
a<-table.row.end(a)
a<-table.end(a)
table.save(a,file='mytable6.tab')
}