| Multiple Linear Regression - Estimated Regression Equation |
| bbp[t] = -0.658401005013655 + 0.862606433366398dnst[t] -0.0400106821199718y1[t] -0.0938026651675497y2[t] + 0.0544948659153816y3[t] + 0.389840352423138y4[t] + 0.0762801278972633M1[t] + 0.250610875389412M2[t] + 0.735839254790127M3[t] + 0.576575956377957M4[t] + 0.842257409297771M5[t] + 0.58792273935397M6[t] + 0.501342706463074M7[t] + 0.605788032914381M8[t] + 0.565962578885114M9[t] + 0.657248181394328M10[t] + 0.424207069846181M11[t] -0.00773667959424864t + e[t] |
| Multiple Linear Regression - Ordinary Least Squares | |||||
| Variable | Parameter | S.D. | T-STAT H0: parameter = 0 | 2-tail p-value | 1-tail p-value |
| (Intercept) | -0.658401005013655 | 0.469228 | -1.4032 | 0.168098 | 0.084049 |
| dnst | 0.862606433366398 | 0.130378 | 6.6162 | 0 | 0 |
| y1 | -0.0400106821199718 | 0.112815 | -0.3547 | 0.724665 | 0.362332 |
| y2 | -0.0938026651675497 | 0.145014 | -0.6469 | 0.521333 | 0.260667 |
| y3 | 0.0544948659153816 | 0.146718 | 0.3714 | 0.712232 | 0.356116 |
| y4 | 0.389840352423138 | 0.133275 | 2.9251 | 0.005589 | 0.002795 |
| M1 | 0.0762801278972633 | 0.450718 | 0.1692 | 0.866439 | 0.43322 |
| M2 | 0.250610875389412 | 0.445299 | 0.5628 | 0.576641 | 0.288321 |
| M3 | 0.735839254790127 | 0.451297 | 1.6305 | 0.110656 | 0.055328 |
| M4 | 0.576575956377957 | 0.458038 | 1.2588 | 0.215225 | 0.107613 |
| M5 | 0.842257409297771 | 0.445936 | 1.8887 | 0.066015 | 0.033008 |
| M6 | 0.58792273935397 | 0.457028 | 1.2864 | 0.205519 | 0.102759 |
| M7 | 0.501342706463074 | 0.455131 | 1.1015 | 0.277088 | 0.138544 |
| M8 | 0.605788032914381 | 0.456644 | 1.3266 | 0.19198 | 0.09599 |
| M9 | 0.565962578885114 | 0.459473 | 1.2318 | 0.225055 | 0.112528 |
| M10 | 0.657248181394328 | 0.450472 | 1.459 | 0.152179 | 0.076089 |
| M11 | 0.424207069846181 | 0.445081 | 0.9531 | 0.346125 | 0.173062 |
| t | -0.00773667959424864 | 0.005566 | -1.3901 | 0.172004 | 0.086002 |
| Multiple Linear Regression - Regression Statistics | |
| Multiple R | 0.934025997985242 |
| R-squared | 0.872404564912327 |
| Adjusted R-squared | 0.819499140607682 |
| F-TEST (value) | 16.4898888229072 |
| F-TEST (DF numerator) | 17 |
| F-TEST (DF denominator) | 41 |
| p-value | 3.46611628287974e-13 |
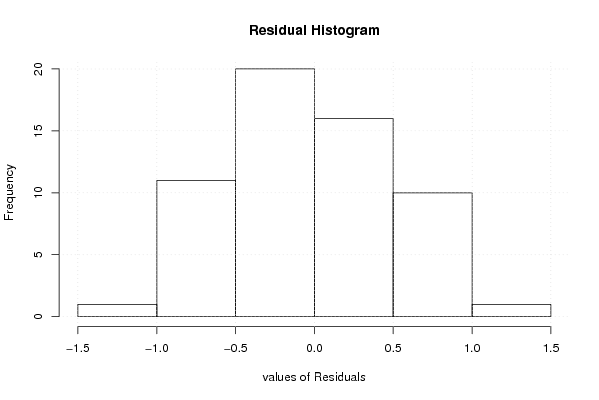
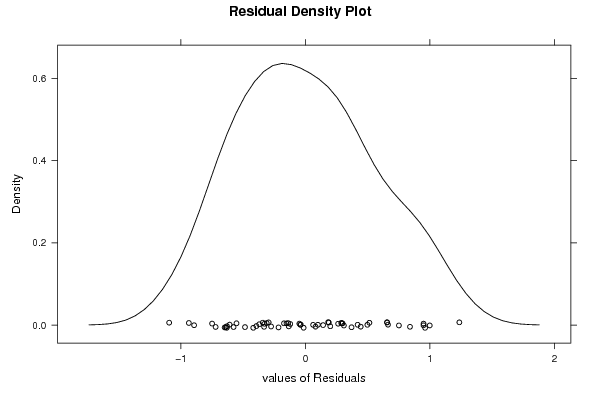
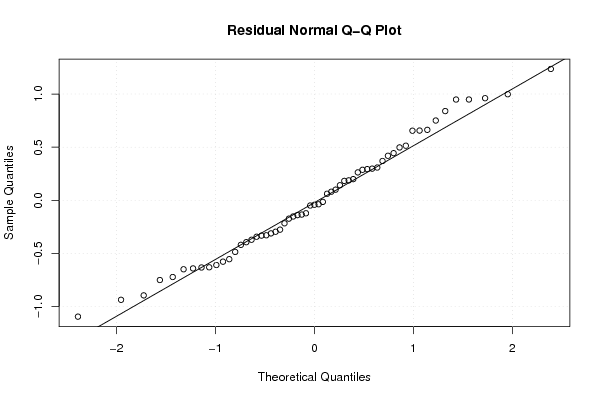
| Multiple Linear Regression - Residual Statistics | |
| Residual Standard Deviation | 0.652448276746705 |
| Sum Squared Residuals | 17.4532389070196 |
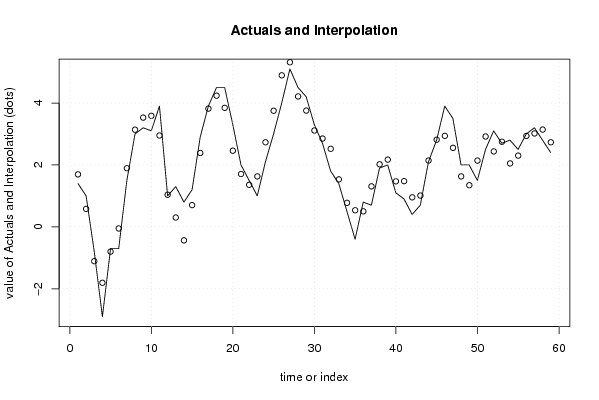
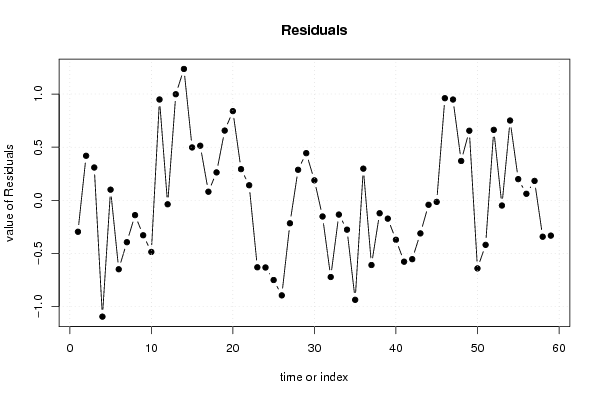
| Multiple Linear Regression - Actuals, Interpolation, and Residuals | |||
| Time or Index | Actuals | Interpolation Forecast | Residuals Prediction Error |
| 1 | 1.4 | 1.69537433284622 | -0.295374332846218 |
| 2 | 1 | 0.580668754581649 | 0.419331245418351 |
| 3 | -0.8 | -1.10880937473681 | 0.308809374736813 |
| 4 | -2.9 | -1.80593082733721 | -1.09406917266279 |
| 5 | -0.7 | -0.800457693143368 | 0.100457693143368 |
| 6 | -0.7 | -0.0516367899623158 | -0.648363210037684 |
| 7 | 1.5 | 1.89350865691398 | -0.393508656913976 |
| 8 | 3 | 3.13885245371768 | -0.138852453717678 |
| 9 | 3.2 | 3.52844798860734 | -0.328447988607336 |
| 10 | 3.1 | 3.58517733714265 | -0.485177337142647 |
| 11 | 3.9 | 2.95119319017667 | 0.94880680982333 |
| 12 | 1 | 1.03698395111164 | -0.0369839511116440 |
| 13 | 1.3 | 0.301626739981237 | 0.998373260018763 |
| 14 | 0.8 | -0.436138573574668 | 1.23613857357467 |
| 15 | 1.2 | 0.702294992165985 | 0.497705007834015 |
| 16 | 2.9 | 2.38601539806213 | 0.513984601937865 |
| 17 | 3.9 | 3.81878725782836 | 0.0812127421716392 |
| 18 | 4.5 | 4.23709537832613 | 0.262904621673867 |
| 19 | 4.5 | 3.84355487756027 | 0.656445122439733 |
| 20 | 3.3 | 2.46024613885832 | 0.839753861141675 |
| 21 | 2 | 1.70628127712671 | 0.293718722873288 |
| 22 | 1.5 | 1.35790000889298 | 0.142099991107018 |
| 23 | 1 | 1.62969885591364 | -0.629698855913642 |
| 24 | 2.1 | 2.73157877387005 | -0.631578773870052 |
| 25 | 3 | 3.74949494752284 | -0.749494947522844 |
| 26 | 4 | 4.89393075701504 | -0.893930757015044 |
| 27 | 5.1 | 5.31585923685243 | -0.215859236852432 |
| 28 | 4.5 | 4.21254655343733 | 0.287453446562665 |
| 29 | 4.2 | 3.75606154484843 | 0.443938455151569 |
| 30 | 3.3 | 3.11204999783437 | 0.187950002165628 |
| 31 | 2.7 | 2.85177167769766 | -0.151771677697659 |
| 32 | 1.8 | 2.52112645435853 | -0.721126454358529 |
| 33 | 1.4 | 1.53379727755809 | -0.133797277558085 |
| 34 | 0.5 | 0.775687310343635 | -0.275687310343635 |
| 35 | -0.4 | 0.53566161575785 | -0.93566161575785 |
| 36 | 0.8 | 0.501799590911343 | 0.298200409088657 |
| 37 | 0.7 | 1.30854677046173 | -0.60854677046173 |
| 38 | 1.9 | 2.02140922839143 | -0.121409228391434 |
| 39 | 2 | 2.17204376578178 | -0.172043765781784 |
| 40 | 1.1 | 1.47062995646826 | -0.370629956468263 |
| 41 | 0.9 | 1.47693244797496 | -0.576932447974963 |
| 42 | 0.4 | 0.953389827149578 | -0.553389827149578 |
| 43 | 0.7 | 1.01077478201472 | -0.310774782014717 |
| 44 | 2.1 | 2.14167762067835 | -0.0416776206783466 |
| 45 | 2.8 | 2.81436721277874 | -0.0143672127787354 |
| 46 | 3.9 | 2.93902496692128 | 0.960975033078722 |
| 47 | 3.5 | 2.55168051429118 | 0.948319485708824 |
| 48 | 2 | 1.62963768410696 | 0.370362315893035 |
| 49 | 2 | 1.34495720918797 | 0.655042790812029 |
| 50 | 1.5 | 2.14012983358654 | -0.64012983358654 |
| 51 | 2.5 | 2.91861137993661 | -0.418611379936613 |
| 52 | 3.1 | 2.43673891936948 | 0.663261080630523 |
| 53 | 2.7 | 2.74867644249161 | -0.048676442491612 |
| 54 | 2.8 | 2.04910158665223 | 0.750898413347767 |
| 55 | 2.5 | 2.30039000581338 | 0.199609994186619 |
| 56 | 3 | 2.93809733238712 | 0.0619026676128784 |
| 57 | 3.2 | 3.01710624392913 | 0.182893756070868 |
| 58 | 2.8 | 3.14221037669946 | -0.342210376699459 |
| 59 | 2.4 | 2.73176582386066 | -0.331765823860662 |
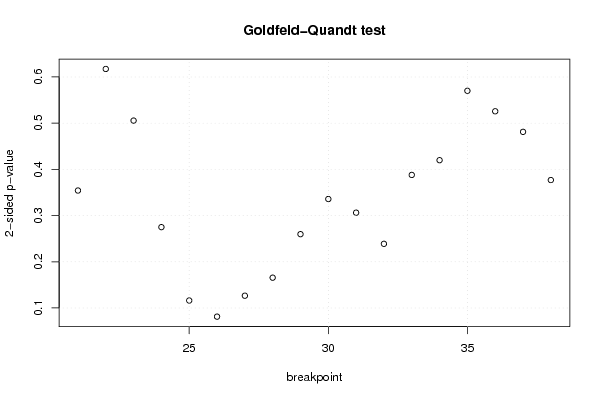
| Goldfeld-Quandt test for Heteroskedasticity | |||
| p-values | Alternative Hypothesis | ||
| breakpoint index | greater | 2-sided | less |
| 21 | 0.177094313427606 | 0.354188626855212 | 0.822905686572394 |
| 22 | 0.308649953654948 | 0.617299907309896 | 0.691350046345052 |
| 23 | 0.747236683545128 | 0.505526632909743 | 0.252763316454872 |
| 24 | 0.862532660557925 | 0.27493467888415 | 0.137467339442075 |
| 25 | 0.941941268801892 | 0.116117462396216 | 0.0580587311981079 |
| 26 | 0.959401576140302 | 0.0811968477193967 | 0.0405984238596984 |
| 27 | 0.936746165562014 | 0.126507668875972 | 0.0632538344379858 |
| 28 | 0.917228239572067 | 0.165543520855866 | 0.0827717604279328 |
| 29 | 0.870141574612876 | 0.259716850774248 | 0.129858425387124 |
| 30 | 0.832117082341307 | 0.335765835317387 | 0.167882917658693 |
| 31 | 0.84689236206211 | 0.306215275875778 | 0.153107637937889 |
| 32 | 0.880593932138611 | 0.238812135722777 | 0.119406067861389 |
| 33 | 0.80604211218109 | 0.387915775637819 | 0.193957887818910 |
| 34 | 0.790084724405089 | 0.419830551189822 | 0.209915275594911 |
| 35 | 0.714995365288611 | 0.570009269422778 | 0.285004634711389 |
| 36 | 0.737155611123788 | 0.525688777752423 | 0.262844388876212 |
| 37 | 0.759415047154490 | 0.481169905691019 | 0.240584952845510 |
| 38 | 0.811573196693806 | 0.376853606612389 | 0.188426803306194 |
| Meta Analysis of Goldfeld-Quandt test for Heteroskedasticity | |||
| Description | # significant tests | % significant tests | OK/NOK |
| 1% type I error level | 0 | 0 | OK |
| 5% type I error level | 0 | 0 | OK |
| 10% type I error level | 1 | 0.0555555555555556 | OK |