Free Statistics

of Irreproducible Research!

Author's title

multiple regression met 3 maanden minder, index van totale industriële prod...

Author*The author of this computation has been verified*
R Software Modulerwasp_multipleregression.wasp
Title produced by softwareMultiple Regression
Date of computationThu, 19 Nov 2009 08:54:48 -0700
Cite this page as followsStatistical Computations at FreeStatistics.org, Office for Research Development and Education, URL https://freestatistics.org/blog/index.php?v=date/2009/Nov/19/t12586461469p65xfi3hmu4u1s.htm/, Retrieved Wed, 24 Apr 2024 18:21:53 +0000
Statistical Computations at FreeStatistics.org, Office for Research Development and Education, URL https://freestatistics.org/blog/index.php?pk=57784, Retrieved Wed, 24 Apr 2024 18:21:53 +0000
QR Codes:

Original text written by user:
IsPrivate?No (this computation is public)
User-defined keywords
Estimated Impact190
Family? (F = Feedback message, R = changed R code, M = changed R Module, P = changed Parameters, D = changed Data)
-     [Multiple Regression] [Q1 The Seatbeltlaw] [2007-11-14 19:27:43] [8cd6641b921d30ebe00b648d1481bba0]
- RM D  [Multiple Regression] [Seatbelt] [2009-11-12 14:14:11] [b98453cac15ba1066b407e146608df68]
-   PD      [Multiple Regression] [multiple regressi...] [2009-11-19 15:54:48] [8f072ead2c7c0b3cf3fdae49bab9dd9b] [Current]
- R P         [Multiple Regression] [] [2009-12-20 09:23:55] [77c4589624c8ef9dff4002b842437335]
- RMPD          [Kendall tau Correlation Matrix] [Kendall tau corre...] [2009-12-20 19:30:31] [77c4589624c8ef9dff4002b842437335]
Feedback Forum

Post a new message
Dataseries X:
102.9	127.5	112.7	97	95.1
97.4	134.6	102.9	112.7	97
111.4	131.8	97.4	102.9	112.7
87.4	135.9	111.4	97.4	102.9
96.8	142.7	87.4	111.4	97.4
114.1	141.7	96.8	87.4	111.4
110.3	153.4	114.1	96.8	87.4
103.9	145	110.3	114.1	96.8
101.6	137.7	103.9	110.3	114.1
94.6	148.3	101.6	103.9	110.3
95.9	152.2	94.6	101.6	103.9
104.7	169.4	95.9	94.6	101.6
102.8	168.6	104.7	95.9	94.6
98.1	161.1	102.8	104.7	95.9
113.9	174.1	98.1	102.8	104.7
80.9	179	113.9	98.1	102.8
95.7	190.6	80.9	113.9	98.1
113.2	190	95.7	80.9	113.9
105.9	181.6	113.2	95.7	80.9
108.8	174.8	105.9	113.2	95.7
102.3	180.5	108.8	105.9	113.2
99	196.8	102.3	108.8	105.9
100.7	193.8	99	102.3	108.8
115.5	197	100.7	99	102.3
100.7	216.3	115.5	100.7	99
109.9	221.4	100.7	115.5	100.7
114.6	217.9	109.9	100.7	115.5
85.4	229.7	114.6	109.9	100.7
100.5	227.4	85.4	114.6	109.9
114.8	204.2	100.5	85.4	114.6
116.5	196.6	114.8	100.5	85.4
112.9	198.8	116.5	114.8	100.5
102	207.5	112.9	116.5	114.8
106	190.7	102	112.9	116.5
105.3	201.6	106	102	112.9
118.8	210.5	105.3	106	102
106.1	223.5	118.8	105.3	106
109.3	223.8	106.1	118.8	105.3
117.2	231.2	109.3	106.1	118.8
92.5	244	117.2	109.3	106.1
104.2	234.7	92.5	117.2	109.3
112.5	250.2	104.2	92.5	117.2
122.4	265.7	112.5	104.2	92.5
113.3	287.6	122.4	112.5	104.2
100	283.3	113.3	122.4	112.5
110.7	295.4	100	113.3	122.4
112.8	312.3	110.7	100	113.3
109.8	333.8	112.8	110.7	100
117.3	347.7	109.8	112.8	110.7
109.1	383.2	117.3	109.8	112.8
115.9	407.1	109.1	117.3	109.8
96	413.6	115.9	109.1	117.3
99.8	362.7	96	115.9	109.1
116.8	321.9	99.8	96	115.9
115.7	239.4	116.8	99.8	96
99.4	191	115.7	116.8	99.8
94.3	159.7	99.4	115.7	116.8
91	163.4	94.3	99.4	115.7


Summary of computational transaction
Raw Inputview raw input (R code)
Raw Outputview raw output of R engine
Computing time3 seconds
R Server'Gwilym Jenkins' @ 72.249.127.135

\begin{tabular}{lllllllll}
\hline
Summary of computational transaction \tabularnewline
Raw Input & view raw input (R code)  \tabularnewline
Raw Output & view raw output of R engine  \tabularnewline
Computing time & 3 seconds \tabularnewline
R Server & 'Gwilym Jenkins' @ 72.249.127.135 \tabularnewline
\hline
\end{tabular}
%Source: https://freestatistics.org/blog/index.php?pk=57784&T=0

[TABLE]
[ROW][C]Summary of computational transaction[/C][/ROW]
[ROW][C]Raw Input[/C][C]view raw input (R code) [/C][/ROW]
[ROW][C]Raw Output[/C][C]view raw output of R engine [/C][/ROW]
[ROW][C]Computing time[/C][C]3 seconds[/C][/ROW]
[ROW][C]R Server[/C][C]'Gwilym Jenkins' @ 72.249.127.135[/C][/ROW]
[/TABLE]
Source: https://freestatistics.org/blog/index.php?pk=57784&T=0

Globally Unique Identifier (entire table): ba.freestatistics.org/blog/index.php?pk=57784&T=0

As an alternative you can also use a QR Code:  

The GUIDs for individual cells are displayed in the table below:

Summary of computational transaction
Raw Inputview raw input (R code)
Raw Outputview raw output of R engine
Computing time3 seconds
R Server'Gwilym Jenkins' @ 72.249.127.135


Multiple Linear Regression - Estimated Regression Equation
tot.ind.prod.index[t] = + 136.369545246487 + 0.0530843258192137prijsindex.grondst.incl.energie[t] -0.0119367169882655`y(t-1)`[t] -0.301068823246038`y(t-2)`[t] -0.0891857427440547`y(t-3)`[t] + e[t]

\begin{tabular}{lllllllll}
\hline
Multiple Linear Regression - Estimated Regression Equation \tabularnewline
tot.ind.prod.index[t] =  +  136.369545246487 +  0.0530843258192137prijsindex.grondst.incl.energie[t] -0.0119367169882655`y(t-1)`[t] -0.301068823246038`y(t-2)`[t] -0.0891857427440547`y(t-3)`[t]  + e[t] \tabularnewline
\hline
\end{tabular}
%Source: https://freestatistics.org/blog/index.php?pk=57784&T=1

[TABLE]
[ROW][C]Multiple Linear Regression - Estimated Regression Equation[/C][/ROW]
[ROW][C]tot.ind.prod.index[t] =  +  136.369545246487 +  0.0530843258192137prijsindex.grondst.incl.energie[t] -0.0119367169882655`y(t-1)`[t] -0.301068823246038`y(t-2)`[t] -0.0891857427440547`y(t-3)`[t]  + e[t][/C][/ROW]
[/TABLE]
Source: https://freestatistics.org/blog/index.php?pk=57784&T=1

Globally Unique Identifier (entire table): ba.freestatistics.org/blog/index.php?pk=57784&T=1

As an alternative you can also use a QR Code:  

The GUIDs for individual cells are displayed in the table below:

Multiple Linear Regression - Estimated Regression Equation
tot.ind.prod.index[t] = + 136.369545246487 + 0.0530843258192137prijsindex.grondst.incl.energie[t] -0.0119367169882655`y(t-1)`[t] -0.301068823246038`y(t-2)`[t] -0.0891857427440547`y(t-3)`[t] + e[t]


Multiple Linear Regression - Ordinary Least Squares
VariableParameterS.D.T-STATH0: parameter = 02-tail p-value1-tail p-value
(Intercept)136.36954524648727.0467435.0426e-063e-06
prijsindex.grondst.incl.energie0.05308432581921370.0192452.75830.0079560.003978
`y(t-1)`-0.01193671698826550.141427-0.08440.9330550.466527
`y(t-2)`-0.3010688232460380.134349-2.24090.0292430.014622
`y(t-3)`-0.08918574274405470.142868-0.62430.535140.26757

\begin{tabular}{lllllllll}
\hline
Multiple Linear Regression - Ordinary Least Squares \tabularnewline
Variable & Parameter & S.D. & T-STATH0: parameter = 0 & 2-tail p-value & 1-tail p-value \tabularnewline
(Intercept) & 136.369545246487 & 27.046743 & 5.042 & 6e-06 & 3e-06 \tabularnewline
prijsindex.grondst.incl.energie & 0.0530843258192137 & 0.019245 & 2.7583 & 0.007956 & 0.003978 \tabularnewline
`y(t-1)` & -0.0119367169882655 & 0.141427 & -0.0844 & 0.933055 & 0.466527 \tabularnewline
`y(t-2)` & -0.301068823246038 & 0.134349 & -2.2409 & 0.029243 & 0.014622 \tabularnewline
`y(t-3)` & -0.0891857427440547 & 0.142868 & -0.6243 & 0.53514 & 0.26757 \tabularnewline
\hline
\end{tabular}
%Source: https://freestatistics.org/blog/index.php?pk=57784&T=2

[TABLE]
[ROW][C]Multiple Linear Regression - Ordinary Least Squares[/C][/ROW]
[ROW][C]Variable[/C][C]Parameter[/C][C]S.D.[/C][C]T-STATH0: parameter = 0[/C][C]2-tail p-value[/C][C]1-tail p-value[/C][/ROW]
[ROW][C](Intercept)[/C][C]136.369545246487[/C][C]27.046743[/C][C]5.042[/C][C]6e-06[/C][C]3e-06[/C][/ROW]
[ROW][C]prijsindex.grondst.incl.energie[/C][C]0.0530843258192137[/C][C]0.019245[/C][C]2.7583[/C][C]0.007956[/C][C]0.003978[/C][/ROW]
[ROW][C]`y(t-1)`[/C][C]-0.0119367169882655[/C][C]0.141427[/C][C]-0.0844[/C][C]0.933055[/C][C]0.466527[/C][/ROW]
[ROW][C]`y(t-2)`[/C][C]-0.301068823246038[/C][C]0.134349[/C][C]-2.2409[/C][C]0.029243[/C][C]0.014622[/C][/ROW]
[ROW][C]`y(t-3)`[/C][C]-0.0891857427440547[/C][C]0.142868[/C][C]-0.6243[/C][C]0.53514[/C][C]0.26757[/C][/ROW]
[/TABLE]
Source: https://freestatistics.org/blog/index.php?pk=57784&T=2

Globally Unique Identifier (entire table): ba.freestatistics.org/blog/index.php?pk=57784&T=2

As an alternative you can also use a QR Code:  

The GUIDs for individual cells are displayed in the table below:

Multiple Linear Regression - Ordinary Least Squares
VariableParameterS.D.T-STATH0: parameter = 02-tail p-value1-tail p-value
(Intercept)136.36954524648727.0467435.0426e-063e-06
prijsindex.grondst.incl.energie0.05308432581921370.0192452.75830.0079560.003978
`y(t-1)`-0.01193671698826550.141427-0.08440.9330550.466527
`y(t-2)`-0.3010688232460380.134349-2.24090.0292430.014622
`y(t-3)`-0.08918574274405470.142868-0.62430.535140.26757


Multiple Linear Regression - Regression Statistics
Multiple R0.411787166404869
R-squared0.169568670415751
Adjusted R-squared0.106894607805619
F-TEST (value)2.70556372690508
F-TEST (DF numerator)4
F-TEST (DF denominator)53
p-value0.039939568367107
Multiple Linear Regression - Residual Statistics
Residual Standard Deviation8.63250883290268
Sum Squared Residuals3949.57106375757

\begin{tabular}{lllllllll}
\hline
Multiple Linear Regression - Regression Statistics \tabularnewline
Multiple R & 0.411787166404869 \tabularnewline
R-squared & 0.169568670415751 \tabularnewline
Adjusted R-squared & 0.106894607805619 \tabularnewline
F-TEST (value) & 2.70556372690508 \tabularnewline
F-TEST (DF numerator) & 4 \tabularnewline
F-TEST (DF denominator) & 53 \tabularnewline
p-value & 0.039939568367107 \tabularnewline
Multiple Linear Regression - Residual Statistics \tabularnewline
Residual Standard Deviation & 8.63250883290268 \tabularnewline
Sum Squared Residuals & 3949.57106375757 \tabularnewline
\hline
\end{tabular}
%Source: https://freestatistics.org/blog/index.php?pk=57784&T=3

[TABLE]
[ROW][C]Multiple Linear Regression - Regression Statistics[/C][/ROW]
[ROW][C]Multiple R[/C][C]0.411787166404869[/C][/ROW]
[ROW][C]R-squared[/C][C]0.169568670415751[/C][/ROW]
[ROW][C]Adjusted R-squared[/C][C]0.106894607805619[/C][/ROW]
[ROW][C]F-TEST (value)[/C][C]2.70556372690508[/C][/ROW]
[ROW][C]F-TEST (DF numerator)[/C][C]4[/C][/ROW]
[ROW][C]F-TEST (DF denominator)[/C][C]53[/C][/ROW]
[ROW][C]p-value[/C][C]0.039939568367107[/C][/ROW]
[ROW][C]Multiple Linear Regression - Residual Statistics[/C][/ROW]
[ROW][C]Residual Standard Deviation[/C][C]8.63250883290268[/C][/ROW]
[ROW][C]Sum Squared Residuals[/C][C]3949.57106375757[/C][/ROW]
[/TABLE]
Source: https://freestatistics.org/blog/index.php?pk=57784&T=3

Globally Unique Identifier (entire table): ba.freestatistics.org/blog/index.php?pk=57784&T=3

As an alternative you can also use a QR Code:  

The GUIDs for individual cells are displayed in the table below:

Multiple Linear Regression - Regression Statistics
Multiple R0.411787166404869
R-squared0.169568670415751
Adjusted R-squared0.106894607805619
F-TEST (value)2.70556372690508
F-TEST (DF numerator)4
F-TEST (DF denominator)53
p-value0.039939568367107
Multiple Linear Regression - Residual Statistics
Residual Standard Deviation8.63250883290268
Sum Squared Residuals3949.57106375757


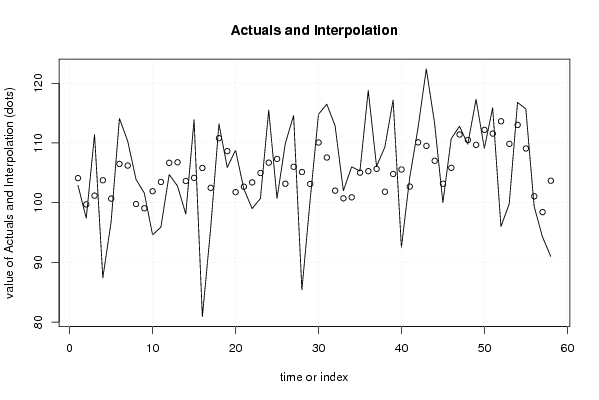
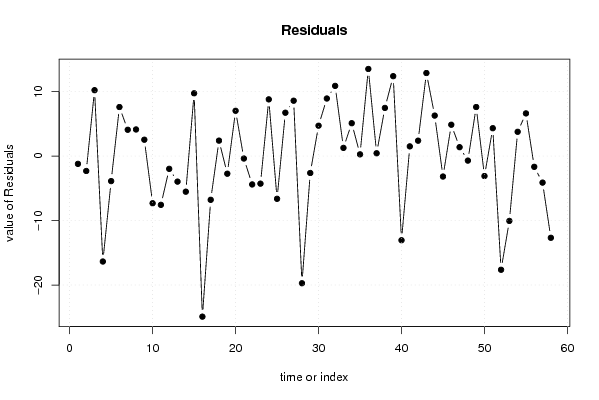
Multiple Linear Regression - Actuals, Interpolation, and Residuals
Time or IndexActualsInterpolationForecastResidualsPrediction Error
1102.9104.107288794034-1.20728879403354
297.499.7049338976584-2.30493389765837
3111.4101.17220803553010.2277919644704
487.4103.752638540298-16.3526385402976
596.8100.675651223234-3.87565122323435
6114.1106.4874131172147.6125868827864
7110.3106.2124054127464.08759458725404
8103.999.76501997646944.13498002353061
9101.699.05504756557682.54495243442316
1094.6101.910942159536-7.31094215953557
1195.9103.464775096176-7.56477509617619
12104.7106.674916739216-1.97491673921552
13102.8106.760316898052-3.96031689805194
1498.1103.619517106553-5.51951710655314
15113.9104.1529121400689.74708785993245
1680.9105.808901588637-24.9089015886372
1795.7102.480877012362-6.78087701236248
18113.2110.7984994372082.40150056279218
19105.9108.631009479544-2.73100947954421
20108.8101.7685206985707.03147930142977
21102.3102.673536788149-0.3735367881489
2299103.394356294044-4.3943562940439
23100.7104.972803179789-4.27280317978902
24115.5106.6956150480798.80438495192126
25100.7107.325975076500-6.62597507650034
26109.9103.1659342028986.7340657971016
27114.6106.0061908576688.59380914233152
2885.4105.126599151239-19.7265991512388
29100.5103.117525035410-2.61752503541028
30114.8110.0777608977694.72223910223102
31116.5107.5617094257228.93829057427803
32112.9102.00621363579110.8937863642094
33102100.7238463308171.27615366918271
34106100.8943718732475.10562812675257
35105.3105.0279630039840.272036996015781
36118.8105.27661850859313.5233814914069
37106.1105.6595742701970.440425729802744
38109.3101.8250967797937.47490322020669
39117.2104.79928982467312.400710175327
4092.5105.553707829414-13.0537078294138
41104.2102.6910224284811.50897757151942
42112.5110.1060024564152.39399754358519
43122.4109.51011736941012.8898826305905
44113.3107.0121461836196.28785381638108
45100103.171684692278-3.17168469227807
46110.7105.8295508090074.8704491909927
47112.8111.4147586517211.38524134827921
48109.8110.495738520922-0.695738520921836
49117.3109.6828888245967.61711117540436
50109.1112.193773423741-3.09377342374134
51115.9111.5699109440114.33008905598881
5296113.633660666353-17.633660666353
5399.8109.853264242650-10.0532642426497
54116.8113.0268707566073.77312924339306
55115.7109.0752244399936.62477556000697
5699.4101.061997641420-1.66199764142012
5794.398.4100448091092-4.11004480910918
5891103.672860207209-12.6728602072093

\begin{tabular}{lllllllll}
\hline
Multiple Linear Regression - Actuals, Interpolation, and Residuals \tabularnewline
Time or Index & Actuals & InterpolationForecast & ResidualsPrediction Error \tabularnewline
1 & 102.9 & 104.107288794034 & -1.20728879403354 \tabularnewline
2 & 97.4 & 99.7049338976584 & -2.30493389765837 \tabularnewline
3 & 111.4 & 101.172208035530 & 10.2277919644704 \tabularnewline
4 & 87.4 & 103.752638540298 & -16.3526385402976 \tabularnewline
5 & 96.8 & 100.675651223234 & -3.87565122323435 \tabularnewline
6 & 114.1 & 106.487413117214 & 7.6125868827864 \tabularnewline
7 & 110.3 & 106.212405412746 & 4.08759458725404 \tabularnewline
8 & 103.9 & 99.7650199764694 & 4.13498002353061 \tabularnewline
9 & 101.6 & 99.0550475655768 & 2.54495243442316 \tabularnewline
10 & 94.6 & 101.910942159536 & -7.31094215953557 \tabularnewline
11 & 95.9 & 103.464775096176 & -7.56477509617619 \tabularnewline
12 & 104.7 & 106.674916739216 & -1.97491673921552 \tabularnewline
13 & 102.8 & 106.760316898052 & -3.96031689805194 \tabularnewline
14 & 98.1 & 103.619517106553 & -5.51951710655314 \tabularnewline
15 & 113.9 & 104.152912140068 & 9.74708785993245 \tabularnewline
16 & 80.9 & 105.808901588637 & -24.9089015886372 \tabularnewline
17 & 95.7 & 102.480877012362 & -6.78087701236248 \tabularnewline
18 & 113.2 & 110.798499437208 & 2.40150056279218 \tabularnewline
19 & 105.9 & 108.631009479544 & -2.73100947954421 \tabularnewline
20 & 108.8 & 101.768520698570 & 7.03147930142977 \tabularnewline
21 & 102.3 & 102.673536788149 & -0.3735367881489 \tabularnewline
22 & 99 & 103.394356294044 & -4.3943562940439 \tabularnewline
23 & 100.7 & 104.972803179789 & -4.27280317978902 \tabularnewline
24 & 115.5 & 106.695615048079 & 8.80438495192126 \tabularnewline
25 & 100.7 & 107.325975076500 & -6.62597507650034 \tabularnewline
26 & 109.9 & 103.165934202898 & 6.7340657971016 \tabularnewline
27 & 114.6 & 106.006190857668 & 8.59380914233152 \tabularnewline
28 & 85.4 & 105.126599151239 & -19.7265991512388 \tabularnewline
29 & 100.5 & 103.117525035410 & -2.61752503541028 \tabularnewline
30 & 114.8 & 110.077760897769 & 4.72223910223102 \tabularnewline
31 & 116.5 & 107.561709425722 & 8.93829057427803 \tabularnewline
32 & 112.9 & 102.006213635791 & 10.8937863642094 \tabularnewline
33 & 102 & 100.723846330817 & 1.27615366918271 \tabularnewline
34 & 106 & 100.894371873247 & 5.10562812675257 \tabularnewline
35 & 105.3 & 105.027963003984 & 0.272036996015781 \tabularnewline
36 & 118.8 & 105.276618508593 & 13.5233814914069 \tabularnewline
37 & 106.1 & 105.659574270197 & 0.440425729802744 \tabularnewline
38 & 109.3 & 101.825096779793 & 7.47490322020669 \tabularnewline
39 & 117.2 & 104.799289824673 & 12.400710175327 \tabularnewline
40 & 92.5 & 105.553707829414 & -13.0537078294138 \tabularnewline
41 & 104.2 & 102.691022428481 & 1.50897757151942 \tabularnewline
42 & 112.5 & 110.106002456415 & 2.39399754358519 \tabularnewline
43 & 122.4 & 109.510117369410 & 12.8898826305905 \tabularnewline
44 & 113.3 & 107.012146183619 & 6.28785381638108 \tabularnewline
45 & 100 & 103.171684692278 & -3.17168469227807 \tabularnewline
46 & 110.7 & 105.829550809007 & 4.8704491909927 \tabularnewline
47 & 112.8 & 111.414758651721 & 1.38524134827921 \tabularnewline
48 & 109.8 & 110.495738520922 & -0.695738520921836 \tabularnewline
49 & 117.3 & 109.682888824596 & 7.61711117540436 \tabularnewline
50 & 109.1 & 112.193773423741 & -3.09377342374134 \tabularnewline
51 & 115.9 & 111.569910944011 & 4.33008905598881 \tabularnewline
52 & 96 & 113.633660666353 & -17.633660666353 \tabularnewline
53 & 99.8 & 109.853264242650 & -10.0532642426497 \tabularnewline
54 & 116.8 & 113.026870756607 & 3.77312924339306 \tabularnewline
55 & 115.7 & 109.075224439993 & 6.62477556000697 \tabularnewline
56 & 99.4 & 101.061997641420 & -1.66199764142012 \tabularnewline
57 & 94.3 & 98.4100448091092 & -4.11004480910918 \tabularnewline
58 & 91 & 103.672860207209 & -12.6728602072093 \tabularnewline
\hline
\end{tabular}
%Source: https://freestatistics.org/blog/index.php?pk=57784&T=4

[TABLE]
[ROW][C]Multiple Linear Regression - Actuals, Interpolation, and Residuals[/C][/ROW]
[ROW][C]Time or Index[/C][C]Actuals[/C][C]InterpolationForecast[/C][C]ResidualsPrediction Error[/C][/ROW]
[ROW][C]1[/C][C]102.9[/C][C]104.107288794034[/C][C]-1.20728879403354[/C][/ROW]
[ROW][C]2[/C][C]97.4[/C][C]99.7049338976584[/C][C]-2.30493389765837[/C][/ROW]
[ROW][C]3[/C][C]111.4[/C][C]101.172208035530[/C][C]10.2277919644704[/C][/ROW]
[ROW][C]4[/C][C]87.4[/C][C]103.752638540298[/C][C]-16.3526385402976[/C][/ROW]
[ROW][C]5[/C][C]96.8[/C][C]100.675651223234[/C][C]-3.87565122323435[/C][/ROW]
[ROW][C]6[/C][C]114.1[/C][C]106.487413117214[/C][C]7.6125868827864[/C][/ROW]
[ROW][C]7[/C][C]110.3[/C][C]106.212405412746[/C][C]4.08759458725404[/C][/ROW]
[ROW][C]8[/C][C]103.9[/C][C]99.7650199764694[/C][C]4.13498002353061[/C][/ROW]
[ROW][C]9[/C][C]101.6[/C][C]99.0550475655768[/C][C]2.54495243442316[/C][/ROW]
[ROW][C]10[/C][C]94.6[/C][C]101.910942159536[/C][C]-7.31094215953557[/C][/ROW]
[ROW][C]11[/C][C]95.9[/C][C]103.464775096176[/C][C]-7.56477509617619[/C][/ROW]
[ROW][C]12[/C][C]104.7[/C][C]106.674916739216[/C][C]-1.97491673921552[/C][/ROW]
[ROW][C]13[/C][C]102.8[/C][C]106.760316898052[/C][C]-3.96031689805194[/C][/ROW]
[ROW][C]14[/C][C]98.1[/C][C]103.619517106553[/C][C]-5.51951710655314[/C][/ROW]
[ROW][C]15[/C][C]113.9[/C][C]104.152912140068[/C][C]9.74708785993245[/C][/ROW]
[ROW][C]16[/C][C]80.9[/C][C]105.808901588637[/C][C]-24.9089015886372[/C][/ROW]
[ROW][C]17[/C][C]95.7[/C][C]102.480877012362[/C][C]-6.78087701236248[/C][/ROW]
[ROW][C]18[/C][C]113.2[/C][C]110.798499437208[/C][C]2.40150056279218[/C][/ROW]
[ROW][C]19[/C][C]105.9[/C][C]108.631009479544[/C][C]-2.73100947954421[/C][/ROW]
[ROW][C]20[/C][C]108.8[/C][C]101.768520698570[/C][C]7.03147930142977[/C][/ROW]
[ROW][C]21[/C][C]102.3[/C][C]102.673536788149[/C][C]-0.3735367881489[/C][/ROW]
[ROW][C]22[/C][C]99[/C][C]103.394356294044[/C][C]-4.3943562940439[/C][/ROW]
[ROW][C]23[/C][C]100.7[/C][C]104.972803179789[/C][C]-4.27280317978902[/C][/ROW]
[ROW][C]24[/C][C]115.5[/C][C]106.695615048079[/C][C]8.80438495192126[/C][/ROW]
[ROW][C]25[/C][C]100.7[/C][C]107.325975076500[/C][C]-6.62597507650034[/C][/ROW]
[ROW][C]26[/C][C]109.9[/C][C]103.165934202898[/C][C]6.7340657971016[/C][/ROW]
[ROW][C]27[/C][C]114.6[/C][C]106.006190857668[/C][C]8.59380914233152[/C][/ROW]
[ROW][C]28[/C][C]85.4[/C][C]105.126599151239[/C][C]-19.7265991512388[/C][/ROW]
[ROW][C]29[/C][C]100.5[/C][C]103.117525035410[/C][C]-2.61752503541028[/C][/ROW]
[ROW][C]30[/C][C]114.8[/C][C]110.077760897769[/C][C]4.72223910223102[/C][/ROW]
[ROW][C]31[/C][C]116.5[/C][C]107.561709425722[/C][C]8.93829057427803[/C][/ROW]
[ROW][C]32[/C][C]112.9[/C][C]102.006213635791[/C][C]10.8937863642094[/C][/ROW]
[ROW][C]33[/C][C]102[/C][C]100.723846330817[/C][C]1.27615366918271[/C][/ROW]
[ROW][C]34[/C][C]106[/C][C]100.894371873247[/C][C]5.10562812675257[/C][/ROW]
[ROW][C]35[/C][C]105.3[/C][C]105.027963003984[/C][C]0.272036996015781[/C][/ROW]
[ROW][C]36[/C][C]118.8[/C][C]105.276618508593[/C][C]13.5233814914069[/C][/ROW]
[ROW][C]37[/C][C]106.1[/C][C]105.659574270197[/C][C]0.440425729802744[/C][/ROW]
[ROW][C]38[/C][C]109.3[/C][C]101.825096779793[/C][C]7.47490322020669[/C][/ROW]
[ROW][C]39[/C][C]117.2[/C][C]104.799289824673[/C][C]12.400710175327[/C][/ROW]
[ROW][C]40[/C][C]92.5[/C][C]105.553707829414[/C][C]-13.0537078294138[/C][/ROW]
[ROW][C]41[/C][C]104.2[/C][C]102.691022428481[/C][C]1.50897757151942[/C][/ROW]
[ROW][C]42[/C][C]112.5[/C][C]110.106002456415[/C][C]2.39399754358519[/C][/ROW]
[ROW][C]43[/C][C]122.4[/C][C]109.510117369410[/C][C]12.8898826305905[/C][/ROW]
[ROW][C]44[/C][C]113.3[/C][C]107.012146183619[/C][C]6.28785381638108[/C][/ROW]
[ROW][C]45[/C][C]100[/C][C]103.171684692278[/C][C]-3.17168469227807[/C][/ROW]
[ROW][C]46[/C][C]110.7[/C][C]105.829550809007[/C][C]4.8704491909927[/C][/ROW]
[ROW][C]47[/C][C]112.8[/C][C]111.414758651721[/C][C]1.38524134827921[/C][/ROW]
[ROW][C]48[/C][C]109.8[/C][C]110.495738520922[/C][C]-0.695738520921836[/C][/ROW]
[ROW][C]49[/C][C]117.3[/C][C]109.682888824596[/C][C]7.61711117540436[/C][/ROW]
[ROW][C]50[/C][C]109.1[/C][C]112.193773423741[/C][C]-3.09377342374134[/C][/ROW]
[ROW][C]51[/C][C]115.9[/C][C]111.569910944011[/C][C]4.33008905598881[/C][/ROW]
[ROW][C]52[/C][C]96[/C][C]113.633660666353[/C][C]-17.633660666353[/C][/ROW]
[ROW][C]53[/C][C]99.8[/C][C]109.853264242650[/C][C]-10.0532642426497[/C][/ROW]
[ROW][C]54[/C][C]116.8[/C][C]113.026870756607[/C][C]3.77312924339306[/C][/ROW]
[ROW][C]55[/C][C]115.7[/C][C]109.075224439993[/C][C]6.62477556000697[/C][/ROW]
[ROW][C]56[/C][C]99.4[/C][C]101.061997641420[/C][C]-1.66199764142012[/C][/ROW]
[ROW][C]57[/C][C]94.3[/C][C]98.4100448091092[/C][C]-4.11004480910918[/C][/ROW]
[ROW][C]58[/C][C]91[/C][C]103.672860207209[/C][C]-12.6728602072093[/C][/ROW]
[/TABLE]
Source: https://freestatistics.org/blog/index.php?pk=57784&T=4

Globally Unique Identifier (entire table): ba.freestatistics.org/blog/index.php?pk=57784&T=4

As an alternative you can also use a QR Code:  

The GUIDs for individual cells are displayed in the table below:

Multiple Linear Regression - Actuals, Interpolation, and Residuals
Time or IndexActualsInterpolationForecastResidualsPrediction Error
1102.9104.107288794034-1.20728879403354
297.499.7049338976584-2.30493389765837
3111.4101.17220803553010.2277919644704
487.4103.752638540298-16.3526385402976
596.8100.675651223234-3.87565122323435
6114.1106.4874131172147.6125868827864
7110.3106.2124054127464.08759458725404
8103.999.76501997646944.13498002353061
9101.699.05504756557682.54495243442316
1094.6101.910942159536-7.31094215953557
1195.9103.464775096176-7.56477509617619
12104.7106.674916739216-1.97491673921552
13102.8106.760316898052-3.96031689805194
1498.1103.619517106553-5.51951710655314
15113.9104.1529121400689.74708785993245
1680.9105.808901588637-24.9089015886372
1795.7102.480877012362-6.78087701236248
18113.2110.7984994372082.40150056279218
19105.9108.631009479544-2.73100947954421
20108.8101.7685206985707.03147930142977
21102.3102.673536788149-0.3735367881489
2299103.394356294044-4.3943562940439
23100.7104.972803179789-4.27280317978902
24115.5106.6956150480798.80438495192126
25100.7107.325975076500-6.62597507650034
26109.9103.1659342028986.7340657971016
27114.6106.0061908576688.59380914233152
2885.4105.126599151239-19.7265991512388
29100.5103.117525035410-2.61752503541028
30114.8110.0777608977694.72223910223102
31116.5107.5617094257228.93829057427803
32112.9102.00621363579110.8937863642094
33102100.7238463308171.27615366918271
34106100.8943718732475.10562812675257
35105.3105.0279630039840.272036996015781
36118.8105.27661850859313.5233814914069
37106.1105.6595742701970.440425729802744
38109.3101.8250967797937.47490322020669
39117.2104.79928982467312.400710175327
4092.5105.553707829414-13.0537078294138
41104.2102.6910224284811.50897757151942
42112.5110.1060024564152.39399754358519
43122.4109.51011736941012.8898826305905
44113.3107.0121461836196.28785381638108
45100103.171684692278-3.17168469227807
46110.7105.8295508090074.8704491909927
47112.8111.4147586517211.38524134827921
48109.8110.495738520922-0.695738520921836
49117.3109.6828888245967.61711117540436
50109.1112.193773423741-3.09377342374134
51115.9111.5699109440114.33008905598881
5296113.633660666353-17.633660666353
5399.8109.853264242650-10.0532642426497
54116.8113.0268707566073.77312924339306
55115.7109.0752244399936.62477556000697
5699.4101.061997641420-1.66199764142012
5794.398.4100448091092-4.11004480910918
5891103.672860207209-12.6728602072093


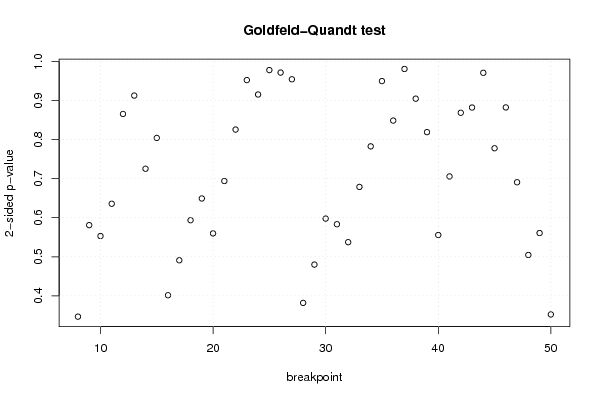
Goldfeld-Quandt test for Heteroskedasticity
p-valuesAlternative Hypothesis
breakpoint indexgreater2-sidedless
80.8265918838883390.3468162322233230.173408116111661
90.7095684965599290.5808630068801410.290431503440071
100.7234941370881910.5530117258236180.276505862911809
110.6821941296399520.6356117407200950.317805870360048
120.5673191976786590.8653616046426820.432680802321341
130.4562084204818850.912416840963770.543791579518115
140.3626370298480000.7252740596959990.637362970152
150.4020057619664120.8040115239328230.597994238033588
160.7991737234081670.4016525531836650.200826276591833
170.7544867790922450.4910264418155090.245513220907755
180.703260033258950.5934799334821010.296739966741050
190.6754123648698840.6491752702602320.324587635130116
200.7200736025585770.5598527948828470.279926397441423
210.6531093260118310.6937813479763380.346890673988169
220.5872972706831410.8254054586337190.412702729316860
230.5239628332430080.9520743335139840.476037166756992
240.5424395214774520.9151209570450970.457560478522548
250.5112166883572020.9775666232855950.488783311642798
260.4856243881352350.9712487762704710.514375611864765
270.4770395354532080.9540790709064160.522960464546792
280.8089950862111750.3820098275776490.191004913788825
290.7599924801039820.4800150397920360.240007519896018
300.7011726006298470.5976547987403050.298827399370153
310.7083909365558660.5832181268882680.291609063444134
320.731342396707590.537315206584820.26865760329241
330.6606599868584240.6786800262831520.339340013141576
340.6087644597979760.7824710804040470.391235540202024
350.5252385250863530.9495229498272930.474761474913647
360.575776814813260.848446370373480.42422318518674
370.4902509962561430.9805019925122870.509749003743857
380.4522385972372220.9044771944744440.547761402762778
390.5905679132507760.818864173498450.409432086749225
400.7221570368657140.5556859262685710.277842963134286
410.6472567371111280.7054865257777440.352743262888872
420.5657883471137080.8684233057725830.434211652886292
430.5591098701100450.8817802597799110.440890129889956
440.4853248771318560.9706497542637110.514675122868144
450.3887975578894890.7775951157789780.611202442110511
460.4410137208566880.8820274417133770.558986279143312
470.3453262418482140.6906524836964290.654673758151786
480.2522776638992360.5045553277984710.747722336100764
490.2803584155800200.5607168311600410.71964158441998
500.1762376414911020.3524752829822040.823762358508898

\begin{tabular}{lllllllll}
\hline
Goldfeld-Quandt test for Heteroskedasticity \tabularnewline
p-values & Alternative Hypothesis \tabularnewline
breakpoint index & greater & 2-sided & less \tabularnewline
8 & 0.826591883888339 & 0.346816232223323 & 0.173408116111661 \tabularnewline
9 & 0.709568496559929 & 0.580863006880141 & 0.290431503440071 \tabularnewline
10 & 0.723494137088191 & 0.553011725823618 & 0.276505862911809 \tabularnewline
11 & 0.682194129639952 & 0.635611740720095 & 0.317805870360048 \tabularnewline
12 & 0.567319197678659 & 0.865361604642682 & 0.432680802321341 \tabularnewline
13 & 0.456208420481885 & 0.91241684096377 & 0.543791579518115 \tabularnewline
14 & 0.362637029848000 & 0.725274059695999 & 0.637362970152 \tabularnewline
15 & 0.402005761966412 & 0.804011523932823 & 0.597994238033588 \tabularnewline
16 & 0.799173723408167 & 0.401652553183665 & 0.200826276591833 \tabularnewline
17 & 0.754486779092245 & 0.491026441815509 & 0.245513220907755 \tabularnewline
18 & 0.70326003325895 & 0.593479933482101 & 0.296739966741050 \tabularnewline
19 & 0.675412364869884 & 0.649175270260232 & 0.324587635130116 \tabularnewline
20 & 0.720073602558577 & 0.559852794882847 & 0.279926397441423 \tabularnewline
21 & 0.653109326011831 & 0.693781347976338 & 0.346890673988169 \tabularnewline
22 & 0.587297270683141 & 0.825405458633719 & 0.412702729316860 \tabularnewline
23 & 0.523962833243008 & 0.952074333513984 & 0.476037166756992 \tabularnewline
24 & 0.542439521477452 & 0.915120957045097 & 0.457560478522548 \tabularnewline
25 & 0.511216688357202 & 0.977566623285595 & 0.488783311642798 \tabularnewline
26 & 0.485624388135235 & 0.971248776270471 & 0.514375611864765 \tabularnewline
27 & 0.477039535453208 & 0.954079070906416 & 0.522960464546792 \tabularnewline
28 & 0.808995086211175 & 0.382009827577649 & 0.191004913788825 \tabularnewline
29 & 0.759992480103982 & 0.480015039792036 & 0.240007519896018 \tabularnewline
30 & 0.701172600629847 & 0.597654798740305 & 0.298827399370153 \tabularnewline
31 & 0.708390936555866 & 0.583218126888268 & 0.291609063444134 \tabularnewline
32 & 0.73134239670759 & 0.53731520658482 & 0.26865760329241 \tabularnewline
33 & 0.660659986858424 & 0.678680026283152 & 0.339340013141576 \tabularnewline
34 & 0.608764459797976 & 0.782471080404047 & 0.391235540202024 \tabularnewline
35 & 0.525238525086353 & 0.949522949827293 & 0.474761474913647 \tabularnewline
36 & 0.57577681481326 & 0.84844637037348 & 0.42422318518674 \tabularnewline
37 & 0.490250996256143 & 0.980501992512287 & 0.509749003743857 \tabularnewline
38 & 0.452238597237222 & 0.904477194474444 & 0.547761402762778 \tabularnewline
39 & 0.590567913250776 & 0.81886417349845 & 0.409432086749225 \tabularnewline
40 & 0.722157036865714 & 0.555685926268571 & 0.277842963134286 \tabularnewline
41 & 0.647256737111128 & 0.705486525777744 & 0.352743262888872 \tabularnewline
42 & 0.565788347113708 & 0.868423305772583 & 0.434211652886292 \tabularnewline
43 & 0.559109870110045 & 0.881780259779911 & 0.440890129889956 \tabularnewline
44 & 0.485324877131856 & 0.970649754263711 & 0.514675122868144 \tabularnewline
45 & 0.388797557889489 & 0.777595115778978 & 0.611202442110511 \tabularnewline
46 & 0.441013720856688 & 0.882027441713377 & 0.558986279143312 \tabularnewline
47 & 0.345326241848214 & 0.690652483696429 & 0.654673758151786 \tabularnewline
48 & 0.252277663899236 & 0.504555327798471 & 0.747722336100764 \tabularnewline
49 & 0.280358415580020 & 0.560716831160041 & 0.71964158441998 \tabularnewline
50 & 0.176237641491102 & 0.352475282982204 & 0.823762358508898 \tabularnewline
\hline
\end{tabular}
%Source: https://freestatistics.org/blog/index.php?pk=57784&T=5

[TABLE]
[ROW][C]Goldfeld-Quandt test for Heteroskedasticity[/C][/ROW]
[ROW][C]p-values[/C][C]Alternative Hypothesis[/C][/ROW]
[ROW][C]breakpoint index[/C][C]greater[/C][C]2-sided[/C][C]less[/C][/ROW]
[ROW][C]8[/C][C]0.826591883888339[/C][C]0.346816232223323[/C][C]0.173408116111661[/C][/ROW]
[ROW][C]9[/C][C]0.709568496559929[/C][C]0.580863006880141[/C][C]0.290431503440071[/C][/ROW]
[ROW][C]10[/C][C]0.723494137088191[/C][C]0.553011725823618[/C][C]0.276505862911809[/C][/ROW]
[ROW][C]11[/C][C]0.682194129639952[/C][C]0.635611740720095[/C][C]0.317805870360048[/C][/ROW]
[ROW][C]12[/C][C]0.567319197678659[/C][C]0.865361604642682[/C][C]0.432680802321341[/C][/ROW]
[ROW][C]13[/C][C]0.456208420481885[/C][C]0.91241684096377[/C][C]0.543791579518115[/C][/ROW]
[ROW][C]14[/C][C]0.362637029848000[/C][C]0.725274059695999[/C][C]0.637362970152[/C][/ROW]
[ROW][C]15[/C][C]0.402005761966412[/C][C]0.804011523932823[/C][C]0.597994238033588[/C][/ROW]
[ROW][C]16[/C][C]0.799173723408167[/C][C]0.401652553183665[/C][C]0.200826276591833[/C][/ROW]
[ROW][C]17[/C][C]0.754486779092245[/C][C]0.491026441815509[/C][C]0.245513220907755[/C][/ROW]
[ROW][C]18[/C][C]0.70326003325895[/C][C]0.593479933482101[/C][C]0.296739966741050[/C][/ROW]
[ROW][C]19[/C][C]0.675412364869884[/C][C]0.649175270260232[/C][C]0.324587635130116[/C][/ROW]
[ROW][C]20[/C][C]0.720073602558577[/C][C]0.559852794882847[/C][C]0.279926397441423[/C][/ROW]
[ROW][C]21[/C][C]0.653109326011831[/C][C]0.693781347976338[/C][C]0.346890673988169[/C][/ROW]
[ROW][C]22[/C][C]0.587297270683141[/C][C]0.825405458633719[/C][C]0.412702729316860[/C][/ROW]
[ROW][C]23[/C][C]0.523962833243008[/C][C]0.952074333513984[/C][C]0.476037166756992[/C][/ROW]
[ROW][C]24[/C][C]0.542439521477452[/C][C]0.915120957045097[/C][C]0.457560478522548[/C][/ROW]
[ROW][C]25[/C][C]0.511216688357202[/C][C]0.977566623285595[/C][C]0.488783311642798[/C][/ROW]
[ROW][C]26[/C][C]0.485624388135235[/C][C]0.971248776270471[/C][C]0.514375611864765[/C][/ROW]
[ROW][C]27[/C][C]0.477039535453208[/C][C]0.954079070906416[/C][C]0.522960464546792[/C][/ROW]
[ROW][C]28[/C][C]0.808995086211175[/C][C]0.382009827577649[/C][C]0.191004913788825[/C][/ROW]
[ROW][C]29[/C][C]0.759992480103982[/C][C]0.480015039792036[/C][C]0.240007519896018[/C][/ROW]
[ROW][C]30[/C][C]0.701172600629847[/C][C]0.597654798740305[/C][C]0.298827399370153[/C][/ROW]
[ROW][C]31[/C][C]0.708390936555866[/C][C]0.583218126888268[/C][C]0.291609063444134[/C][/ROW]
[ROW][C]32[/C][C]0.73134239670759[/C][C]0.53731520658482[/C][C]0.26865760329241[/C][/ROW]
[ROW][C]33[/C][C]0.660659986858424[/C][C]0.678680026283152[/C][C]0.339340013141576[/C][/ROW]
[ROW][C]34[/C][C]0.608764459797976[/C][C]0.782471080404047[/C][C]0.391235540202024[/C][/ROW]
[ROW][C]35[/C][C]0.525238525086353[/C][C]0.949522949827293[/C][C]0.474761474913647[/C][/ROW]
[ROW][C]36[/C][C]0.57577681481326[/C][C]0.84844637037348[/C][C]0.42422318518674[/C][/ROW]
[ROW][C]37[/C][C]0.490250996256143[/C][C]0.980501992512287[/C][C]0.509749003743857[/C][/ROW]
[ROW][C]38[/C][C]0.452238597237222[/C][C]0.904477194474444[/C][C]0.547761402762778[/C][/ROW]
[ROW][C]39[/C][C]0.590567913250776[/C][C]0.81886417349845[/C][C]0.409432086749225[/C][/ROW]
[ROW][C]40[/C][C]0.722157036865714[/C][C]0.555685926268571[/C][C]0.277842963134286[/C][/ROW]
[ROW][C]41[/C][C]0.647256737111128[/C][C]0.705486525777744[/C][C]0.352743262888872[/C][/ROW]
[ROW][C]42[/C][C]0.565788347113708[/C][C]0.868423305772583[/C][C]0.434211652886292[/C][/ROW]
[ROW][C]43[/C][C]0.559109870110045[/C][C]0.881780259779911[/C][C]0.440890129889956[/C][/ROW]
[ROW][C]44[/C][C]0.485324877131856[/C][C]0.970649754263711[/C][C]0.514675122868144[/C][/ROW]
[ROW][C]45[/C][C]0.388797557889489[/C][C]0.777595115778978[/C][C]0.611202442110511[/C][/ROW]
[ROW][C]46[/C][C]0.441013720856688[/C][C]0.882027441713377[/C][C]0.558986279143312[/C][/ROW]
[ROW][C]47[/C][C]0.345326241848214[/C][C]0.690652483696429[/C][C]0.654673758151786[/C][/ROW]
[ROW][C]48[/C][C]0.252277663899236[/C][C]0.504555327798471[/C][C]0.747722336100764[/C][/ROW]
[ROW][C]49[/C][C]0.280358415580020[/C][C]0.560716831160041[/C][C]0.71964158441998[/C][/ROW]
[ROW][C]50[/C][C]0.176237641491102[/C][C]0.352475282982204[/C][C]0.823762358508898[/C][/ROW]
[/TABLE]
Source: https://freestatistics.org/blog/index.php?pk=57784&T=5

Globally Unique Identifier (entire table): ba.freestatistics.org/blog/index.php?pk=57784&T=5

As an alternative you can also use a QR Code:  

The GUIDs for individual cells are displayed in the table below:

Goldfeld-Quandt test for Heteroskedasticity
p-valuesAlternative Hypothesis
breakpoint indexgreater2-sidedless
80.8265918838883390.3468162322233230.173408116111661
90.7095684965599290.5808630068801410.290431503440071
100.7234941370881910.5530117258236180.276505862911809
110.6821941296399520.6356117407200950.317805870360048
120.5673191976786590.8653616046426820.432680802321341
130.4562084204818850.912416840963770.543791579518115
140.3626370298480000.7252740596959990.637362970152
150.4020057619664120.8040115239328230.597994238033588
160.7991737234081670.4016525531836650.200826276591833
170.7544867790922450.4910264418155090.245513220907755
180.703260033258950.5934799334821010.296739966741050
190.6754123648698840.6491752702602320.324587635130116
200.7200736025585770.5598527948828470.279926397441423
210.6531093260118310.6937813479763380.346890673988169
220.5872972706831410.8254054586337190.412702729316860
230.5239628332430080.9520743335139840.476037166756992
240.5424395214774520.9151209570450970.457560478522548
250.5112166883572020.9775666232855950.488783311642798
260.4856243881352350.9712487762704710.514375611864765
270.4770395354532080.9540790709064160.522960464546792
280.8089950862111750.3820098275776490.191004913788825
290.7599924801039820.4800150397920360.240007519896018
300.7011726006298470.5976547987403050.298827399370153
310.7083909365558660.5832181268882680.291609063444134
320.731342396707590.537315206584820.26865760329241
330.6606599868584240.6786800262831520.339340013141576
340.6087644597979760.7824710804040470.391235540202024
350.5252385250863530.9495229498272930.474761474913647
360.575776814813260.848446370373480.42422318518674
370.4902509962561430.9805019925122870.509749003743857
380.4522385972372220.9044771944744440.547761402762778
390.5905679132507760.818864173498450.409432086749225
400.7221570368657140.5556859262685710.277842963134286
410.6472567371111280.7054865257777440.352743262888872
420.5657883471137080.8684233057725830.434211652886292
430.5591098701100450.8817802597799110.440890129889956
440.4853248771318560.9706497542637110.514675122868144
450.3887975578894890.7775951157789780.611202442110511
460.4410137208566880.8820274417133770.558986279143312
470.3453262418482140.6906524836964290.654673758151786
480.2522776638992360.5045553277984710.747722336100764
490.2803584155800200.5607168311600410.71964158441998
500.1762376414911020.3524752829822040.823762358508898


Meta Analysis of Goldfeld-Quandt test for Heteroskedasticity
Description# significant tests% significant testsOK/NOK
1% type I error level00OK
5% type I error level00OK
10% type I error level00OK

\begin{tabular}{lllllllll}
\hline
Meta Analysis of Goldfeld-Quandt test for Heteroskedasticity \tabularnewline
Description & # significant tests & % significant tests & OK/NOK \tabularnewline
1% type I error level & 0 & 0 & OK \tabularnewline
5% type I error level & 0 & 0 & OK \tabularnewline
10% type I error level & 0 & 0 & OK \tabularnewline
\hline
\end{tabular}
%Source: https://freestatistics.org/blog/index.php?pk=57784&T=6

[TABLE]
[ROW][C]Meta Analysis of Goldfeld-Quandt test for Heteroskedasticity[/C][/ROW]
[ROW][C]Description[/C][C]# significant tests[/C][C]% significant tests[/C][C]OK/NOK[/C][/ROW]
[ROW][C]1% type I error level[/C][C]0[/C][C]0[/C][C]OK[/C][/ROW]
[ROW][C]5% type I error level[/C][C]0[/C][C]0[/C][C]OK[/C][/ROW]
[ROW][C]10% type I error level[/C][C]0[/C][C]0[/C][C]OK[/C][/ROW]
[/TABLE]
Source: https://freestatistics.org/blog/index.php?pk=57784&T=6

Globally Unique Identifier (entire table): ba.freestatistics.org/blog/index.php?pk=57784&T=6

As an alternative you can also use a QR Code:  

The GUIDs for individual cells are displayed in the table below:

Meta Analysis of Goldfeld-Quandt test for Heteroskedasticity
Description# significant tests% significant testsOK/NOK
1% type I error level00OK
5% type I error level00OK
10% type I error level00OK


Parameters (Session):
Parameters (R input):
par1 = 1 ; par2 = Do not include Seasonal Dummies ; par3 = No Linear Trend ;
R code (references can be found in the software module):
library(lattice)
library(lmtest)
n25 <- 25 #minimum number of obs. for Goldfeld-Quandt test
par1 <- as.numeric(par1)
x <- t(y)
k <- length(x[1,])
n <- length(x[,1])
x1 <- cbind(x[,par1], x[,1:k!=par1])
mycolnames <- c(colnames(x)[par1], colnames(x)[1:k!=par1])
colnames(x1) <- mycolnames #colnames(x)[par1]
x <- x1
if (par3 == 'First Differences'){
x2 <- array(0, dim=c(n-1,k), dimnames=list(1:(n-1), paste('(1-B)',colnames(x),sep='')))
for (i in 1:n-1) {
for (j in 1:k) {
x2[i,j] <- x[i+1,j] - x[i,j]
}
}
x <- x2
}
if (par2 == 'Include Monthly Dummies'){
x2 <- array(0, dim=c(n,11), dimnames=list(1:n, paste('M', seq(1:11), sep ='')))
for (i in 1:11){
x2[seq(i,n,12),i] <- 1
}
x <- cbind(x, x2)
}
if (par2 == 'Include Quarterly Dummies'){
x2 <- array(0, dim=c(n,3), dimnames=list(1:n, paste('Q', seq(1:3), sep ='')))
for (i in 1:3){
x2[seq(i,n,4),i] <- 1
}
x <- cbind(x, x2)
}
k <- length(x[1,])
if (par3 == 'Linear Trend'){
x <- cbind(x, c(1:n))
colnames(x)[k+1] <- 't'
}
x
k <- length(x[1,])
df <- as.data.frame(x)
(mylm <- lm(df))
(mysum <- summary(mylm))
if (n > n25) {
kp3 <- k + 3
nmkm3 <- n - k - 3
gqarr <- array(NA, dim=c(nmkm3-kp3+1,3))
numgqtests <- 0
numsignificant1 <- 0
numsignificant5 <- 0
numsignificant10 <- 0
for (mypoint in kp3:nmkm3) {
j <- 0
numgqtests <- numgqtests + 1
for (myalt in c('greater', 'two.sided', 'less')) {
j <- j + 1
gqarr[mypoint-kp3+1,j] <- gqtest(mylm, point=mypoint, alternative=myalt)$p.value
}
if (gqarr[mypoint-kp3+1,2] < 0.01) numsignificant1 <- numsignificant1 + 1
if (gqarr[mypoint-kp3+1,2] < 0.05) numsignificant5 <- numsignificant5 + 1
if (gqarr[mypoint-kp3+1,2] < 0.10) numsignificant10 <- numsignificant10 + 1
}
gqarr
}
bitmap(file='test0.png')
plot(x[,1], type='l', main='Actuals and Interpolation', ylab='value of Actuals and Interpolation (dots)', xlab='time or index')
points(x[,1]-mysum$resid)
grid()
dev.off()
bitmap(file='test1.png')
plot(mysum$resid, type='b', pch=19, main='Residuals', ylab='value of Residuals', xlab='time or index')
grid()
dev.off()
bitmap(file='test2.png')
hist(mysum$resid, main='Residual Histogram', xlab='values of Residuals')
grid()
dev.off()
bitmap(file='test3.png')
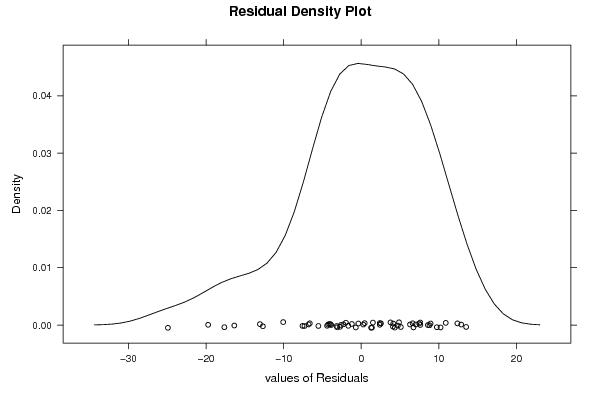
densityplot(~mysum$resid,col='black',main='Residual Density Plot', xlab='values of Residuals')
dev.off()
bitmap(file='test4.png')
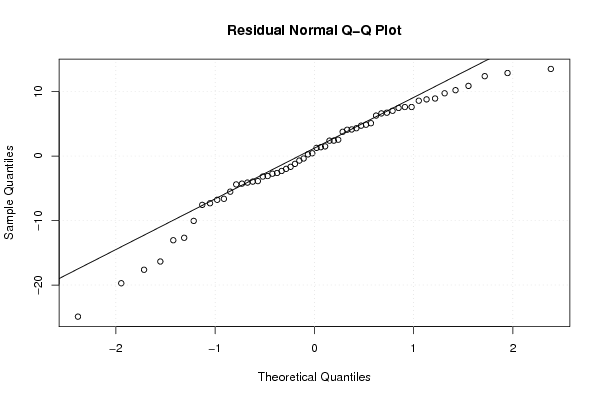
qqnorm(mysum$resid, main='Residual Normal Q-Q Plot')
qqline(mysum$resid)
grid()
dev.off()
(myerror <- as.ts(mysum$resid))
bitmap(file='test5.png')
dum <- cbind(lag(myerror,k=1),myerror)
dum
dum1 <- dum[2:length(myerror),]
dum1
z <- as.data.frame(dum1)
z
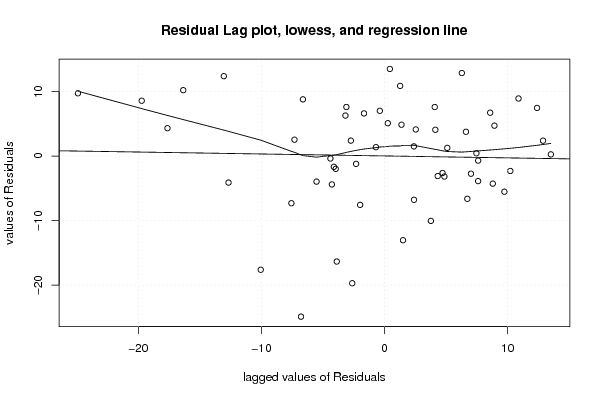
plot(z,main=paste('Residual Lag plot, lowess, and regression line'), ylab='values of Residuals', xlab='lagged values of Residuals')
lines(lowess(z))
abline(lm(z))
grid()
dev.off()
bitmap(file='test6.png')
acf(mysum$resid, lag.max=length(mysum$resid)/2, main='Residual Autocorrelation Function')
grid()
dev.off()
bitmap(file='test7.png')
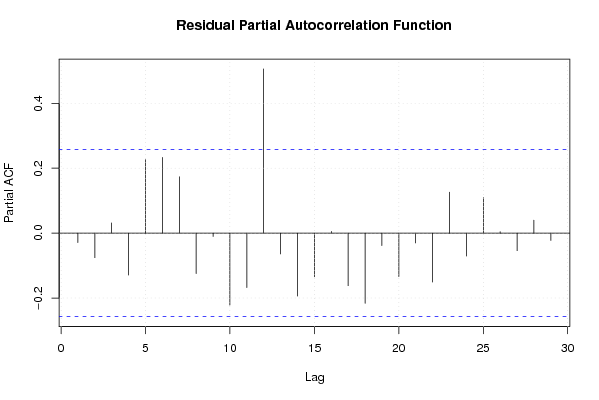
pacf(mysum$resid, lag.max=length(mysum$resid)/2, main='Residual Partial Autocorrelation Function')
grid()
dev.off()
bitmap(file='test8.png')
opar <- par(mfrow = c(2,2), oma = c(0, 0, 1.1, 0))
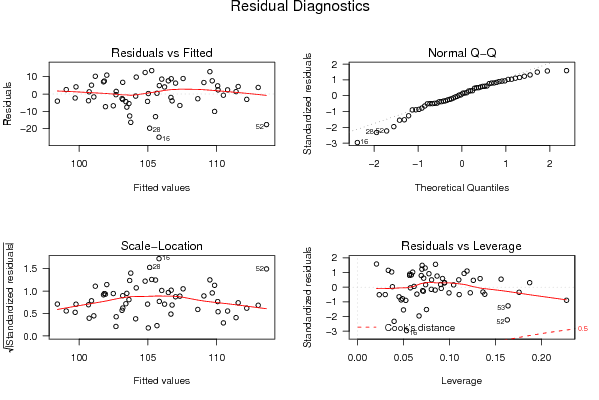
plot(mylm, las = 1, sub='Residual Diagnostics')
par(opar)
dev.off()
if (n > n25) {
bitmap(file='test9.png')
plot(kp3:nmkm3,gqarr[,2], main='Goldfeld-Quandt test',ylab='2-sided p-value',xlab='breakpoint')
grid()
dev.off()
}
load(file='createtable')
a<-table.start()
a<-table.row.start(a)
a<-table.element(a, 'Multiple Linear Regression - Estimated Regression Equation', 1, TRUE)
a<-table.row.end(a)
myeq <- colnames(x)[1]
myeq <- paste(myeq, '[t] = ', sep='')
for (i in 1:k){
if (mysum$coefficients[i,1] > 0) myeq <- paste(myeq, '+', '')
myeq <- paste(myeq, mysum$coefficients[i,1], sep=' ')
if (rownames(mysum$coefficients)[i] != '(Intercept)') {
myeq <- paste(myeq, rownames(mysum$coefficients)[i], sep='')
if (rownames(mysum$coefficients)[i] != 't') myeq <- paste(myeq, '[t]', sep='')
}
}
myeq <- paste(myeq, ' + e[t]')
a<-table.row.start(a)
a<-table.element(a, myeq)
a<-table.row.end(a)
a<-table.end(a)
table.save(a,file='mytable1.tab')
a<-table.start()
a<-table.row.start(a)
a<-table.element(a,hyperlink('ols1.htm','Multiple Linear Regression - Ordinary Least Squares',''), 6, TRUE)
a<-table.row.end(a)
a<-table.row.start(a)
a<-table.element(a,'Variable',header=TRUE)
a<-table.element(a,'Parameter',header=TRUE)
a<-table.element(a,'S.D.',header=TRUE)
a<-table.element(a,'T-STAT
H0: parameter = 0',header=TRUE)
a<-table.element(a,'2-tail p-value',header=TRUE)
a<-table.element(a,'1-tail p-value',header=TRUE)
a<-table.row.end(a)
for (i in 1:k){
a<-table.row.start(a)
a<-table.element(a,rownames(mysum$coefficients)[i],header=TRUE)
a<-table.element(a,mysum$coefficients[i,1])
a<-table.element(a, round(mysum$coefficients[i,2],6))
a<-table.element(a, round(mysum$coefficients[i,3],4))
a<-table.element(a, round(mysum$coefficients[i,4],6))
a<-table.element(a, round(mysum$coefficients[i,4]/2,6))
a<-table.row.end(a)
}
a<-table.end(a)
table.save(a,file='mytable2.tab')
a<-table.start()
a<-table.row.start(a)
a<-table.element(a, 'Multiple Linear Regression - Regression Statistics', 2, TRUE)
a<-table.row.end(a)
a<-table.row.start(a)
a<-table.element(a, 'Multiple R',1,TRUE)
a<-table.element(a, sqrt(mysum$r.squared))
a<-table.row.end(a)
a<-table.row.start(a)
a<-table.element(a, 'R-squared',1,TRUE)
a<-table.element(a, mysum$r.squared)
a<-table.row.end(a)
a<-table.row.start(a)
a<-table.element(a, 'Adjusted R-squared',1,TRUE)
a<-table.element(a, mysum$adj.r.squared)
a<-table.row.end(a)
a<-table.row.start(a)
a<-table.element(a, 'F-TEST (value)',1,TRUE)
a<-table.element(a, mysum$fstatistic[1])
a<-table.row.end(a)
a<-table.row.start(a)
a<-table.element(a, 'F-TEST (DF numerator)',1,TRUE)
a<-table.element(a, mysum$fstatistic[2])
a<-table.row.end(a)
a<-table.row.start(a)
a<-table.element(a, 'F-TEST (DF denominator)',1,TRUE)
a<-table.element(a, mysum$fstatistic[3])
a<-table.row.end(a)
a<-table.row.start(a)
a<-table.element(a, 'p-value',1,TRUE)
a<-table.element(a, 1-pf(mysum$fstatistic[1],mysum$fstatistic[2],mysum$fstatistic[3]))
a<-table.row.end(a)
a<-table.row.start(a)
a<-table.element(a, 'Multiple Linear Regression - Residual Statistics', 2, TRUE)
a<-table.row.end(a)
a<-table.row.start(a)
a<-table.element(a, 'Residual Standard Deviation',1,TRUE)
a<-table.element(a, mysum$sigma)
a<-table.row.end(a)
a<-table.row.start(a)
a<-table.element(a, 'Sum Squared Residuals',1,TRUE)
a<-table.element(a, sum(myerror*myerror))
a<-table.row.end(a)
a<-table.end(a)
table.save(a,file='mytable3.tab')
a<-table.start()
a<-table.row.start(a)
a<-table.element(a, 'Multiple Linear Regression - Actuals, Interpolation, and Residuals', 4, TRUE)
a<-table.row.end(a)
a<-table.row.start(a)
a<-table.element(a, 'Time or Index', 1, TRUE)
a<-table.element(a, 'Actuals', 1, TRUE)
a<-table.element(a, 'Interpolation
Forecast', 1, TRUE)
a<-table.element(a, 'Residuals
Prediction Error', 1, TRUE)
a<-table.row.end(a)
for (i in 1:n) {
a<-table.row.start(a)
a<-table.element(a,i, 1, TRUE)
a<-table.element(a,x[i])
a<-table.element(a,x[i]-mysum$resid[i])
a<-table.element(a,mysum$resid[i])
a<-table.row.end(a)
}
a<-table.end(a)
table.save(a,file='mytable4.tab')
if (n > n25) {
a<-table.start()
a<-table.row.start(a)
a<-table.element(a,'Goldfeld-Quandt test for Heteroskedasticity',4,TRUE)
a<-table.row.end(a)
a<-table.row.start(a)
a<-table.element(a,'p-values',header=TRUE)
a<-table.element(a,'Alternative Hypothesis',3,header=TRUE)
a<-table.row.end(a)
a<-table.row.start(a)
a<-table.element(a,'breakpoint index',header=TRUE)
a<-table.element(a,'greater',header=TRUE)
a<-table.element(a,'2-sided',header=TRUE)
a<-table.element(a,'less',header=TRUE)
a<-table.row.end(a)
for (mypoint in kp3:nmkm3) {
a<-table.row.start(a)
a<-table.element(a,mypoint,header=TRUE)
a<-table.element(a,gqarr[mypoint-kp3+1,1])
a<-table.element(a,gqarr[mypoint-kp3+1,2])
a<-table.element(a,gqarr[mypoint-kp3+1,3])
a<-table.row.end(a)
}
a<-table.end(a)
table.save(a,file='mytable5.tab')
a<-table.start()
a<-table.row.start(a)
a<-table.element(a,'Meta Analysis of Goldfeld-Quandt test for Heteroskedasticity',4,TRUE)
a<-table.row.end(a)
a<-table.row.start(a)
a<-table.element(a,'Description',header=TRUE)
a<-table.element(a,'# significant tests',header=TRUE)
a<-table.element(a,'% significant tests',header=TRUE)
a<-table.element(a,'OK/NOK',header=TRUE)
a<-table.row.end(a)
a<-table.row.start(a)
a<-table.element(a,'1% type I error level',header=TRUE)
a<-table.element(a,numsignificant1)
a<-table.element(a,numsignificant1/numgqtests)
if (numsignificant1/numgqtests < 0.01) dum <- 'OK' else dum <- 'NOK'
a<-table.element(a,dum)
a<-table.row.end(a)
a<-table.row.start(a)
a<-table.element(a,'5% type I error level',header=TRUE)
a<-table.element(a,numsignificant5)
a<-table.element(a,numsignificant5/numgqtests)
if (numsignificant5/numgqtests < 0.05) dum <- 'OK' else dum <- 'NOK'
a<-table.element(a,dum)
a<-table.row.end(a)
a<-table.row.start(a)
a<-table.element(a,'10% type I error level',header=TRUE)
a<-table.element(a,numsignificant10)
a<-table.element(a,numsignificant10/numgqtests)
if (numsignificant10/numgqtests < 0.1) dum <- 'OK' else dum <- 'NOK'
a<-table.element(a,dum)
a<-table.row.end(a)
a<-table.end(a)
table.save(a,file='mytable6.tab')
}