| Multiple Linear Regression - Estimated Regression Equation |
| tot.ind.prod.index[t] = + 136.369545246487 + 0.0530843258192137prijsindex.grondst.incl.energie[t] -0.0119367169882655`y(t-1)`[t] -0.301068823246038`y(t-2)`[t] -0.0891857427440547`y(t-3)`[t] + e[t] |
| Multiple Linear Regression - Ordinary Least Squares | |||||
| Variable | Parameter | S.D. | T-STAT H0: parameter = 0 | 2-tail p-value | 1-tail p-value |
| (Intercept) | 136.369545246487 | 27.046743 | 5.042 | 6e-06 | 3e-06 |
| prijsindex.grondst.incl.energie | 0.0530843258192137 | 0.019245 | 2.7583 | 0.007956 | 0.003978 |
| `y(t-1)` | -0.0119367169882655 | 0.141427 | -0.0844 | 0.933055 | 0.466527 |
| `y(t-2)` | -0.301068823246038 | 0.134349 | -2.2409 | 0.029243 | 0.014622 |
| `y(t-3)` | -0.0891857427440547 | 0.142868 | -0.6243 | 0.53514 | 0.26757 |
| Multiple Linear Regression - Regression Statistics | |
| Multiple R | 0.411787166404869 |
| R-squared | 0.169568670415751 |
| Adjusted R-squared | 0.106894607805619 |
| F-TEST (value) | 2.70556372690508 |
| F-TEST (DF numerator) | 4 |
| F-TEST (DF denominator) | 53 |
| p-value | 0.039939568367107 |
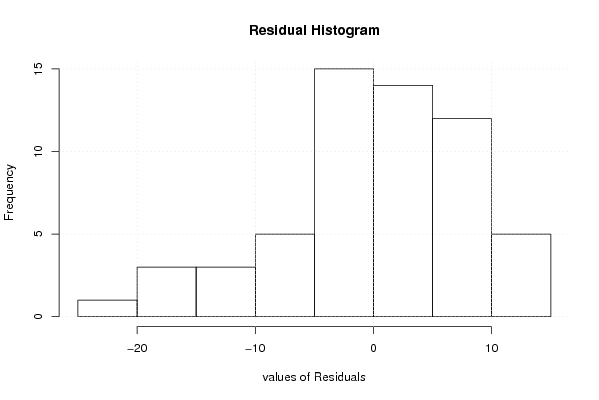
| Multiple Linear Regression - Residual Statistics | |
| Residual Standard Deviation | 8.63250883290268 |
| Sum Squared Residuals | 3949.57106375757 |
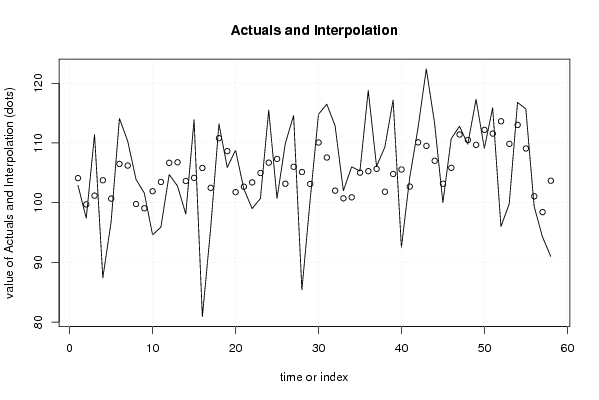
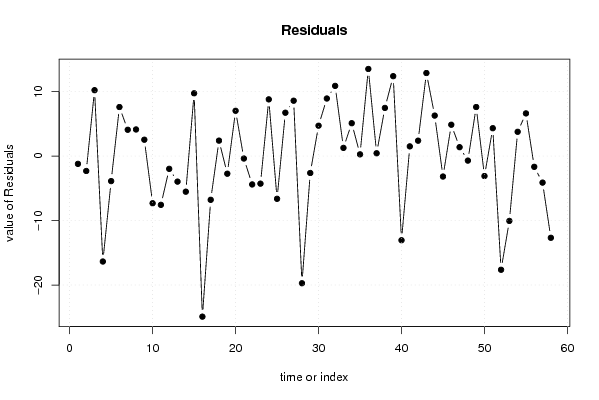
| Multiple Linear Regression - Actuals, Interpolation, and Residuals | |||
| Time or Index | Actuals | Interpolation Forecast | Residuals Prediction Error |
| 1 | 102.9 | 104.107288794034 | -1.20728879403354 |
| 2 | 97.4 | 99.7049338976584 | -2.30493389765837 |
| 3 | 111.4 | 101.172208035530 | 10.2277919644704 |
| 4 | 87.4 | 103.752638540298 | -16.3526385402976 |
| 5 | 96.8 | 100.675651223234 | -3.87565122323435 |
| 6 | 114.1 | 106.487413117214 | 7.6125868827864 |
| 7 | 110.3 | 106.212405412746 | 4.08759458725404 |
| 8 | 103.9 | 99.7650199764694 | 4.13498002353061 |
| 9 | 101.6 | 99.0550475655768 | 2.54495243442316 |
| 10 | 94.6 | 101.910942159536 | -7.31094215953557 |
| 11 | 95.9 | 103.464775096176 | -7.56477509617619 |
| 12 | 104.7 | 106.674916739216 | -1.97491673921552 |
| 13 | 102.8 | 106.760316898052 | -3.96031689805194 |
| 14 | 98.1 | 103.619517106553 | -5.51951710655314 |
| 15 | 113.9 | 104.152912140068 | 9.74708785993245 |
| 16 | 80.9 | 105.808901588637 | -24.9089015886372 |
| 17 | 95.7 | 102.480877012362 | -6.78087701236248 |
| 18 | 113.2 | 110.798499437208 | 2.40150056279218 |
| 19 | 105.9 | 108.631009479544 | -2.73100947954421 |
| 20 | 108.8 | 101.768520698570 | 7.03147930142977 |
| 21 | 102.3 | 102.673536788149 | -0.3735367881489 |
| 22 | 99 | 103.394356294044 | -4.3943562940439 |
| 23 | 100.7 | 104.972803179789 | -4.27280317978902 |
| 24 | 115.5 | 106.695615048079 | 8.80438495192126 |
| 25 | 100.7 | 107.325975076500 | -6.62597507650034 |
| 26 | 109.9 | 103.165934202898 | 6.7340657971016 |
| 27 | 114.6 | 106.006190857668 | 8.59380914233152 |
| 28 | 85.4 | 105.126599151239 | -19.7265991512388 |
| 29 | 100.5 | 103.117525035410 | -2.61752503541028 |
| 30 | 114.8 | 110.077760897769 | 4.72223910223102 |
| 31 | 116.5 | 107.561709425722 | 8.93829057427803 |
| 32 | 112.9 | 102.006213635791 | 10.8937863642094 |
| 33 | 102 | 100.723846330817 | 1.27615366918271 |
| 34 | 106 | 100.894371873247 | 5.10562812675257 |
| 35 | 105.3 | 105.027963003984 | 0.272036996015781 |
| 36 | 118.8 | 105.276618508593 | 13.5233814914069 |
| 37 | 106.1 | 105.659574270197 | 0.440425729802744 |
| 38 | 109.3 | 101.825096779793 | 7.47490322020669 |
| 39 | 117.2 | 104.799289824673 | 12.400710175327 |
| 40 | 92.5 | 105.553707829414 | -13.0537078294138 |
| 41 | 104.2 | 102.691022428481 | 1.50897757151942 |
| 42 | 112.5 | 110.106002456415 | 2.39399754358519 |
| 43 | 122.4 | 109.510117369410 | 12.8898826305905 |
| 44 | 113.3 | 107.012146183619 | 6.28785381638108 |
| 45 | 100 | 103.171684692278 | -3.17168469227807 |
| 46 | 110.7 | 105.829550809007 | 4.8704491909927 |
| 47 | 112.8 | 111.414758651721 | 1.38524134827921 |
| 48 | 109.8 | 110.495738520922 | -0.695738520921836 |
| 49 | 117.3 | 109.682888824596 | 7.61711117540436 |
| 50 | 109.1 | 112.193773423741 | -3.09377342374134 |
| 51 | 115.9 | 111.569910944011 | 4.33008905598881 |
| 52 | 96 | 113.633660666353 | -17.633660666353 |
| 53 | 99.8 | 109.853264242650 | -10.0532642426497 |
| 54 | 116.8 | 113.026870756607 | 3.77312924339306 |
| 55 | 115.7 | 109.075224439993 | 6.62477556000697 |
| 56 | 99.4 | 101.061997641420 | -1.66199764142012 |
| 57 | 94.3 | 98.4100448091092 | -4.11004480910918 |
| 58 | 91 | 103.672860207209 | -12.6728602072093 |
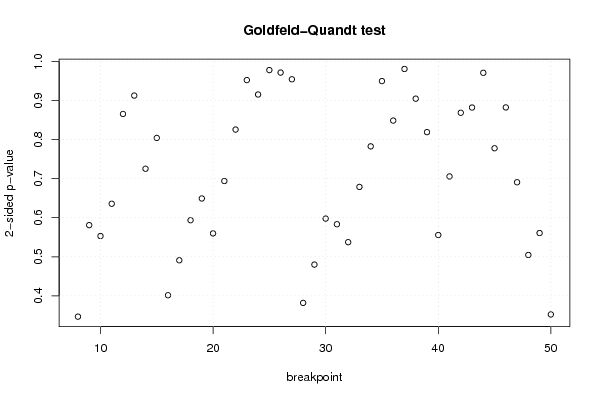
| Goldfeld-Quandt test for Heteroskedasticity | |||
| p-values | Alternative Hypothesis | ||
| breakpoint index | greater | 2-sided | less |
| 8 | 0.826591883888339 | 0.346816232223323 | 0.173408116111661 |
| 9 | 0.709568496559929 | 0.580863006880141 | 0.290431503440071 |
| 10 | 0.723494137088191 | 0.553011725823618 | 0.276505862911809 |
| 11 | 0.682194129639952 | 0.635611740720095 | 0.317805870360048 |
| 12 | 0.567319197678659 | 0.865361604642682 | 0.432680802321341 |
| 13 | 0.456208420481885 | 0.91241684096377 | 0.543791579518115 |
| 14 | 0.362637029848000 | 0.725274059695999 | 0.637362970152 |
| 15 | 0.402005761966412 | 0.804011523932823 | 0.597994238033588 |
| 16 | 0.799173723408167 | 0.401652553183665 | 0.200826276591833 |
| 17 | 0.754486779092245 | 0.491026441815509 | 0.245513220907755 |
| 18 | 0.70326003325895 | 0.593479933482101 | 0.296739966741050 |
| 19 | 0.675412364869884 | 0.649175270260232 | 0.324587635130116 |
| 20 | 0.720073602558577 | 0.559852794882847 | 0.279926397441423 |
| 21 | 0.653109326011831 | 0.693781347976338 | 0.346890673988169 |
| 22 | 0.587297270683141 | 0.825405458633719 | 0.412702729316860 |
| 23 | 0.523962833243008 | 0.952074333513984 | 0.476037166756992 |
| 24 | 0.542439521477452 | 0.915120957045097 | 0.457560478522548 |
| 25 | 0.511216688357202 | 0.977566623285595 | 0.488783311642798 |
| 26 | 0.485624388135235 | 0.971248776270471 | 0.514375611864765 |
| 27 | 0.477039535453208 | 0.954079070906416 | 0.522960464546792 |
| 28 | 0.808995086211175 | 0.382009827577649 | 0.191004913788825 |
| 29 | 0.759992480103982 | 0.480015039792036 | 0.240007519896018 |
| 30 | 0.701172600629847 | 0.597654798740305 | 0.298827399370153 |
| 31 | 0.708390936555866 | 0.583218126888268 | 0.291609063444134 |
| 32 | 0.73134239670759 | 0.53731520658482 | 0.26865760329241 |
| 33 | 0.660659986858424 | 0.678680026283152 | 0.339340013141576 |
| 34 | 0.608764459797976 | 0.782471080404047 | 0.391235540202024 |
| 35 | 0.525238525086353 | 0.949522949827293 | 0.474761474913647 |
| 36 | 0.57577681481326 | 0.84844637037348 | 0.42422318518674 |
| 37 | 0.490250996256143 | 0.980501992512287 | 0.509749003743857 |
| 38 | 0.452238597237222 | 0.904477194474444 | 0.547761402762778 |
| 39 | 0.590567913250776 | 0.81886417349845 | 0.409432086749225 |
| 40 | 0.722157036865714 | 0.555685926268571 | 0.277842963134286 |
| 41 | 0.647256737111128 | 0.705486525777744 | 0.352743262888872 |
| 42 | 0.565788347113708 | 0.868423305772583 | 0.434211652886292 |
| 43 | 0.559109870110045 | 0.881780259779911 | 0.440890129889956 |
| 44 | 0.485324877131856 | 0.970649754263711 | 0.514675122868144 |
| 45 | 0.388797557889489 | 0.777595115778978 | 0.611202442110511 |
| 46 | 0.441013720856688 | 0.882027441713377 | 0.558986279143312 |
| 47 | 0.345326241848214 | 0.690652483696429 | 0.654673758151786 |
| 48 | 0.252277663899236 | 0.504555327798471 | 0.747722336100764 |
| 49 | 0.280358415580020 | 0.560716831160041 | 0.71964158441998 |
| 50 | 0.176237641491102 | 0.352475282982204 | 0.823762358508898 |
| Meta Analysis of Goldfeld-Quandt test for Heteroskedasticity | |||
| Description | # significant tests | % significant tests | OK/NOK |
| 1% type I error level | 0 | 0 | OK |
| 5% type I error level | 0 | 0 | OK |
| 10% type I error level | 0 | 0 | OK |