| Multiple Linear Regression - Estimated Regression Equation |
| bbp[t] = -0.729216595290699 + 0.771547876570157dnst[t] + 0.259590756245638y1[t] -0.324288162170647y2[t] -0.107507909542879y3[t] + 0.144420397190849y4[t] + 0.443964966435733y5[t] + 0.0983821269698033M1[t] + 0.165757665776796M2[t] + 0.616461506665139M3[t] + 0.527372688535687M4[t] + 0.806866310733002M5[t] + 0.530453908871542M6[t] + 0.516266033363936M7[t] + 0.463812304639643M8[t] + 0.469250583288777M9[t] + 0.639151419026464M10[t] + 0.504141234618875M11[t] -0.00444541894845899t + e[t] |
| Multiple Linear Regression - Ordinary Least Squares | |||||
| Variable | Parameter | S.D. | T-STAT H0: parameter = 0 | 2-tail p-value | 1-tail p-value |
| (Intercept) | -0.729216595290699 | 0.444382 | -1.641 | 0.108645 | 0.054323 |
| dnst | 0.771547876570157 | 0.128777 | 5.9914 | 0 | 0 |
| y1 | 0.259590756245638 | 0.10678 | 2.4311 | 0.019629 | 0.009814 |
| y2 | -0.324288162170647 | 0.15824 | -2.0493 | 0.047026 | 0.023513 |
| y3 | -0.107507909542879 | 0.137156 | -0.7838 | 0.437754 | 0.218877 |
| y4 | 0.144420397190849 | 0.143499 | 1.0064 | 0.320264 | 0.160132 |
| y5 | 0.443964966435733 | 0.127899 | 3.4712 | 0.001257 | 0.000629 |
| M1 | 0.0983821269698033 | 0.426031 | 0.2309 | 0.818549 | 0.409274 |
| M2 | 0.165757665776796 | 0.422258 | 0.3926 | 0.696736 | 0.348368 |
| M3 | 0.616461506665139 | 0.429299 | 1.436 | 0.158785 | 0.079393 |
| M4 | 0.527372688535687 | 0.433325 | 1.217 | 0.230722 | 0.115361 |
| M5 | 0.806866310733002 | 0.421667 | 1.9135 | 0.062858 | 0.031429 |
| M6 | 0.530453908871542 | 0.432543 | 1.2264 | 0.227234 | 0.113617 |
| M7 | 0.516266033363936 | 0.430148 | 1.2002 | 0.237119 | 0.11856 |
| M8 | 0.463812304639643 | 0.435468 | 1.0651 | 0.293223 | 0.146611 |
| M9 | 0.469250583288777 | 0.436026 | 1.0762 | 0.288287 | 0.144144 |
| M10 | 0.639151419026464 | 0.425767 | 1.5012 | 0.141163 | 0.070582 |
| M11 | 0.504141234618875 | 0.42189 | 1.195 | 0.239141 | 0.11957 |
| t | -0.00444541894845899 | 0.005431 | -0.8185 | 0.417908 | 0.208954 |
| Multiple Linear Regression - Regression Statistics | |
| Multiple R | 0.94277800551632 |
| R-squared | 0.88883036768533 |
| Adjusted R-squared | 0.838804033143728 |
| F-TEST (value) | 17.7672495062812 |
| F-TEST (DF numerator) | 18 |
| F-TEST (DF denominator) | 40 |
| p-value | 1.05693231944315e-13 |
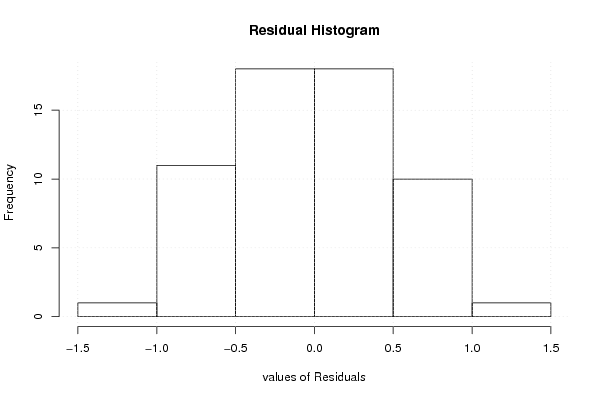
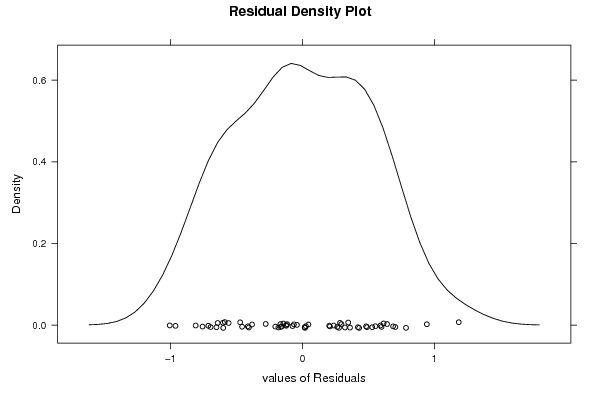
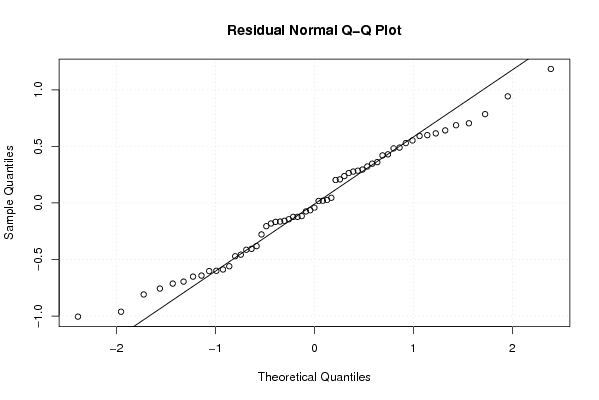
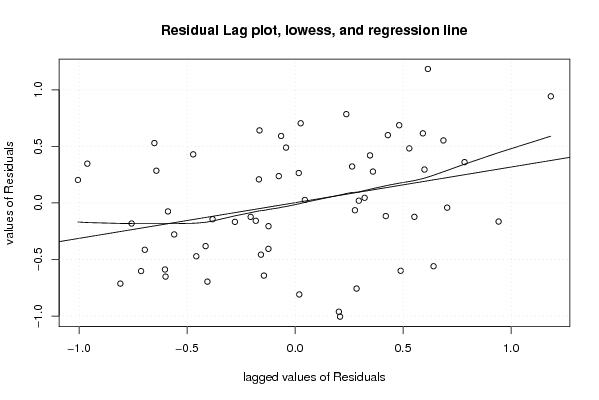
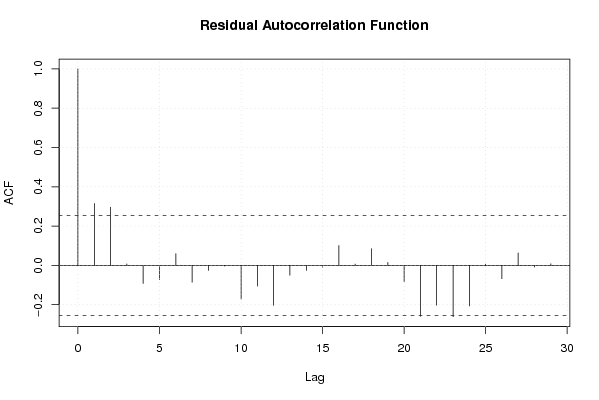
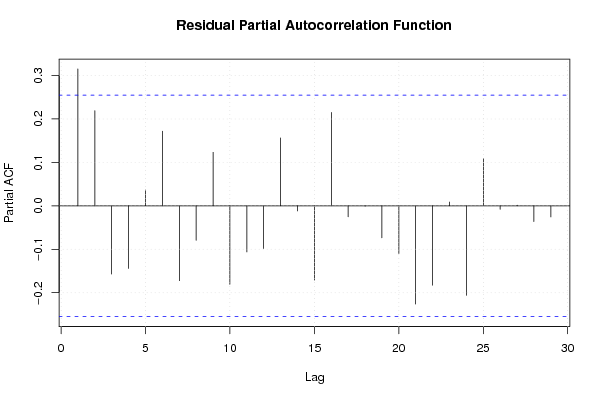
| Multiple Linear Regression - Residual Statistics | |
| Residual Standard Deviation | 0.616571628980764 |
| Sum Squared Residuals | 15.2064229465597 |
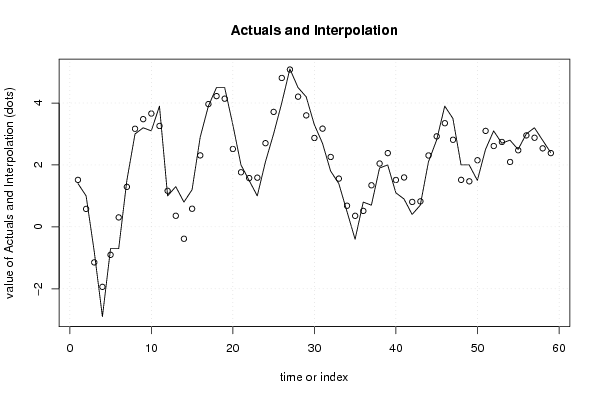
| Multiple Linear Regression - Actuals, Interpolation, and Residuals | |||
| Time or Index | Actuals | Interpolation Forecast | Residuals Prediction Error |
| 1 | 1.4 | 1.51615084871885 | -0.116150848718851 |
| 2 | 1 | 0.579779094667316 | 0.420220905332684 |
| 3 | -0.8 | -1.14708846400720 | 0.347088464007197 |
| 4 | -2.9 | -1.93794350746888 | -0.962056492531122 |
| 5 | -0.7 | -0.902855913860021 | 0.202855913860021 |
| 6 | -0.7 | 0.305394414236960 | -1.00539441423696 |
| 7 | 1.5 | 1.29173110714735 | 0.208268892852651 |
| 8 | 3 | 3.16734693446111 | -0.167346934461113 |
| 9 | 3.2 | 3.47848030148526 | -0.27848030148526 |
| 10 | 3.1 | 3.65970697497630 | -0.559706974976296 |
| 11 | 3.9 | 3.25866036489077 | 0.641339635109231 |
| 12 | 1 | 1.16471932922785 | -0.164719329227850 |
| 13 | 1.3 | 0.357370619976431 | 0.942629380023569 |
| 14 | 0.8 | -0.384536857095754 | 1.18453685709575 |
| 15 | 1.2 | 0.58486875175523 | 0.61513124824477 |
| 16 | 2.9 | 2.30810613342526 | 0.59189386657474 |
| 17 | 3.9 | 3.96471512959917 | -0.0647151295991742 |
| 18 | 4.5 | 4.22274533112759 | 0.277254668872406 |
| 19 | 4.5 | 4.13936500364154 | 0.360634996358457 |
| 20 | 3.3 | 2.51506719378454 | 0.784932806215458 |
| 21 | 2 | 1.76272093083875 | 0.237279069161248 |
| 22 | 1.5 | 1.57525127711698 | -0.0752512771169794 |
| 23 | 1 | 1.58846572794806 | -0.588465727948059 |
| 24 | 2.1 | 2.70247193849348 | -0.602471938493483 |
| 25 | 3 | 3.71316950190142 | -0.71316950190142 |
| 26 | 4 | 4.80909483753591 | -0.809094837535908 |
| 27 | 5.1 | 5.08050128338402 | 0.0194987166159812 |
| 28 | 4.5 | 4.20477911151452 | 0.295220888485478 |
| 29 | 4.2 | 3.60067337120741 | 0.599326628792594 |
| 30 | 3.3 | 2.87037946689991 | 0.429620533100088 |
| 31 | 2.7 | 3.1716897034693 | -0.471689703469303 |
| 32 | 1.8 | 2.25741409713870 | -0.457414097138697 |
| 33 | 1.4 | 1.55801442355075 | -0.158014423550746 |
| 34 | 0.5 | 0.681841193208814 | -0.181841193208814 |
| 35 | -0.4 | 0.357012370938903 | -0.757012370938903 |
| 36 | 0.8 | 0.515143251735245 | 0.284856748264755 |
| 37 | 0.7 | 1.34240890741249 | -0.642408907412486 |
| 38 | 1.9 | 2.04420878225251 | -0.144208782252515 |
| 39 | 2 | 2.38190921982621 | -0.381909219826208 |
| 40 | 1.1 | 1.51421036970784 | -0.41421036970784 |
| 41 | 0.9 | 1.59579404154382 | -0.695794041543819 |
| 42 | 0.4 | 0.805886298537762 | -0.405886298537762 |
| 43 | 0.7 | 0.823349514499889 | -0.123349514499889 |
| 44 | 2.1 | 2.30560720091432 | -0.205607200914316 |
| 45 | 2.8 | 2.92296942632349 | -0.122969426323488 |
| 46 | 3.9 | 3.34740746105416 | 0.552592538945842 |
| 47 | 3.5 | 2.81299859267776 | 0.687001407322235 |
| 48 | 2 | 1.51766548054342 | 0.482334519456579 |
| 49 | 2 | 1.47090012199081 | 0.529099878009188 |
| 50 | 1.5 | 2.15145414264002 | -0.651454142640015 |
| 51 | 2.5 | 3.09980920904174 | -0.59980920904174 |
| 52 | 3.1 | 2.61084789282126 | 0.489152107178743 |
| 53 | 2.7 | 2.74167337150962 | -0.041673371509623 |
| 54 | 2.8 | 2.09559448919777 | 0.704405510802226 |
| 55 | 2.5 | 2.47386467124192 | 0.0261353287580837 |
| 56 | 3 | 2.95456457370133 | 0.0454354262986676 |
| 57 | 3.2 | 2.87781491780176 | 0.322185082198245 |
| 58 | 2.8 | 2.53579309364375 | 0.264206906356247 |
| 59 | 2.4 | 2.38286294354450 | 0.017137056455496 |
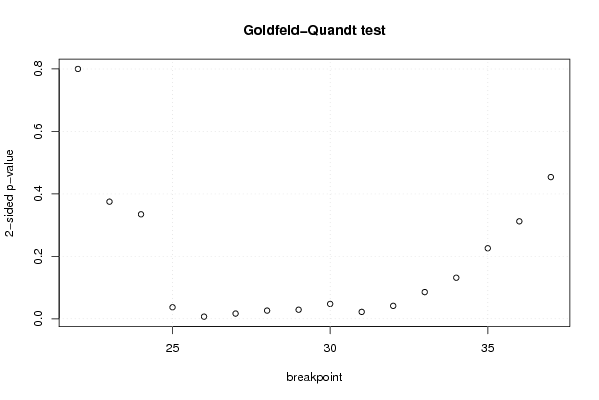
| Goldfeld-Quandt test for Heteroskedasticity | |||
| p-values | Alternative Hypothesis | ||
| breakpoint index | greater | 2-sided | less |
| 22 | 0.599929646119163 | 0.800140707761673 | 0.400070353880837 |
| 23 | 0.812483496298936 | 0.375033007402127 | 0.187516503701064 |
| 24 | 0.832692517892448 | 0.334614964215103 | 0.167307482107552 |
| 25 | 0.98157864006673 | 0.0368427198665406 | 0.0184213599332703 |
| 26 | 0.996586219089001 | 0.00682756182199829 | 0.00341378091099914 |
| 27 | 0.991648134103495 | 0.0167037317930101 | 0.00835186589650504 |
| 28 | 0.9868762301915 | 0.0262475396170011 | 0.0131237698085005 |
| 29 | 0.985492770238583 | 0.0290144595228337 | 0.0145072297614169 |
| 30 | 0.976213140029853 | 0.047573719940293 | 0.0237868599701465 |
| 31 | 0.988968632529727 | 0.0220627349405458 | 0.0110313674702729 |
| 32 | 0.979270208184443 | 0.0414595836311131 | 0.0207297918155566 |
| 33 | 0.957265069358884 | 0.0854698612822327 | 0.0427349306411164 |
| 34 | 0.934245289439733 | 0.131509421120534 | 0.0657547105602668 |
| 35 | 0.887059501082386 | 0.225880997835229 | 0.112940498917614 |
| 36 | 0.84393590693589 | 0.312128186128220 | 0.156064093064110 |
| 37 | 0.773083450355551 | 0.453833099288899 | 0.226916549644449 |
| Meta Analysis of Goldfeld-Quandt test for Heteroskedasticity | |||
| Description | # significant tests | % significant tests | OK/NOK |
| 1% type I error level | 1 | 0.0625 | NOK |
| 5% type I error level | 8 | 0.5 | NOK |
| 10% type I error level | 9 | 0.5625 | NOK |